A&A 375, 411-418 (2001)
DOI: 10.1051/0004-6361:20010840
Projection effects in the spectra of early-type pulsating stars
P. Montañés Rodriguez - C. S. Jeffery
Armagh Observatory, College Hill,
Armagh BT61 9DG, Northern Ireland, UK
Received 13 July 2000 / Accepted 7 June 2001
Abstract
The relation between the surface velocity of a pulsating star in the star's
inertial frame and the apparent expansion velocity measured by a remote observer
has been classically formulated in terms of a projection factor p. This factor
depends on the relative limb darkening in continuum and spectral lines and
may therefore be a function of composition. We have computed synthetic spectra
to investigate the behaviour of p and, indeed, of the apparent line profile
for radially pulsating stars over a range of temperature and gravity with
hydrogen-rich and hydrogen-poor atmospheres. We have
subsequently derived values of p suitable for the interpretation of velocity
measurements of pulsating early type stars.
Effective temperature has the most important influence on p:
a change of 10 000 K in
 introduces a change of 2-3
per cent with important consequences for measurements of stellar
radii to an accuracy
introduces a change of 2-3
per cent with important consequences for measurements of stellar
radii to an accuracy  .
.
Key words: stars: early-type -
stars: pulsations -
stars: atmospheres
The expansion of a pulsating stellar atmosphere introduces a Doppler shift to the
absorption spectrum. As a consequence of stellar surfaces being approximately spherical
rather than coplanar with the sky, the apparent Doppler shift is a convolution of the
projected motion
 with the specific intensity
 over
the surface of the star (
over
the surface of the star (
 ).
Formally, the total flux can be written,
).
Formally, the total flux can be written,
 |
(1) |
This projection effect causes a given absorption line to become broader
and asymmetric as the expansion (or contraction)
velocity increases.
For an observer, the problem arises when an apparent expansion velocity,
measured from the stellar absorption lines, needs to be converted into a
expansion velocity in the star's inertial frame. This problem is most severe
if the resolution of the observed spectrum, and its convolution with
other line-broadening mechanisms (e.g. rotation, thermal, pressure,
instrumental, acceleration) makes an inversion of Eq. (1)
intractable. It has frequently been solved by recourse to a
projection factor p used to relate the apparent v and
true expansion velocity  of the stellar surface,
 |
(2) |
Another problem arises with the spectroscopic measurement of
stellar properties (e.g. effective temperature, surface gravity, chemical
composition) where the line profile is of primary importance. Hence an
ability to compute synthetic spectra which take Eq. (1) into account
is important in any detailed analysis of radially pulsating stars.
Early work was carried out by Eddington (1926) and Carroll (1928)
for rotating and expanding atmospheres. After introducing an approximate
expression for the limb darkening, both deduced a value p=24/17.
Subsequently, Getting (1935) arrived at the same result by averaging line-of-sight
velocity components over a limb-darkened stellar disk.
This value was used for several decades in order to apply the Baade-Wesselink
(1946) method to measure the radius of a pulsating star.
In more modern times, Parsons (1972) adopted the more rigorous approach of
computing the nett line profile from appropriately shifted profiles at different parts
of the stellar disk. Previous calculations of this type, which had
assumed Gaussian absorption profiles, had originally been made by
Shapley & Nicholson (1919). Parsons introduced the monochromatic emergent
intensities
computed from an appropriate model atmosphere in
local thermodynamic equilibrium (LTE). The apparent velocity v of the line was
given by the effective line center measured at 0.6 of the central line depth, in
order to simulate the operation of a Grant comparator. Parsons thus obtained a
value
 where
where
 |
(3) |
is the expansion velocity scaled by the half width (in velocity units)
at half depth of the line (wavelength  )
)
 |
(4) |
Subsequently, Karp (1973, 1975) considered the effects of
velocity gradients and weak and strong line profiles in moving atmospheres,
while Hindsley & Bell (1986) simulated the use of photoelectric-radial
velocity spectrometers. They also reported a variation of p due to the variation
in limb-darkening in the absorption lines with stellar temperature.
These values of p vary between 1.31 (
 K) and 1.37 (
 K).
K).
More detailed velocity structures are taken into account by
Sasselov et al. (1989) who proved that an error of around 20-40 per cent in the radius given by the
Baade-Wesselink method would arise when the asymmetry of the line is not considered.
Sasselov & Lester (1990) also showed that, for Cepheids, p becomes larger in the infrared than
in the visible by about 10 per cent,
while Albrow & Cottrell (1994) included a new treatment of macroturbulence and also reported
 per cent larger than in previous studies.
While most previous studies have been directed towards studies of Cepheids and
similar stars, all have made the assumption that the stellar atmosphere has a
normal hydrogen abundance. One question posed by Lynas-Gray et al. (1984) was
whether Parsons' (1972)
results for classical Cepheids could be applied directly to the
pulsating helium star V652 Her. Since the
opacities in the atmospheres of hydrogen-rich Cepheids and
hydrogen-deficient pulsators are very different, as are their radii,
the answer was not self-evident. Subsequent detailed studies of the
projection effect in Cepheids and RR Lyraes (referred to
already) shed no further light on this particular problem.
In this paper we report the development of techniques for computing
synthetic spectra for radially expanding (or contracting) atmospheres.
These have been applied, in particular, to models for early-type stars
with extremely helium-rich surfaces for application to recent observations
of pulsating helium stars V652 Her and BX Cir (Jeffery et al. 2001;
Woolf & Jeffery 2000).
The behaviour of the absorption line profiles and the radial
velocities measured therefrom have been examined in detail, and the
results interpreted in terms of the projection factor p.
The projection effect is closely related to
that of limb darkening, which is essentially a function
of the distribution of continuous opacity with optical depth
in the stellar atmosphere. It is therefore expected to be
a function of both wavelength and effective temperature,
as well as chemical composition. Although the primary purpose of
this investigation was to measure the projection effect for
radially pulsating extreme helium stars, it was important to
distinguish whether composition or effective temperature is
the major factor. Thus, the case of radially-pulsating
early-type stars of normal composition has also been considered.
Typical examples include the radial-mode  Cepheids.
Line-blanketed plane-parallel models are calculated with the program STERNE, which assumes local thermodynamic,
radiative and hydrostatic equilibrium. Full details have been given by Jeffery & Heber (1992) and Jeffery et al. (2001).
In order to investigate the effect of helium abundance in models of immediate interest, we used the
models, with effective temperature
,
surface gravity log g and hydrogen abundance  (fractional by number) given by
a)
15 000 K,
 ,
,
 ,
,
b)
25 000 K,
,
 ,
,
c)
25 000 K,
,
,
and
d)
25 000 K,
 ,
.
,
.
In all cases, the metal abundances ( )
were solar and the helium abundances equal to 1 - - .
In models b) and c)
)
were solar and the helium abundances equal to 1 - - .
In models b) and c)
 and
and
 are close to those reported for pulsating helium stars
V652 Her and BX Cir (Jeffery et al. 1999; Woolf & Jeffery 2000). Models a) and d) were calculated to study
the effect of an increase on g and a decrease on
.
are close to those reported for pulsating helium stars
V652 Her and BX Cir (Jeffery et al. 1999; Woolf & Jeffery 2000). Models a) and d) were calculated to study
the effect of an increase on g and a decrease on
.
These models are used as input for the formal solution of the radiative transfer equations.
This is carried out using the program SPECTRUM, our synthetic spectrum generator (Jeffery
et al. 2001).
One mode of operation of SPECTRUM provides the emergent intensities
at specific cosine angles  ,
either for a given absorption line or for an entire region
of spectrum including several hundred absorption lines.
,
either for a given absorption line or for an entire region
of spectrum including several hundred absorption lines.
The linelists for the 15 000 K model are less complete than for
the higher temperature models. This is not important for this paper
because it is the average behaviour of a significant sample of
absorption lines, rather than a detailed simulation of the spectrum, that
is of interest.
We note that in the pulsating atmosphere of an early-type or luminous
star, the standard approximations (LTE, etc.) may break down, particularly
in strong lines (non-LTE) or at minimum radius (shocks). In general,
these lines are best avoided when making radial-velocity measurements by,
for example, cross-correlation. In the case of V652 Her (Jeffery et al.
2001), a shock does occur at minimum radius, causing splitting in the
strongest lines. However, for 90% of the pulsation cycle, the LTE
plane-parallel approximation has, so far, proved satisfactory.
This output is then used as input for the evaluation of Eq. (1)
for a range of individual line profiles and synthetic spectra. Emergent intensities
were calculated for 11 cosine angles (
 ),
and Eq. (1) was evaluated using Simpson integration. Individual lines
included a range of weak and strong lines seen in the spectra of pulsating helium stars,
including He I 4471 Å, He I 4438 Å, N II 4202 Å,
N III 4510 Å, Si III 4553 Å, and Fe III 4396 Å.
),
and Eq. (1) was evaluated using Simpson integration. Individual lines
included a range of weak and strong lines seen in the spectra of pulsating helium stars,
including He I 4471 Å, He I 4438 Å, N II 4202 Å,
N III 4510 Å, Si III 4553 Å, and Fe III 4396 Å.
After integration, the line profiles and synthetic spectra were normalized to the
continuum. An illustration of the procedure, showing the normalized limb-darkened
Doppler-shifted emergent intensity profiles at specific cosine limb-angles and the disk-integrated
line profile is shown in Fig. 1.
![\begin{figure}
\par\includegraphics[width=10cm,clip]{H2322F1new.PS}\end{figure}](/articles/aa/full/2001/32/aah2322/Timg42.gif) |
Figure 1:
Line profiles from four different expanding stellar atmospheres.
Projected specific intensities at cosine limb-angles
 for
He I 4471 Å, Si III 4553 Å, Fe III 4396 Å and He I 4438 Å
for
for
He I 4471 Å, Si III 4553 Å, Fe III 4396 Å and He I 4438 Å
for
 for the models (left label) a), b), c) and d). In thicker line
appear the intrinsic and apparent fluxes; note the asymmetry and blue shift of the apparent
lines, both intrinsic and apparent lines have the same equivalent width.
for the models (left label) a), b), c) and d). In thicker line
appear the intrinsic and apparent fluxes; note the asymmetry and blue shift of the apparent
lines, both intrinsic and apparent lines have the same equivalent width. |
| Open with DEXTER |
![\begin{figure}
\par\includegraphics[width=10cm,clip]{H2322F2.PS}\par\end{figure}](/articles/aa/full/2001/32/aah2322/Timg43.gif) |
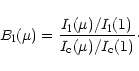
Figure 2:
The normalized emergent intensity (
 )
is shown (left) as a function of
for the four different models at a wavelength of 4471 Å.
In the right-hand panel, the limb-darkening in the line relative to the limb-darkening in the continuum
is compared for both weak ( Fe III 4396 Å) and strong lines ( He I 4471 Å). )
is shown (left) as a function of
for the four different models at a wavelength of 4471 Å.
In the right-hand panel, the limb-darkening in the line relative to the limb-darkening in the continuum
is compared for both weak ( Fe III 4396 Å) and strong lines ( He I 4471 Å). |
| Open with DEXTER |
It may be deduced from Eq. (1) that the main factor controlling
the degree of asymmetry and hence the apparent line shift is effectively the ratio
of limb darkening in the line to limb darkening in the continuum - in
other words, how does the line strength change towards the stellar
limb? We computed  in the continuum
  and in the cores
 of a variety of absorption lines and we found that at 4471 Å limb
darkening is reduced by an increase in helium abundance, effective temperature or
surface gravity (Fig. 2).
of a variety of absorption lines and we found that at 4471 Å limb
darkening is reduced by an increase in helium abundance, effective temperature or
surface gravity (Fig. 2).
We also compared the limb darkening in the line
 for both weak and strong
absorption lines (Fig. 2, right panel). The
limb-darkening has been normalized to
for both weak and strong
absorption lines (Fig. 2, right panel). The
limb-darkening has been normalized to
 to isolate the limb-darkening
due to the lines, it can be defined as,
to isolate the limb-darkening
due to the lines, it can be defined as,
 |
(5) |
If
 for all ,
the line is undarkened. This is the case for
line photons formed at small continuum optical depths, like the core of He I 4471
in the high-gravity model.
The zero-velocity contribution to the profile integrated over the disk is thus
significant, and dilutes the higher velocity contribution from points close to
the stellar center. If repeated over the whole line profile, this would increase
the line asymmetry and also the projection factor p.
for all ,
the line is undarkened. This is the case for
line photons formed at small continuum optical depths, like the core of He I 4471
in the high-gravity model.
The zero-velocity contribution to the profile integrated over the disk is thus
significant, and dilutes the higher velocity contribution from points close to
the stellar center. If repeated over the whole line profile, this would increase
the line asymmetry and also the projection factor p.
If the line-to-continuous opacity ratio is reduced, line flux
is formed at increasing depths. Then
can increase substantially
towards small
- the corollary is that for weak lines the
relative absorption is reduced towards the limb,
the high velocity contribution from  dominates,
the line is more symmetric and p should be smaller.
Figure 2 demonstrates that varying any atmospheric parameter
has considerable influence on line darkening in the regions of
strongest absorption, but that for moderately weak lines
(e.g. Fe III), only the surface gravity has a significant
effect.
dominates,
the line is more symmetric and p should be smaller.
Figure 2 demonstrates that varying any atmospheric parameter
has considerable influence on line darkening in the regions of
strongest absorption, but that for moderately weak lines
(e.g. Fe III), only the surface gravity has a significant
effect.
![\begin{figure}
\par\includegraphics[width=10cm,clip]{H2322F3.PS}\par\end{figure}](/articles/aa/full/2001/32/aah2322/Timg53.gif) |
Figure 3:
Relationship between the projection factor p and the
scaled expansion velocity
 for the cases of individual lines and the whole spectrum,
for three solar composition models and a helium-rich model (top, right).
for the cases of individual lines and the whole spectrum,
for three solar composition models and a helium-rich model (top, right). |
| Open with DEXTER |
Similar pairs of a representative range of theoretical line profiles
were computed for a range of hydrogen-rich models and for one hydrogen-poor model,
and for a range of expansion velocities .
The continuum was
subtracted and the wavelengths were converted to a logarithmic scale.
The cross-correlation function (ccf) of the projected line profile
relative to the stationary line profile was calculated and transformed
to velocity units. To find the position of the ccf maximum, we used a
number of different methods including fitting Gaussians and parabolae
to different fractions of the ccf maximum. It was apparent from these
experiments that the method for measuring v is crucial and that
the determination of p must be done in a manner consistent with the
observational measurement of v.
Taking the position of the ccf maximum to represent v,
values for the projection factor
 are shown in Table 1
and Fig. 3. These data were obtained from fitting a Gaussian
to points within 30% of the ccf maximum.
are shown in Table 1
and Fig. 3. These data were obtained from fitting a Gaussian
to points within 30% of the ccf maximum.
The intrinsic profiles of different lines vary due to differences
in the ion mass and the damping profiles. However these differences can be accounted for by
considering the line half-width (
 ). The apparent velocities for each line
are shown in Fig. 3 in the form
plotted against
). The apparent velocities for each line
are shown in Fig. 3 in the form
plotted against
 .
Line widths at half depth
for the six studied lines in each model are shown in Table 2.
.
Line widths at half depth
for the six studied lines in each model are shown in Table 2.
Most points, corresponding to different lines and different
expansion velocities, fall approximately on the same curve. The major
exception is the
N III 4510 Å line. Its position was found to be sensitive to the
adopted abundance; it was possible to match the other line positions by increasing
the nitrogen abundance. At the adopted abundance, this line is
considerably weaker than all the others and, at large cosine limb-angles,
the numerical quadrature of Eq. (1) became very inaccurate.
Other numerical errors in determining p arise principally from sampling in the ccf. As the ccf becomes
broader for larger
or for stronger lines, the number of points above some critical
value in the ccf will increase. It is these points which are used to define the Gaussian
which gives v.
This ambiguity reflects the principal uncertainty in determining p, that is,
the choice of method by which the radial velocity is measured.
However, since most data fall on the same curve, we are satisfied that we understand the
systematic effects prior to investigating the use of cross-correlation techniques for large
sections of spectrum.
![\begin{figure}
\par\includegraphics[width=7.8cm,clip]{H2322F4.PS}\par\end{figure}](/articles/aa/full/2001/32/aah2322/Timg67.gif) |
Figure 4:
Normalized synthetic spectra with no expansion used in the comparison
of p in the four model atmospheres considered. Note that all lines except
H ,
are stronger in the He-rich spectrum. The principal H, He I
and Si III lines are marked. ,
are stronger in the He-rich spectrum. The principal H, He I
and Si III lines are marked. |
| Open with DEXTER |
Table 3:
Projection factors for the entire spectrum (4256-4980 Å)
(formal errors on last digit in parentheses).
|
Model |
a) |
b) |
c) |
d) |
| |
0.90 |
0.01 |
0.90 |
0.90 |
 |
3.5 |
3.5 |
3.5 |
5.5 |
|
|
15 000 |
25 000 |
25 000 |
25 000 |
| |
p |
| 25 |
1.410(1) |
1.380(3) |
1.382(2) |
1.387(3) |
| 45 |
1.392(1) |
1.367(2) |
1.370(2) |
1.373(2) |
| 65 |
1.366(2) |
1.351(2) |
1.351(2) |
1.353(2) |
| 85 |
1.337(2) |
1.336(3) |
1.331(2) |
1.333(3) |
| 105 |
1.308(2) |
1.314(3) |
1.306(3) |
1.310(3) |
It is evident that the projection scale factor must be determined as
far as possible by measuring the expansion velocity of the theoretical
spectrum in exactly the same way as the observed spectrum is to be measured.
Theoretical spectra were constructed by applying Eq. (1) to synthetic
spectra computed in the interval
 Å,
corresponding to new observations of V652 Her (Jeffrey et al. 2001).
The theoretical intensity spectra were calculated with
microturbulent velocity 5
Å,
corresponding to new observations of V652 Her (Jeffrey et al. 2001).
The theoretical intensity spectra were calculated with
microturbulent velocity 5
 ,
and with
a solar composition (H-rich model) and the composition
derived for V652 Her (H-poor model, Jeffery et al. 1999).
After evaluating Eq. (1) for expansion velocities
,
and with
a solar composition (H-rich model) and the composition
derived for V652 Her (H-poor model, Jeffery et al. 1999).
After evaluating Eq. (1) for expansion velocities
 and
105
,
the resolution of the emergent spectra
was degraded to R=20 000, corresponding to the new observations.
and
105
,
the resolution of the emergent spectra
was degraded to R=20 000, corresponding to the new observations.
Expansion velocities v were measured from the entire spectrum by
cross-correlation with the non-expanding models, after removing the
broadest H and He I lines. The mean line-widths
 of the spectra used in the calculation of
were 0.7998 Å, 1.0575 Å, 0.9699 Å,
1.0632 Å for the models a), b), c) and d) respectively. The mean line widths
obtained from the auto-correlation function represent an average over all lines
selected and is only meaningful in terms of other quantities measured from
the same region of the spectrum. It is dominated by the choice of lines
included (e.g. blends, doublets, collisional broadening) and will generally be
larger than for isolated weak lines. The mean line widths also reflect the fact that the
spectra have been smoothed to simulate the instrumental broadening (
FWHM= 0.4460 Å).
of the spectra used in the calculation of
were 0.7998 Å, 1.0575 Å, 0.9699 Å,
1.0632 Å for the models a), b), c) and d) respectively. The mean line widths
obtained from the auto-correlation function represent an average over all lines
selected and is only meaningful in terms of other quantities measured from
the same region of the spectrum. It is dominated by the choice of lines
included (e.g. blends, doublets, collisional broadening) and will generally be
larger than for isolated weak lines. The mean line widths also reflect the fact that the
spectra have been smoothed to simulate the instrumental broadening (
FWHM= 0.4460 Å).
The resulting projection factors are shown in Fig. 3 (filled circles)
and Table 3.
Weak lines noted above will contribute in a minor way to the overall ccf
and could possibly affect the measurement of v. However it appears
from the co-incidence of p measured from a large region of
spectrum with p measured from moderate to strong lines, that the
nett contribution of weak lines is negligible.
In order to compare the results and to use them in correcting observed expansion
velocities, we have constructed analytic fits. We find that for
 ,
there is an approximately linear relation between p and
of the form:
,
there is an approximately linear relation between p and
of the form:
 |
(6) |
![\begin{figure}
\par\includegraphics[width=7.5cm,clip]{H2322F5.PS}\par\end{figure}](/articles/aa/full/2001/32/aah2322/Timg79.gif) |
Figure 5:
Projection factors p as a function of the modified
 for rotationally-broadened spectra with
 and
and
 .
The linear fits
to .
The linear fits
to  from Eq. (6) and the result obtained
by Parsons for cooler (
from Eq. (6) and the result obtained
by Parsons for cooler (
 K) and lower gravity ( K) and lower gravity (
 )
model atmospheres
is also shown. )
model atmospheres
is also shown. |
| Open with DEXTER |
Table 4 also gives coefficients for Eq. (6) for
model atmospheres with varying effective temperature and
surface gravity.
It has been noted that p should be greatest for
the strongest lines; the largest values of p are seen for He I
lines in the high-gravity model (Fig. 3).
Surface gravity has already been noted to reduce the
line limb darkening (
)
thus leading to the higher value of a0 seen in Table 4.
Otherwise, values of p obtained by cross-correlating the whole
spectrum are reduced by an increase in
helium abundance and effective temperature. The effect of composition
may indeed be the smallest of all three as measured by the current models.
The values of p obtained from the whole spectrum
measurements for
15 000 K are larger than those for all other
absorption lines.
This may be because the lower
spectrum is dominated by weak lines of lower
ionization potential ions. together with the smaller thermal broadening, the intrinsic
line widths are smaller, on average, than the individual lines chosen for comparison.
This should not have affected the overall result because of the use of .
However, the change in balance of broad and narrow lines from, for example, light
and heavy ions may have affected p and
in different ways. This
appears to be borne out by the Fe III line which behaves similarly to the
whole spectrum in Fig. 3 for the 15 000 K model.
It is however clear that projection factors for all these models are
higher than those normally used for the much cooler classical Cepheids
(Parsons 1972).
An investigation of the effect of rotation was carried out in which the integrated
emergent spectra of the previous section were convolved with a rotation
broadening function (Unsöld 1955)
for projected rotation velocities
.
This has already been demonstrated by Duval & Karp (1978) who showed how a small
amount of rotation may make an asymmetric line profile even more asymmetric.
The consequence is that the projection factor is increased with  .
.
For practical purposes it may be better to consider
where
 is the mean line half-width of the
rotationally-broadened spectrum with expansion velocity
is the mean line half-width of the
rotationally-broadened spectrum with expansion velocity  (Fig. 5).
Even in this framework, the effect of rotations is unclear, and some correction will be
required in order to apply Eq. (6).
(Fig. 5).
Even in this framework, the effect of rotations is unclear, and some correction will be
required in order to apply Eq. (6).
The aim of this paper was to investigate the rôle of chemical composition
on the projection factor relating the apparent and true radial velocities in
radially pulsating stars, with particular reference to the case of B-type
helium stars. We have calculated appropriate profiles for a range of
spectral lines in both hydrogen-rich and helium-rich stellar atmospheres,
and have simulated contemporary cross-correlation measurements using synthetic
spectra. The well-known dependence of the projection factor on the width of
the spectral line being used has been reproduced. The use of a large region
of spectrum gives results consistent with individual line profiles when a
mean line profile is used to normalize the expansion velocities. The effect
of rotational broadening can also be taken into account if the line width can
be measured at a phase when the star is not expanding or contracting.
Variations in
have the most significant influence on p,
being  greater than Parson's values for a 25 000 K star
and
greater than Parson's values for a 25 000 K star
and  greater at
 .
After normalisation for the
intrinsic line width, the influence of gravity, rotation and composition
is an order of magnitude smaller than this. Although modest, the
effect is highly significant when direct measurements of stellar
radii seek to achieve accuracies of 1% or better since, using
Baade's method,
.
After normalisation for the
intrinsic line width, the influence of gravity, rotation and composition
is an order of magnitude smaller than this. Although modest, the
effect is highly significant when direct measurements of stellar
radii seek to achieve accuracies of 1% or better since, using
Baade's method,
 .
Jeffery et al. (2001) achieved
.
Jeffery et al. (2001) achieved
 in their study of V652 Her.
Even moderate resolution studies (
in their study of V652 Her.
Even moderate resolution studies (
 )
may be compromised by
a systematic error of this magnitude.
)
may be compromised by
a systematic error of this magnitude.
The factor p to be adopted should always be determined from simulations
that mimic the observational procedure as closely as possible. If, however, we
had determined p from simulations of the Si III line (Table 1) but had
measured radial velocities by cross-correlating blue-optical spectra similar
to those described in Sect. 3.3, we would have found p and hence R too small by .
Choosing an arbitrary single line to determine p could lead to errors in R of up to 10% given the same ccf measurement of v. We have determined linear relations which should be appropriate for cross-correlation measurements of pulsating B stars observed in the blue-optical with a resolution
 .
.
Acknowledgements
This research is supported by a grant to the Armagh Observatory from the Northern Ireland Department of Culture, Arts and Leisure. We are grateful to the referee whose valuable suggestions substantially improved this paper.
- Albrow, M. D., & Cottrell, P. L. 1994, MNRAS, 267, 548
In the text
NASA ADS
- Carroll, M. A. 1928, MNRAS, 88, 548
In the text
NASA ADS
- Duval, P., & Karp, A. H. 1978, ApJ, 222, 220
In the text
NASA ADS
- Eddington, A. S. 1926, The Internal Constitution of the Stars (Cambridge University Press), 185
In the text
- Getting, I. A. 1935, MNRAS, 95, 141
In the text
- Hill, P. W., Kilkenny, D., Schönberner, D., & Walker, H. J. 1981, MNRAS, 197, 81
NASA ADS
- Hindsley, R., & Bell, R. A. 1986, ASP Conf. Ser., 98, 881
In the text
- Jeffrey, C. S., & Heber, U. 1992, A&A, 206, 133
- Jeffrey, C. S., Hill, P. W., & Heber, U. 1999, A&A, 346, 491
In the text
NASA ADS
- Jeffrey, C. S., Woolf, V. M., & Pollacco, D. 2001, A&A, submitted
In the text
- Karp, A. H. 1973, ApJ, 180, 895
In the text
NASA ADS
- Karp, A. H. 1975, ApJ, 201, 641
In the text
NASA ADS
- Lynas-Gray, A. E., Schönberner, D., Hill, P. W., & Heber, U. 1984, MNRAS, 209, 387
In the text
NASA ADS
- Parsons, S. B. 1972, ApJ, 174, 57
In the text
NASA ADS
- Sasselov, D. D., Lester, J. B. & Fieldus, M. S. 1989, ApJ, 337, L29
In the text
NASA ADS
- Sasselov, D. D., & Lester, J. B. 1990, ApJ, 362, 333
In the text
NASA ADS
- Shapley, H., & Nicholson, S. B. 1919, Proc. Nature, Acad. Sci., 5, 417
In the text
- Unsöld, A. 1955, Physik der Sternatmosphären, 2nd ed. (Berlin Springer-Verlag)
In the text
- Wesselink, A. J. 1946, Bull. astr. Inst. Netherlands, 10, 91
In the text
NASA ADS
- Woolf, V. W., & Jeffrey, C. S. 2000, A&A, 358, 1001
In the text
NASA ADS
Copyright ESO 2001
![\begin{figure}
\par\includegraphics[width=10cm,clip]{H2322F1new.PS}\end{figure}](/articles/aa/full/2001/32/aah2322/img42.gif)
![\begin{figure}
\par\includegraphics[width=10cm,clip]{H2322F2.PS}\par\end{figure}](/articles/aa/full/2001/32/aah2322/img43.gif)
![\begin{figure}
\par\includegraphics[width=10cm,clip]{H2322F3.PS}\par\end{figure}](/articles/aa/full/2001/32/aah2322/img53.gif)
![\begin{figure}
\par\includegraphics[width=7.8cm,clip]{H2322F4.PS}\par\end{figure}](/articles/aa/full/2001/32/aah2322/img67.gif)
![\begin{figure}
\par\includegraphics[width=7.5cm,clip]{H2322F5.PS}\par\end{figure}](/articles/aa/full/2001/32/aah2322/img79.gif)