A&A 375, 122-129 (2001)
DOI: 10.1051/0004-6361:20010812
New spectroscopic observations of the B[e]/K binary system MWC623
F.-J. Zickgraf
Hamburger Sternwarte, Gojenbergsweg 112, 21029 Hamburg, Germany
Received 10 April 2001 / Accepted 30 May 2001
Abstract
The B[e]/K binary system MWC623 was reinvestigated using new
spectroscopic observations. The absorption lines of the K and the B star
do not exhibit any significant radial velocity variations over a time interval of
14 years. The spectral classification using a recent echelle spectrum yielded spectral
types of K2II-Ib and B4III. The luminosity class of the K star gives an estimate
of the distance towards MWC623 of
2.4+1.4-0.9 kpc.
This is consistent with the kinematic distance of
2.0+0.6-0.3 kpc.
The masses derived from the locations of the binary components in the H-R diagram
are 
 and
and  for the B and K star, respectively, i.e.
the mass ratio is close to 1.
Both stars are coeval with an
age of
50+10-20 Myr as shown by the comparison with isochrones.
The high luminosity of the K star excludes a pre-main sequence evolutionary phase as
explanation for the strong Li I
for the B and K star, respectively, i.e.
the mass ratio is close to 1.
Both stars are coeval with an
age of
50+10-20 Myr as shown by the comparison with isochrones.
The high luminosity of the K star excludes a pre-main sequence evolutionary phase as
explanation for the strong Li I 6708 absorption line observed in the late-type
component. Rather, the high
lithium abundance is a consequence of the young age. Likewise, the B[e] star is a
slightly evolved object starting it post-main sequence evolution.
6708 absorption line observed in the late-type
component. Rather, the high
lithium abundance is a consequence of the young age. Likewise, the B[e] star is a
slightly evolved object starting it post-main sequence evolution.
Key words: stars: circumstellar matter - stars: early-type - stars:
late-type - stars: emission-line - stars: evolution
The emission-line object MWC623 was described by Allen & Swings
(1976) as a peculiar Be star with a strong near-infrared excess. The
spectrum they discussed was dominated by strong emission lines of the
Balmer series and numerous permitted and forbidden emission
lines of Fe II, [Fe II], and [O I]. Absorption lines were not reported.
Zickgraf & Stahl
(1989) (hereafter referred to as
Paper I) obtained high resolution spectroscopic observations
of this object. In addition to the rich emission
line spectrum they detected early-type and late-type
absorption features, namely He I absorption lines and numerous
absorption features of Fe I, Li I, Ca I, etc. The analysis of
these spectroscopic properties and of the continuum
energy distribution lead Zickgraf & Stahl to the conclusion that
MWC623 is actually a binary system consisting of a B2- and K2-type component.
Polarimetry of MWC623 carried out by Zickgraf & Schulte-Ladbeck
(1989) revealed
the presence of intrinsic polarization. These observations were
interpreted as being due to a bipolar wind structure as suggested for B[e]-type
stars e.g. by Zickgraf et al. (1985) (cf. also the review by
Zickgraf 1998, on B[e]-type stars). The presence of intrinsic
polarization was considered indicative for an inclination angle deviating
significantly from pole-on.
A puzzling discovery was the existence of a strong absorption line of lithium,
Li I6708 Å. Because it seemed unlikely that the late component in
MWC623 is a TTauri star Zickgraf & Stahl proposed
that the high lithium abundance
of the K star might be produced during He-flashes occuring when the
K star evolves along the giant branch or alternatively that the object
is just not old enough to have the lithium completely depleted.
In this paper new spectroscopic observations of MWC623 are presented.
The purpose here is to investigate for the first time variability of the spectrum
and to rediscuss the evolutionary scenario for MWC623 based on
a revised spectral classification of the binary components. The
outline of the paper is as follows.
The observations are described in Sect. 2.
Radial velocity measurements are discussed in Sect. 3.
In Sect. 4 spectroscopic
variability is investigated. The stellar parameters and evolutionary status
are discussed in Sect. 5. Finally, conclusions are summarized in Sect. 6
2 New spectroscopic observations
MWC623 was observed on October 21, 1998 and June 16, 2000.
The observations in
1998 were obtained with the spectrograph AURELIE at the 1.5 m telescope of the
Observatoire de Haute Provence. A description of the
spectrograph can be found in Gillet et al. (1994).
The spectra were observed with grating No. 2
with 1200 linesmm-1 giving a reciprocal linear dispersion of 8 Åmm-1.
The detector was a double-barrette Thomson TH7832 (2048 pixel with
13  m pixel size). The spectra cover the wavelength interval from
6540 Å to 6740 Å. The resolution of the spectra is 20000. Wavelength
calibration was obtained with neon and argon lamps.
m pixel size). The spectra cover the wavelength interval from
6540 Å to 6740 Å. The resolution of the spectra is 20000. Wavelength
calibration was obtained with neon and argon lamps.
The spectrum of June 2000 was observed with the echelle spectrograph FOCES
(cf. Pfeiffer et al. 1998) at the 2.2 m telescope of
Calar Alto Observatory.
The spectrograph was coupled to the telescope with the
red fibre. The detector was a 1024 1024 pixel Tektronix
CCD chip with 24 m pixel size. With a diaphragm diameter of
200 m and an entrance slit width of 180 m a spectral resolution of
34000 was achieved. Wavelength calibration was obtained with a ThAr lamp.
1024 pixel Tektronix
CCD chip with 24 m pixel size. With a diaphragm diameter of
200 m and an entrance slit width of 180 m a spectral resolution of
34000 was achieved. Wavelength calibration was obtained with a ThAr lamp.
The spectra were reduced with the standard routines of the ESO-MIDAS software
package (contexts longslit for the AURELIE spectra and echelle
for the FOCES data).
3 Radial velocities
The radial velocity of the late-type component
was determined from the spectra by means of a
cross-correlation technique, i.e. by measuring the shifts of the spectra
relative to radial velocity
standard stars. For this purpose first the mean continuum was subtracted
from the normalized
spectra. Then the spectra were rebinned on a
logarithmic wavelength scale. The relative shift was finally measured by
cross-correlation. The standard stars used had been observed
with AURELIE during the run in October 1998. The selected stars were HD212943 (K0,
 kms-1), HD186791 (K3,
 kms-1), and HD204867
(G0,
kms-1), and HD204867
(G0,
 kms-1) (Duflot et al. 1995).
In order to obtain consistent measurements of the radial velocities
also for the spectra of 1986-88 discussed in Paper I, the same procedure was
applied also to these data and the radial velocities were redetermined with the
same set of standard star spectra.
kms-1) (Duflot et al. 1995).
In order to obtain consistent measurements of the radial velocities
also for the spectra of 1986-88 discussed in Paper I, the same procedure was
applied also to these data and the radial velocities were redetermined with the
same set of standard star spectra.
The section of the spectra used for the measurement was 6600-6730 Å. This region
is completely dominated by the lines of the late-type component and is
free of emission lines.
For the spectrum of 1987 a smaller interval of 6660-6710 Å had to
be used due the smaller wavelength interval covered by the spectrogram
of this observing run (cf. Paper I).
Measurement errors were estimated from the scatter of
the results for the three standard stars and from the scatter of the individual
spectra available for each observing campaign (2-3 spectra per observing run).
Note, that only minor differences in the redetermined
velocities were found relative to the results given in Paper I.
The velocities of the He I absorption lines (and of the emission lines, see below) were
determined by measuring directly the wavelengths instead of using the
cross-correlation method.
In Table 1 the resulting heliocentric radial velocities are
listed. The velocities measured from absorption lines of Fe I, Li I, and
Ca I are summarized as "K star abs.''.
Within the errors of the measurements no significant
radial velocity variations of the absorption lines of the K star
could be detected between 1986 and 2000. This also holds for the He I lines
attributed to the B star component.
In Fig. 1 the heliocentric radial velocities of the
K star are plotted for the different observational epochs.
The mean velocity of the K star calculated from the five measurements is
 kms-1. The
standard deviation of the mean velocity is of the
same order as the individual errors of the measurements.
kms-1. The
standard deviation of the mean velocity is of the
same order as the individual errors of the measurements.
![\begin{figure}
\par\includegraphics[angle=-90,width=8cm,clip]{h2802f1.eps}\end{figure}](/articles/aa/full/2001/31/aah2802/Timg43.gif) |
Figure 1:
Heliocentric radial velocity of the K component.
The interval of
 kms-1 is marked by the upper and lower dashed lines. kms-1 is marked by the upper and lower dashed lines. |
| Open with DEXTER |
The radial velocities of the emission lines are also summarized in Table 1 including the
results from Paper I.
In constrast to the absorption lines the emission features exhibit some variability.
[O I] shows some variation on the order of 6 kms-1. In 2000
the lines of Fe II and [Fe II] had a slightly more negative velocity than in the 1980s.
The mean difference is  -6 kms-1. Likewise, the Balmer lines in 1998 and 2000
exhibit a more negative velocity by the same amount as the singly ionized iron lines.
The variable velocities of the Balmer lines
could be related to line profile variations discussed in the next section.
-6 kms-1. Likewise, the Balmer lines in 1998 and 2000
exhibit a more negative velocity by the same amount as the singly ionized iron lines.
The variable velocities of the Balmer lines
could be related to line profile variations discussed in the next section.
4 Spectroscopic variability
The emission line of H is clearly variable. This is shown in Fig.
2. In the
recent spectra the line is a factor two weaker than in the late 1980s. Also small
changes in the line profile are discernible, in particular in the blue wing which
showed a more pronounced dip in the 1998 and 2000 spectra. The spectrum of 1998
additionally shows a dip also on the red wing (weakest line in Fig. 2).
is clearly variable. This is shown in Fig.
2. In the
recent spectra the line is a factor two weaker than in the late 1980s. Also small
changes in the line profile are discernible, in particular in the blue wing which
showed a more pronounced dip in the 1998 and 2000 spectra. The spectrum of 1998
additionally shows a dip also on the red wing (weakest line in Fig. 2).
![\begin{figure}
\par\includegraphics[angle=-90,width=8.5cm,clip]{h2802f2.eps}\end{figure}](/articles/aa/full/2001/31/aah2802/Timg45.gif) |
Figure 2:
Line profile variations of H.
During 1986-1988 the emission line
was nearly twice a strong as in 1998 and 2000. |
| Open with DEXTER |
![\begin{figure}
\par\includegraphics[angle=-90,width=8.13cm,clip]{h2802f3.eps}\end{figure}](/articles/aa/full/2001/31/aah2802/Timg46.gif) |
Figure 3:
Comparison of the lines Fe II and [Fe II] in 1986 and 2000. No significant variation
of the line strengths is discernible. |
| Open with DEXTER |
The emission lines of Fe II and [Fe II], however, do not exhibit this
variability pattern.
Rather, these lines seem to be constant in intensity, at least for the two epochs of
1986 and 2000 (only these two observations of the blue spectral region are
available). This is depicted in Fig. 3. Note, that the spectrum of 2000 has been rebinned to the same
resolution as that of 1986 for this comparison.
Table 2:
Equivalent widths W of absorption lines around 6710 Å
(given in mÅ). The error of the individual measurements is of the order
of 10 mÅ.
The last column gives the sum of the equivalent width of the three Fe I lines
listed. Its error is about 20 mÅ.
|
date |
Li I |
Ca I |
Fe I |
Fe I |
Fe I |
 Fe I
Fe I |
| |
6708 |
6719 |
6703 |
6705 |
6710 |
|
|
1986 |
192 |
123 |
68 |
60 |
95 |
223 |
| 1987 |
200 |
140 |
74 |
36 |
100 |
210 |
| 1988 |
298 |
142 |
67 |
62 |
88 |
217 |
| 1998 |
135 |
91 |
61 |
20 |
44 |
125 |
| 2000 |
200 |
137 |
81 |
53 |
82 |
216 |
In Fig. 4 a section of the spectrum of MWC623 around the line
of Li I
 Å are shown for the five epochs of observation.
Obviously, the strengths of the K star absorption features are variable to some
extent. The measured equivalent
widths W of some characteristic lines of Fe I, of Li I, and of Ca I are listed
in Table 2. In addition, the sum of the three Fe I lines is listed, which
has a smaller relative error than the individual lines.
Å are shown for the five epochs of observation.
Obviously, the strengths of the K star absorption features are variable to some
extent. The measured equivalent
widths W of some characteristic lines of Fe I, of Li I, and of Ca I are listed
in Table 2. In addition, the sum of the three Fe I lines is listed, which
has a smaller relative error than the individual lines.
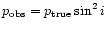
Comparing the measured equivalent width in the different years which are
plotted in Fig. 5 one realizes a
significant weakening of the strength of all lines in 1998 while in the other years
the line strengths are similar except the line of Li I which
shows a significant maximum in 1988.
The comparison of the relative line
strength, i.e. W(Li I)/W(Ca I), W(Li I)/W( Fe I), and
W(Ca I)/  Fe I), however, does not reveal the drop in 1998.
This is depicted in Fig. 6. Rather,
the line ratios are constant within the errors. However,
the Li I line again deviates significantly in 1988 in the sense of being stronger
than in the other years.
An explanation for the variation of the measured equivalent widths
in 1998 could be a varying relative brightness of the B and the K star. This
would change the relative continuum level and consequently the equivalent widths of
intrinsically constant lines. The weakening of the K star absorption lines in
1998 would thus correspond either to a fading of the K star or to a brightening
of the B star. Bergner et al. (1995) published UBVRIJHK photometry for
MWC623 obtained in 1989-1994.
Their mean V magnitude was
Fe I), however, does not reveal the drop in 1998.
This is depicted in Fig. 6. Rather,
the line ratios are constant within the errors. However,
the Li I line again deviates significantly in 1988 in the sense of being stronger
than in the other years.
An explanation for the variation of the measured equivalent widths
in 1998 could be a varying relative brightness of the B and the K star. This
would change the relative continuum level and consequently the equivalent widths of
intrinsically constant lines. The weakening of the K star absorption lines in
1998 would thus correspond either to a fading of the K star or to a brightening
of the B star. Bergner et al. (1995) published UBVRIJHK photometry for
MWC623 obtained in 1989-1994.
Their mean V magnitude was
 as compared to
10.5 measured by Allen & Swings (1976). This shows that MWC623 which is also
known as V2028Cyg is photometrically variable at least on a 0.3-0.4 magnitude level
in V. The mean B-V colour of
Bergner et al. is
as compared to
10.5 measured by Allen & Swings (1976). This shows that MWC623 which is also
known as V2028Cyg is photometrically variable at least on a 0.3-0.4 magnitude level
in V. The mean B-V colour of
Bergner et al. is
 which is similar to +1.3 given by Swings
(1981). Unfortunately, the photometry available so far does not allow to
decide which of the components is variable although there might be some weak indication
that the object appears bluer when it is weaker. This would suggest that
the K star became fainter.
which is similar to +1.3 given by Swings
(1981). Unfortunately, the photometry available so far does not allow to
decide which of the components is variable although there might be some weak indication
that the object appears bluer when it is weaker. This would suggest that
the K star became fainter.
The behaviour of the Li I line remains puzzling. Whereas the
ratio of Ca I and Fe I is constant suggesting that no change of the effective
temperature of the K star has occured, the observation of 1988 seems to indicate a
real increase of the Li I equivalent width although no explanation for such a
behaviour can be give at this time.
Certainly, further monitoring of the spectrum is necessary in order to investigate
this phenomenon in more detail.
![\begin{figure}
\par\includegraphics[width=8.63cm,clip]{h2802f4r.eps}\end{figure}](/articles/aa/full/2001/31/aah2802/Timg51.gif) |
Figure 4:
Sections of the spectrum around the absorption of
Li I
Å. The dashed line mark the positions of
Li I
Å and Ca I
 Å. Å. |
| Open with DEXTER |
![\begin{figure}
\par\includegraphics[angle=-90,width=8.58cm,clip]{h2802f5.eps}\end{figure}](/articles/aa/full/2001/31/aah2802/Timg52.gif) |
Figure 5:
Variations of the equivalent widths of Li I, Ca I, and the sum of the
three Fe I lines listed in Table 2. Note the weaker lines in 1998. |
| Open with DEXTER |
![\begin{figure}
\par\includegraphics[angle=-90,width=8.1cm,clip]{h2802f6.eps}\end{figure}](/articles/aa/full/2001/31/aah2802/Timg53.gif) |
Figure 6:
Ratio of the equivalent widths listed in Table 2.
Whereas the ratio of Ca I and Fe I is constant, even in 1998, a significant variation of
the Li I line is discernible in 1988 relative to both,
Ca I and Fe I. |
| Open with DEXTER |
5 Discussion
5.1 Distance towards MWC623 and stellar parameters
As discussed in Paper I the continuum energy
distribution can be well fitted with the superposition of the energy flux
distribution of a B star, a K star, and a black body with
 K, assuming a reddening of
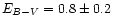 .
The spectral types
adopted for the fit were B2V and K2III. The relative brightness of the components
lead to dereddened V magnitudes of V0 = 8.6 and 9 for the K and the B star,
respectively. The uncertainty of V0 due to EB-V is of the order of 0.6 mag.
.
The spectral types
adopted for the fit were B2V and K2III. The relative brightness of the components
lead to dereddened V magnitudes of V0 = 8.6 and 9 for the K and the B star,
respectively. The uncertainty of V0 due to EB-V is of the order of 0.6 mag.
In the following a new estimate of the spectral types of the components is obtained
by making use of the wider spectral coverage provided by the FOCES echelle spectrum
compared to the short spectral sections observed with the coudé spectrograph in
1986-1988.
![\begin{figure}
\par\includegraphics[angle=-90,width=8.7cm,clip]{h2802f7a.eps}\\ [1.2mm]
\includegraphics[angle=-90,width=8.7cm,clip]{h2802f7b.eps}\end{figure}](/articles/aa/full/2001/31/aah2802/Timg56.gif) |
Figure 7:
Spectrum of MWC623 together with spectra of stars with spectral types
between K0Iab and K5Ib (upper panel) and between K2III and K2Ib (lower panel).
The H
emission line of MWC623 has been removed by
normalization. The comparison shows good agreement of the K component of
MWC623 with the K2II and K2Ib star. A spectral type of K2II-Ib is therefore
adopted for MWC623. The K star spectra were obtained from the HYPERCAT data base of
Prugniel & Soubiran (2001). |
| Open with DEXTER |
The late-type component of MWC623 was re-classified by comparison with
high resolution
spectra of late G to K stars retrieved from the stellar library
of Prugniel & Soubiran (2001). This library is part of the
HYPERCAT![[*]](/icons/foot_motif.gif) data base.
Note that the resolution of the spectra in HYPERCAT is similar to that
of the FOCES spectra.
data base.
Note that the resolution of the spectra in HYPERCAT is similar to that
of the FOCES spectra.
The comparison with stars of spectral types between G8 and K5
and of luminosity classes V to I yields the best agreement for spectral type K2II-Ib,
which will be adopted in the following. The uncertainty of the spectral type
is about 1-2 subclasses.
Luminosity class V can be definitely excluded. Likewise, luminosity class III yields a
significantly poorer agreement than the higher luminosity spectra.
Figure 7 depicts the comparison of the late
component of MWC623 with various K stars and with
K2 stars of luminosity class III, II, and Ib
(HD5234, HD39400, and HD206778, respectively).
Likewise, the reclassification of the early-type component
of MWC623 was aided by the comparison with B type
spectra from the stellar library of Prugniel & Soubiran.
The classification of the late component suggests a luminosity class III for the
hot component (see below).
A section around He I4388 and He I4471 of the spectra
is shown in Fig. 8. The spectral type of the B component can be confined
between B2 and B6 from the relative strengths of the He I lines,
by taking into account that the lines of Si III
 4553, 4568, 4575
are absent,
and from the ratio of the very weak absorption feature at
4553, 4568, 4575
are absent,
and from the ratio of the very weak absorption feature at
 and of CII
 .
In the following a spectral type of B4 will be adopted
with an uncertainty of 2 subclasses. This is somewhat later than adopted in Paper I,
however, with only weak effects on the continuum fit as carried out in Paper I.
In particular, the intrinsic colours are not much different and therefore the
conclusions on the relative fluxes of the components and the dereddened magnitudes
from Paper I are adopted also here in the following.
.
In the following a spectral type of B4 will be adopted
with an uncertainty of 2 subclasses. This is somewhat later than adopted in Paper I,
however, with only weak effects on the continuum fit as carried out in Paper I.
In particular, the intrinsic colours are not much different and therefore the
conclusions on the relative fluxes of the components and the dereddened magnitudes
from Paper I are adopted also here in the following.
To summarize the result of the
spectral classification it can be stated that the spectral
types of the two components are K2II-Ib and B4.
![\begin{figure}
\par\includegraphics[angle=-90,width=8.74cm,clip]{h2802f8.eps}\end{figure}](/articles/aa/full/2001/31/aah2802/Timg60.gif) |
Figure 8:
Spectrum of MWC623 together with spectra of stars with spectral types
between B2 and B6.
Note, that in MWC623 Mg II4481 is in emission.
The B star spectra were obtained from the stellar library of
Prugniel & Soubiran (2001). |
| Open with DEXTER |
As discussed in Paper I the projected position of MWC623 in the plane of sky
at
 and
and
 lies between the Vul OB1, OB4 (
 )
and the Cyg OB3A, B and OB1
associations (
)
and the Cyg OB3A, B and OB1
associations (
 and 76
 ,
respectively). The
distances of these associations are d = 1.21, 2.54, 1.37, 1.82, and 2.31 kpc
respectively. The association data were taken from
Melnik & Efremov (1995) who in addition to the location also
give the approximate extension of the asso- ciations. In Fig. 9
the position of MWC623 in galactic coordinates
and the associations located in the immediate (projected) neighborhood are plotted.
MWC623 obviously is too far
from each of these associations to be considered as a member of one of them.
Rather, MWC623 seems to be located somewhere in the field. Melnik & Efremov also
give radial velocities for some associations, e.g. for Cyg OB3A, B, and OB1
-9, -17, and -6.5 kms-1, respectively, however, with considerable scatter of
7-10 kms-1 rendering a comparison with MWC623 meaningless.
,
respectively). The
distances of these associations are d = 1.21, 2.54, 1.37, 1.82, and 2.31 kpc
respectively. The association data were taken from
Melnik & Efremov (1995) who in addition to the location also
give the approximate extension of the asso- ciations. In Fig. 9
the position of MWC623 in galactic coordinates
and the associations located in the immediate (projected) neighborhood are plotted.
MWC623 obviously is too far
from each of these associations to be considered as a member of one of them.
Rather, MWC623 seems to be located somewhere in the field. Melnik & Efremov also
give radial velocities for some associations, e.g. for Cyg OB3A, B, and OB1
-9, -17, and -6.5 kms-1, respectively, however, with considerable scatter of
7-10 kms-1 rendering a comparison with MWC623 meaningless.
An independent estimate for the distance may be obtained from the galactic
rotation curve if it is assumed that the star is comoving with the field at its
given location in the Milky Way.
![\begin{figure}
\par\includegraphics[angle=-90,width=8.8cm,clip]{h2802f9r.eps}\end{figure}](/articles/aa/full/2001/31/aah2802/Timg66.gif) |
Figure 9:
Position of MWC623 in the sky ( symbol) in galactic
coordinates and the locations of the (projected)
nearby associations Vul OB4, OB1, Cyg OB3A, B, and Cyg OB1.
symbol) in galactic
coordinates and the locations of the (projected)
nearby associations Vul OB4, OB1, Cyg OB3A, B, and Cyg OB1. |
| Open with DEXTER |
With a second order expansion of the galactic rotation curve the velocity
of MWC623 in the local standard of rest (LSR)
frame,
 ,
is given by
,
is given by
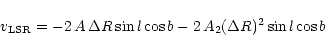 |
(1) |
where
 |
(2) |
and
 ,
with R and R0=8.5 kpc being the
galacto-centric distances of the star and the sun, repectively, l and b the
galactic longitudes and latitude, respectively, and the constants
A=16.1 kms-1kpc-1 and
A2=-0.7 kms-1kpc-2 (cf. Dubath et al. 1988). The solar
motion is given by
,
with R and R0=8.5 kpc being the
galacto-centric distances of the star and the sun, repectively, l and b the
galactic longitudes and latitude, respectively, and the constants
A=16.1 kms-1kpc-1 and
A2=-0.7 kms-1kpc-2 (cf. Dubath et al. 1988). The solar
motion is given by
 |
|
|
(3) |
where
and  are the right ascension and declination of
the star, and
are the right ascension and declination of
the star, and
 and
and
 are the standard solar apex (Lang 1980).
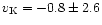
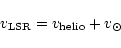
The systemic velocity of MWC623 should, of course, be derived from
the velocity of the centre-of-gravity of the binary system. However, the orbital
parameters of the system are still unknown. Therefore, as an
estimate for the centre-of-mass velocity the mean of the velocities of the
photospheric lines of the B and the K
star in 1986 and 2000 was used, i.e.
 kms-1. Note that the
mass estimates obtained below yielding a mass ratio of close to 1
justifies this approximation.
In this way
kms-1. Note that the
mass estimates obtained below yielding a mass ratio of close to 1
justifies this approximation.
In this way
 kms-1 with
 kms-1, and
 kpc is obtained from Eq. (1). At the given galactic longitude two
solutions for the distance exist,
d1 = 2.0+0.6-0.3 kpc and
d2 = 4.4+0.4-0.5 kpc.
The uncertainties given here result from the statistical error of the
adopted radial velocity of 2 kms-1 only. No systematic errors like peculiar
velocity were taken into account. The distances correspond to distance
moduli of
m-M = 11.5+0.5-0.4, and
m-M = 13.2+0.2-0.3,
respectively. Note that both distances are consistent with the extinction
kpc is obtained from Eq. (1). At the given galactic longitude two
solutions for the distance exist,
d1 = 2.0+0.6-0.3 kpc and
d2 = 4.4+0.4-0.5 kpc.
The uncertainties given here result from the statistical error of the
adopted radial velocity of 2 kms-1 only. No systematic errors like peculiar
velocity were taken into account. The distances correspond to distance
moduli of
m-M = 11.5+0.5-0.4, and
m-M = 13.2+0.2-0.3,
respectively. Note that both distances are consistent with the extinction
 which in the direction towards MC623 occurs at distances
larger than 2-3 kpc (Neckel & Klare 1980).
which in the direction towards MC623 occurs at distances
larger than 2-3 kpc (Neckel & Klare 1980).
The spectral classification of the late component yielded a
spectral type of K2II-Ib which leads to an absolute visual magnitude of
 (Schmidt-Kaler 1982). With
the dereddened V magnitude derived in Paper I of V0 = 8.6 this yields
(Schmidt-Kaler 1982). With
the dereddened V magnitude derived in Paper I of V0 = 8.6 this yields
 or
d = 2.4+1.4-0.9 kpc. Note the good agreement with the short
kinematic distance d1.
The long kinematic distance of 4.4 kpc corresponds to
MV = -4.6+0.2-0.3
for the K star which would still
marginally be consistent with the spectroscopic distance, although the overall
agreement of spectroscopic and kinematic distance is better for the short distance.
Therefore in the following the spectroscopic distance of 2.4 kpc is adopted.
The dereddened visual brightness of the early-type component of V0 = 9 then
leads to luminosity class III for the B star, i.e. a spectral type B4III. The
stellar parameters of the components of MWC623 derived for d = 2.4 kpc
are summarized in Table 3.
Bolometric corrections were taken from Schmidt-Kaler (1982).
or
d = 2.4+1.4-0.9 kpc. Note the good agreement with the short
kinematic distance d1.
The long kinematic distance of 4.4 kpc corresponds to
MV = -4.6+0.2-0.3
for the K star which would still
marginally be consistent with the spectroscopic distance, although the overall
agreement of spectroscopic and kinematic distance is better for the short distance.
Therefore in the following the spectroscopic distance of 2.4 kpc is adopted.
The dereddened visual brightness of the early-type component of V0 = 9 then
leads to luminosity class III for the B star, i.e. a spectral type B4III. The
stellar parameters of the components of MWC623 derived for d = 2.4 kpc
are summarized in Table 3.
Bolometric corrections were taken from Schmidt-Kaler (1982).
In Fig. 10 the location of the components of MWC623 on the H-R
diagram are shown. Evolutionary tracks were taken
from Schaller et al. (1992) for metallicity Z = 0.020.
The masses estimated from the tracks are 6-9
 and 5-10
for the B and the K star, respectively
(see Table 3). The resulting mass ratio is
and 5-10
for the B and the K star, respectively
(see Table 3). The resulting mass ratio is
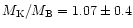 .
.
![\begin{figure}
\par\includegraphics[angle=-90,width=8.75cm,clip]{h2802f10.eps}\end{figure}](/articles/aa/full/2001/31/aah2802/Timg97.gif) |
Figure 10:
H-R diagram showing the locations of the B
and the K component of MWC623.
Evolutionary tracks are from Schaller et al.
(1992) for metallicity Z = 0.020. ZAMS masses are indicated for
each track. The dashed line represents the stellar birth line from Palla & Stahler
(1993). |
| Open with DEXTER |
![\begin{figure}
\par\includegraphics[angle=-90,width=8.69cm,clip]{h2802f11.eps}\end{figure}](/articles/aa/full/2001/31/aah2802/Timg98.gif) |
Figure 11:
Isochrones
from Bertelli et al. (1994) for metallicity
Z = 0.020 with the positions of the B
and the K component of MWC623. Ages are indicated for each track. |
| Open with DEXTER |
A possible model for MWC623 could involve interaction in a close binary system.
However, this
was already rejected in Paper I based on observations covering about 2 years.
The absence of significant radial velocity variations of the photospheric absorption
lines of the B and the K star on an even longer timescale
of 14 years as discussed in Sect. 3 indicates that the orbital period
is actually on the order of longer than 14 years unless the small radial velocity
variation is due to a low
inclination angle. This seems, however, to be inconsistent with
the observed polarization. Rather, the inclination angle
is expected to be intermediate to large.
If the assumption is made that the scattering plane responsible for the observed
polarization is correlated with the orbital plane of the binary, the presence of strong
intrinsic polarization suggests that the inclination angle i deviates significantly
from pole-on. Because the polarization is proportional to  the
inclination should be intermediate to large, i.e. i should be
of the order of
the
inclination should be intermediate to large, i.e. i should be
of the order of
 30-45.
Otherwise, the observed degree of
intrinsic polarization,
30-45.
Otherwise, the observed degree of
intrinsic polarization,
 of about
2% (Zickgraf & Schulte-Ladbeck 1989) would lead to unreasonably high true
polarization
of about
2% (Zickgraf & Schulte-Ladbeck 1989) would lead to unreasonably high true
polarization
 .
.
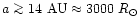
Assuming a minimum separation of the components on the order of the radius of the
K star, i.e. 100
 ,
the masses determined above would lead to a period of
30 days from
,
the masses determined above would lead to a period of
30 days from
 |
(4) |
with the separation a (in AU) and the total mass
M = M1+M2 (in
)
of the system. In this case the velocity amplitude would be of the order of 80 kms-1.
This is inconsistent with the observations because even within a few days of observation
as in 1988 (cf. Paper I) significant velocity variations should have been detectable.
On the other hand, the small observed velocity variation
 kms-1 over a time
interval of 14 years
suggests that the orbital period P is longer than 14 years.
This leads to
kms-1 over a time
interval of 14 years
suggests that the orbital period P is longer than 14 years.
This leads to
 .
The velocity amplitude would then be
of the order of
.
The velocity amplitude would then be
of the order of
 15 kms-1. Taking
  into account expected velocity variations
are thus on the order of at most a few kms-1, which is consistent with the observations.
into account expected velocity variations
are thus on the order of at most a few kms-1, which is consistent with the observations.
The linear separation of the components of 14 AU corresponds to an angular separation of
5 mas. By taking into account the different colours of the components a positional shift should be
directly measurable with the forthcoming astrometric space missions DIVA and GAIA by
comparing observations in different colours.
These estimates suggest that MWC623 is a wide binary system.
In this case each component evolved like a single
star. From the evolutionary timescales
for single stars it is expected that the B star is less massive
than the K star which then would evolve faster. This is in agreement with the
mass estimates given above.
Figure 11 shows the H-R diagram with isochrones from Bertelli et al. (1994) for metallicity
Z = 0.020. The positions of the B and K component
confirm that both are coeval within the error bars. Both
stars lie on the 50 Myr isochrone
within an uncertainty range from 30 to 125 Myr for the K star and
30 to 60 Myr for the B star. The B component thus constraints the age
to
50+10-20 Myr.
These findings shed new light on the question of origin of the strong lithium line
in MWC623 which, in principle, could indicate a pre-main sequence status for the K
star. However, the spectroscopic characteristics exclude a low-luminosity K star and
lead instead to a luminosity which is more than 2 orders of magnitudes above the stellar
birth line (cf. Palla & Stahler 1993) which for
 K
is located at
K
is located at
 .
The K star is therefore clearly in a
post-main sequence evolutionary phase.
.
The K star is therefore clearly in a
post-main sequence evolutionary phase.
The estimated age of 50 Myr is younger than that of the Pleiades
(80-100 Myr). The lithium abundance of the
late-type stars in this cluster is still high due to the young age.
The high lithium abundance of the late component of MWC623 can therefore quite
naturally be explained by the age in the sense that
the primordial lithium is not yet destroyed.
The B[e] star in MWC623 is located slightly off but still close to the main
sequence and could thus be related to the class of (near) main-sequence B[e]-type
stars discussed by Lamers et al. (1998) and Zickgraf
(1998) for which HD45677 and HD50138 are examples.
For this type of B[e] star it is unclear whether they are still in a pre-main
sequence phase of evolution
or if they are already in the core-hydrogen burning phase. The first possiblity
would place them on contraction tracks of Herbig
Ae/Be stars towards the main-sequence instead of post-ZAMS evolutionary tracks.
For MWC623 is was possible for the first time to obtain a reliable age estimate.
It clearly excludes the pre-main sequence option at least for
this object. Note also that both components of MWC623 are located above the
stellar birth line (cf. Fig. 10). This is also inconstent with a
pre-main sequence status. The conclusion is that the B[e] component in MWC623 is
a slightly evolved object starting its post-main sequence evolution. The similarities
with the mentioned (near) main-sequence B[e]-type stars
suggest that this conclusion might also hold for the latter class.
The B[e] component in MWC623 might even belong to
the subgroup of post-main sequence B[e] stars discovered in the Magellanic
Clouds at luminosities
 (Gummersbach et al.
1995). These objects are located in the H-R diagram
below the luminous B[e] supergiants
described by Zickgraf et al. (1986) and extend the class of
B[e] supergiants towards lower luminosities into the range of classical Be stars.
(Gummersbach et al.
1995). These objects are located in the H-R diagram
below the luminous B[e] supergiants
described by Zickgraf et al. (1986) and extend the class of
B[e] supergiants towards lower luminosities into the range of classical Be stars.
6 Conclusions
New spectroscopic observations were used to reinvestigate the B[e]/K binary system MWC623. Neither
the K nor the B star absorption lines were found to exhibit significant radial velocity variations
over a time interval of 14 years suggesting that the orbital period is longer than 14 years.
The spectral classification using a recent echelle spectrum yielded spectral types of
K2II-Ib and B4III. The luminosity class of the K star was used to estimate the distance
towards MWC623 to 2.4 kpc which is consistent with the kinematic distance of 2.0 kpc.
Placing the binary components in the H-R diagram allows to derive masses of 7 and 7.5
for the B and K star,
respectively, yielding a mass ratio close to 1.
Both stars are coeval with an age of 50 Myr as shown by the comparison with isochrones.
The high luminosity of the K star excludes a pre-main sequence evolutionary phase as explanation for the
strong Li I6708 absorption line. Rather, the high lithium abundance is a consequence of the young
age. Likewise, a pre-main sequence Herbig Ae/Be phase of the B[e] star can be excluded.
Instead it is a slightly evolved post-main sequence object.
In order to determine the orbital parameters of MWC623 and to investigate in more
detail the variablility indicated by the presently available observations it is
clearly desirable to monitor this object spectroscopically and photometrically also
in the future.
Acknowledgements
This work made extensive use of the
stellar library of high-resolution spectra by C. Soubiran and P. Prugniel
available in the HYPERCAT data base via the World Wide Web.
-
Allen, D. A., & Swings, J. P. 1976, A&A, 47, 293
In the text
NASA ADS
-
Bergner, Yu. K., Miroshnichenko, A. S., Yudin, R. V., et al. 1995, A&AS, 112, 221
In the text
NASA ADS
-
Bertelli, G., Bressan, A., Chiosi, C., Fagotto, F., & Nasi, E. 1994, A&AS, 106, 275
In the text
NASA ADS
-
Dubath, P., Mayor, M., & Burki, G. 1988, A&A, 205, 77
In the text
NASA ADS
-
Duflot, M., Figon, P., & Meyssonnier, N. 1995, A&AS, 114, 269
In the text
NASA ADS
-
Gillet, D., Burnage, R., & Kohler, D. 1994, A&AS, 108, 181
In the text
NASA ADS
-
Gummersbach, C. A., Zickgraf, F.-J., & Wolf, B. 1995, A&A, 302, 409
In the text
NASA ADS
-
Lamers, H. J. G. L. M., Zickgraf, F.-J., de Winter, D., Houziaux, L., & Zorec, J.
1998, A&A, 340, 117
In the text
NASA ADS
-
Lang, K. R. 1980, Astrophysical Formulae (Springer Verlag, Berlin,
Heidelberg, New York)
In the text
-
Melnik, A. M., & Efremov, Yu. N. 1995, Pis'ma Astron. Zh., 21, 13
In the text
-
Neckel, Th., & Klare, G. 1980, A&AS, 42, 251
In the text
NASA ADS
-
Palla, F., & Stahler, S. W. 1993, ApJ, 418, 414
In the text
NASA ADS
-
Pfeiffer, M. J., Frank, C., Baumüller, D., Fuhrmann, K., & Gehren, T. 1998, A&AS,
130, 381
In the text
NASA ADS
-
Prugniel, Ph., & Soubiran, C. 2001, A&A, 369, 1048
In the text
NASA ADS
-
Schaller, G., Schaerer, D., Meynet, G., & Maeder, A. 1992, A&AS, 96, 269
In the text
NASA ADS
-
Schmidt-Kaler, Th. 1982, in Landolt Börnstein, New Series, Group IV,
vol. 2b, ed. K. Schaifers, & H. H. Voigt (Springer, Berlin, Heidelberg, New York)
In the text
-
Swings, J. P. 1981, A&AS, 43, 331
In the text
NASA ADS
-
Zickgraf, F.-J. 1998, in Dusty B[e] stars, ed. A. M. Hubert, & C.
Jaschek (Kluwer Academic Publishers), 1
In the text
-
Zickgraf, F.-J., & Schulte-Ladbeck, R. E. 1989, A&A, 214, 274
In the text
NASA ADS
-
Zickgraf, F.-J., & Stahl, O. 1989, A&A, 223, 165 (Paper I)
In the text
NASA ADS
-
Zickgraf, F.-J., Wolf, B., Stahl, O., Leitherer, C., & Klare, G. 1985, A&A, 143,
421
In the text
NASA ADS
-
Zickgraf, F.-J., Wolf, B., Stahl, O., Leitherer, C., & Appenzeller, I. 1986,
A&A, 163, 119
In the text
NASA ADS
Copyright ESO 2001
![\begin{figure}
\par\includegraphics[angle=-90,width=8cm,clip]{h2802f1.eps}\end{figure}](/articles/aa/full/2001/31/aah2802/img43.gif)
![\begin{figure}
\par\includegraphics[angle=-90,width=8.5cm,clip]{h2802f2.eps}\end{figure}](/articles/aa/full/2001/31/aah2802/img45.gif)
![\begin{figure}
\par\includegraphics[angle=-90,width=8.13cm,clip]{h2802f3.eps}\end{figure}](/articles/aa/full/2001/31/aah2802/img46.gif)
![\begin{figure}
\par\includegraphics[width=8.63cm,clip]{h2802f4r.eps}\end{figure}](/articles/aa/full/2001/31/aah2802/img51.gif)
![\begin{figure}
\par\includegraphics[angle=-90,width=8.58cm,clip]{h2802f5.eps}\end{figure}](/articles/aa/full/2001/31/aah2802/img52.gif)
![\begin{figure}
\par\includegraphics[angle=-90,width=8.1cm,clip]{h2802f6.eps}\end{figure}](/articles/aa/full/2001/31/aah2802/img53.gif)
![\begin{figure}
\par\includegraphics[angle=-90,width=8.7cm,clip]{h2802f7a.eps}\\ [1.2mm]
\includegraphics[angle=-90,width=8.7cm,clip]{h2802f7b.eps}\end{figure}](/articles/aa/full/2001/31/aah2802/img56.gif)
![\begin{figure}
\par\includegraphics[angle=-90,width=8.74cm,clip]{h2802f8.eps}\end{figure}](/articles/aa/full/2001/31/aah2802/img60.gif)
![\begin{figure}
\par\includegraphics[angle=-90,width=8.8cm,clip]{h2802f9r.eps}\end{figure}](/articles/aa/full/2001/31/aah2802/img66.gif)
![\begin{figure}
\par\includegraphics[angle=-90,width=8.75cm,clip]{h2802f10.eps}\end{figure}](/articles/aa/full/2001/31/aah2802/img97.gif)
![\begin{figure}
\par\includegraphics[angle=-90,width=8.69cm,clip]{h2802f11.eps}\end{figure}](/articles/aa/full/2001/31/aah2802/img98.gif)