A&A 375, 100-112 (2001)
DOI: 10.1051/0004-6361:20010823
G. Marino 1 - S. Catalano 2 - A. Frasca 2 - E. Marilli 2
1 - Telescopio Nazionale Galileo, Calle Alvarez de Abreu 70, 38700 Santa Cruz
de La Palma (TF), Canary Island, Spain
2 - Osservatorio Astrofisico di Catania,
via S. Sofia 78, 95123 Catania, Italy
Received 7 February 2001 / Accepted 28 May 2001
Abstract
HR 7428 is a spectroscopic binary composed of a K2 II-III and a
main-sequence A2 star.
Thanks to a new set of radial velocity measurements from our and IUE spectroscopy
we have improved the orbital period determination and the spectroscopic elements
of both components.
Combining optical photometry and UV low dispersion IUE spectra we have determined
new stellar parameters through photospheric synthetic spectra using the NextGen models
by Hauschildt et al. (1999a, 1999b). The hot secondary component parameters
agree with those of a typical A2 V star while the radius of the primary cool star turns
out to be 40 ![]() ,
i.e. significantly smaller than a previous
estimate of 62
,
i.e. significantly smaller than a previous
estimate of 62 ![]() .
The position of the hot and cool component on the H-R diagram is
consistent with a normal evolution, without any mass exchange, of this binary system,
whose age is in the range 100-200 Myrs.
The system displays a filled-in H
.
The position of the hot and cool component on the H-R diagram is
consistent with a normal evolution, without any mass exchange, of this binary system,
whose age is in the range 100-200 Myrs.
The system displays a filled-in H![]() profile with
significant variations both in depth and width along the orbital phase.
In addition to the H
profile with
significant variations both in depth and width along the orbital phase.
In addition to the H![]() chromospheric emission component, we have detected,
at some phases, a broad extra-absorption and emission that we relate to
an inter-system cloud.
chromospheric emission component, we have detected,
at some phases, a broad extra-absorption and emission that we relate to
an inter-system cloud.
Key words: stars: activity - stars: binaries: spectroscopic - stars: individual: HR 7428
HR 7428 (=V 1817 Cygni) is a spectroscopic binary composed of a K2 II-III star
(Ginestet et al. 1999) and a main sequence A2 star (Parsons & Ake 1987).
Its long orbital period (![]() 108.6 days) has probably prevented systematic
spectroscopic observations in the last
decades.
So, before the present work, the only available
spectroscopic observations and orbital solution, for the primary cool component, have been
done by Sanford (1925).
Lucy & Sweeney (1971) revised that solution
and concluded that the eccentricity is not significantly different from zero.
108.6 days) has probably prevented systematic
spectroscopic observations in the last
decades.
So, before the present work, the only available
spectroscopic observations and orbital solution, for the primary cool component, have been
done by Sanford (1925).
Lucy & Sweeney (1971) revised that solution
and concluded that the eccentricity is not significantly different from zero.
Ca II H & K emission was first reported by Gratton (1950), while Bopp &
Talcott (1978)
observed the H![]() line in absorption. Xue-fu & Hui-song (1986a) detected
emission in both H
line in absorption. Xue-fu & Hui-song (1986a) detected
emission in both H![]() wings, but two later observations (Xue-fu & Hui-song
1986b) showed only variations in the H
wings, but two later observations (Xue-fu & Hui-song
1986b) showed only variations in the H![]() profile without any emission.
A single spectrum presented by Eker et al. (1995)
showed a filled-in H
profile without any emission.
A single spectrum presented by Eker et al. (1995)
showed a filled-in H![]() line. This observed behaviour indicates a large
variability, probably due to chromospheric activity.
line. This observed behaviour indicates a large
variability, probably due to chromospheric activity.
Barksdale et al. (1985) showed the system to be photometrically variable,
the dominant cause being ellipticity, with a possible small reflection effect.
Strassmeier et al. (1989) excluded reflection and estimated a starspot wave amplitude of
0.02 magnitudes from unequal heights of maxima and depths of minima in the light curve.
A determination of physical parameters was performed by Hall (1990) combining the
amplitude of the ellipticity effect, the mass function and the
![]() reported by Hui-song & Xue-fu (1987).
A more recent and precise measurement of the projected rotational velocity,
reported by Hui-song & Xue-fu (1987).
A more recent and precise measurement of the projected rotational velocity,
![]() 17.2
17.2![]() 1.0 km
1.0 km![]() s-1, has been provided by De Medeiros
& Mayor (1995).
s-1, has been provided by De Medeiros
& Mayor (1995).
Photometric observations between 1982 and 1989 were used by Hall et al. (1990a) for a detailed analysis of the photometric behaviour. After removing the modulation produced by the ellipticity effect, they were able to detect starspot signatures on the K-type primary star, as well as migration of spots. Gurzadyan (1997) included HR 7428 in his sample of binary stars for which he estimated the radii of the main components in the hypothesis of common chromospheres around binary systems.
In this work we present the results of our optical spectroscopy and determine new orbital and physical parameters. We estimate new temperatures and radii of both components comparing UBV magnitudes and low resolution IUE spectra with synthetic photospheric spectra. The Hipparcos photometry is also discussed, to constrain the ellipticity parameters.
Spectroscopic observations have been performed with the échelle spectrograph at the 91-cm telescope of Catania Astrophysical Observatory - M. G. Fracastoro station (Serra La Nave, Mt. Etna) - in 1997, 1998, and 1999.
The spectrograph is fed by the telescope through an optical fiber
(UV - NIR, ![]() m core diameter) and is placed in a stable position
in the room below the dome level. Spectra were recorded on a CCD camera equipped with a
front-illuminated CCD of
m core diameter) and is placed in a stable position
in the room below the dome level. Spectra were recorded on a CCD camera equipped with a
front-illuminated CCD of
![]() 1152 pixels (pixel size of
1152 pixels (pixel size of ![]() m) in
1997-98 and with a thinned back-illuminated SITe CCD of
m) in
1997-98 and with a thinned back-illuminated SITe CCD of
![]() 1024 pixels
(size
1024 pixels
(size
![]() m) in 1999. With the first detector we were able to record
four orders in each frame, spanning from about 6050 to 6650 Å, and to cover nearly
completely each échelle order. With the second one we could record five
échelle orders, starting from 5850 Å. The echelle cross-configuration yields a
resolution of about 14000, as deduced from the FWHM of the lines of the Th-Ar calibration lamp.
m) in 1999. With the first detector we were able to record
four orders in each frame, spanning from about 6050 to 6650 Å, and to cover nearly
completely each échelle order. With the second one we could record five
échelle orders, starting from 5850 Å. The echelle cross-configuration yields a
resolution of about 14000, as deduced from the FWHM of the lines of the Th-Ar calibration lamp.
The average signal-to-noise ratio (S/N) obtained at the continuum near the
H![]() line was about 150.
line was about 150.
The data reduction was performed by using the ECHELLE task of IRAF![]() package
following the standard steps: background subtraction,
division by a flat field spectrum given by a halogen lamp,
wavelength calibration using the emission lines of a Thorium-Argon lamp,
normalization through a polynomial fit to the continuum.
package
following the standard steps: background subtraction,
division by a flat field spectrum given by a halogen lamp,
wavelength calibration using the emission lines of a Thorium-Argon lamp,
normalization through a polynomial fit to the continuum.
Radial velocity determinations were made by cross-correlation of each order of
the HR 7428 spectra with spectra of the bright radial velocity standard
star ![]() Ari, whose radial velocity is -14.3 kms-1
(Evans 1979).
Ari, whose radial velocity is -14.3 kms-1
(Evans 1979).
Template spectra of ![]() Ari have been obtained during each
observing run.
From several spectra of
Ari have been obtained during each
observing run.
From several spectra of ![]() Ari and other RV standard stars
we have evaluated an
average accuracy for the radial velocity measurements better than
Ari and other RV standard stars
we have evaluated an
average accuracy for the radial velocity measurements better than ![]() 0.4 kms-1
rms which is the result of the stability
of the experimental apparatus and is consistent with the limits given by the spectral
resolution.
0.4 kms-1
rms which is the result of the stability
of the experimental apparatus and is consistent with the limits given by the spectral
resolution.
The wavelength ranges for the cross-correlation of HR 7428 spectra were selected
in order to exclude the H![]() and Na I D2 lines, which are contaminated
by chromospheric emission. The spectral
regions heavily affected by telluric lines (e.g. the
and Na I D2 lines, which are contaminated
by chromospheric emission. The spectral
regions heavily affected by telluric lines (e.g. the
![]() band of O2) were also excluded.
band of O2) were also excluded.
Each radial velocity value listed in Table 1 is the weighted mean of
the values obtained by the cross-correlation of each order of the target spectra
with the corresponding order of the closest-in-time spectrum of ![]() Ari.
The errors, listed in Table 1, have been computed as the square root of
the quadratic average of errors in the cross correlation of
each order. The latter are computed according to the fitted peak height and the
antisymmetric noise as described by Tonry & Davis (1979).
This error estimate is consistent with the dispersion of data points around the mean curve.
Ari.
The errors, listed in Table 1, have been computed as the square root of
the quadratic average of errors in the cross correlation of
each order. The latter are computed according to the fitted peak height and the
antisymmetric noise as described by Tonry & Davis (1979).
This error estimate is consistent with the dispersion of data points around the mean curve.
|
Phase | RV | error |
|
error |
|
error |
| - 2400000 | (km |
(Å) | (Å) | ||||
|
0.2724 | 17.9 | 1.0 | -1.463 | 0.108 | 0.112 | 0.119 |
| 50632.5635 | 0.2817 | 19.3 | 0.4 | -1.674 | 0.097 | -0.255 | 0.107 |
| 50633.5440 | 0.2907 | 18.3 | 1.0 | -1.686 | 0.181 | -0.228 | 0.200 |
| 50634.5728 | 0.3002 | 15.7 | 0.5 | -1.940 | 0.120 | -0.558 | 0.132 |
| 50635.5511 | 0.3092 | 16.0 | 1.4 | -- | -- | -- | -- |
| 50636.5153 | 0.3181 | 15.9 | 2.8 | -1.921 | 0.076 | -0.432 | 0.084 |
| 50678.4853 | 0.7046 | -29.8 | 0.7 | -0.656 | 0.102 | 0.757 | 0.112 |
| 50679.4757 | 0.7137 | -30.2 | 0.3 | -0.784 | 0.071 | 0.676 | 0.078 |
| 50680.4779 | 0.7229 | -30.0 | 1.3 | -0.759 | 0.124 | 0.655 | 0.137 |
| 50681.5193 | 0.7325 | -30.5 | 0.9 | -0.905 | 0.097 | 0.481 | 0.107 |
| 50982.5670 | 0.5052 | -7.2 | 0.7 | -0.813 | 0.120 | 0.510 | 0.132 |
| 50992.5589 | 0.5972 | -20.0 | 1.3 | -0.918 | 0.128 | 0.473 | 0.141 |
| 51000.5715 | 0.6710 | -27.8 | 0.5 | -1.146 | 0.121 | 0.277 | 0.133 |
| 51002.5660 | 0.6894 | -27.4 | 0.1 | -1.113 | 0.113 | 0.284 | 0.124 |
| 51288.5618 | 0.3234 | 15.8 | 0.7 | --a | -- | ||
| 51332.5522 | 0.7285 | -30.1 | 0.4 | -1.316 | 0.127 | 0.068 | 0.140 |
| 51381.4301 | 0.1787 | 14.9 | 0.5 | -0.925 | 0.117 | 0.610 | 0.129 |
| 51382.4819 | 0.1884 | 16.1 | 0.6 | -1.019 | 0.096 | 0.375 | 0.105 |
| 51383.3908 | 0.1968 | 16.2 | 0.6 | -1.186 | 0.104 | 0.287 | 0.114 |
| 51385.4111 | 0.2154 | 17.6 | 0.5 | -1.342 | 0.082 | 0.208 | 0.090 |
| 51386.3445 | 0.2240 | 18.0 | 0.5 | -1.353 | 0.104 | 0.158 | 0.115 |
| 51387.3975 | 0.2337 | 17.7 | 0.5 | -1.285 | 0.063 | 0.135 | 0.069 |
| 51387.4260 | 0.2339 | 17.7 | 0.5 | -1.325 | 0.056 | 0.134 | 0.061 |
| 51388.3746 | 0.2427 | 18.4 | 0.5 | -1.380 | 0.075 | 0.089 | 0.082 |
| 51407.6048 | 0.4198 | 4.0 | 0.6 | -1.316 | 0.078 | 0.113 | 0.086 |
| 51417.5704 | 0.5115 | -7.6 | 0.5 | -0.475 | 0.154 | 0.876 | 0.169 |
| 51423.4962 | 0.5661 | -16.5 | 0.4 | -0.376 | 0.135 | 1.206 | 0.149 |
| 51426.4815 | 0.5936 | -19.5 | 0.3 | -0.750 | 0.087 | 0.607 | 0.096 |
| 51427.4105 | 0.6022 | -20.9 | 0.4 | -0.903 | 0.100 | 0.433 | 0.110 |
| 51465.4373 | 0.9524 | -12.7 | 0.7 | -1.009 | 0.105 | 0.542 | 0.116 |
| 51473.4580 | 0.0263 | -3.5 | 0.7 | -1.324 | 0.101 | 0.215 | 0.111 |
| 51474.2698 | 0.0337 | -1.3 | 0.7 | -1.387 | 0.076 | 0.153 | 0.083 |
| 51476.2680 | 0.0521 | 0.4 | 0.6 | -1.342 | 0.069 | 0.160 | 0.076 |
| 51477.3756 | 0.0576 | -- | -- | -1.259 | 0.067 | 0.207 | 0.074 |
Hall et al. (1990a), from Sanford's (1925) data set, re-determined the
elements for a circular orbit and derived JD
![]() as the time of conjunction
(primary in front). From their own light curve (dominated by ellipticity effect)
they deduced a time of conjunction JD
as the time of conjunction
(primary in front). From their own light curve (dominated by ellipticity effect)
they deduced a time of conjunction JD
![]() .
Combining the photometric and spectroscopic
epoch of conjunction, Hall et al. (1990a) derived a period of 108.854 days. This value is
slightly different from that given by Sanford (1925) of 108.57 days
but very similar to the one they deduced from Fourier analysis of V band photometry
(108.83 days).
.
Combining the photometric and spectroscopic
epoch of conjunction, Hall et al. (1990a) derived a period of 108.854 days. This value is
slightly different from that given by Sanford (1925) of 108.57 days
but very similar to the one they deduced from Fourier analysis of V band photometry
(108.83 days).
If we use the above-mentioned ephemeris of Hall et al. (1990a)
to fold in phase our radial velocities, the time of conjunction (primary
star in front) occurs at phase
![]() ,
indicating that the period and/or the time of
conjunction are not correct.
,
indicating that the period and/or the time of
conjunction are not correct.
![\begin{figure}
\par\includegraphics[width=7.6cm,clip]{ms1120f1.ps}\end{figure}](/articles/aa/full/2001/31/aa1120/img24.gif) |
Figure 1: The cleaned periodogram of our and literature RV data. The peak corresponds to a period of 108.578 days. |
| Open with DEXTER | |
Radial velocities available from the literature (excluding the poor-quality five measures
of Xue-fu & Hui-song 1986a) and our own data have been analysed
applying the periodogram technique (Scargle 1982).
The CLEAN iterative deconvolution algorithm
(Roberts et al. 1986) has been used to eliminate the effects of the data sampling
introduced by the observation spectral window in the power spectrum. The maximum of the
power spectrum, plotted in Fig. 1, yields a period of 108.578 days, very close
to Sanford's estimate.
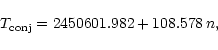
The new ephemeris we obtain is
The observed RV values are displayed as a function of the orbital phase,
determined from our ephemeris (Eq. (1)), in
Fig. 2.
Adopting our conjunction time, the epoch of Hall et al. (1990a),
![]() ,
appears to be shifted by half a period, i.e. this light-curve minimum epoch
corresponds to the
conjunction with the hot secondary star in front instead of the cool primary star, as they assumed.
The epoch of the deeper minimum observed by Barksdale et al. (1985) is
in good agreement with our ephemeris.
,
appears to be shifted by half a period, i.e. this light-curve minimum epoch
corresponds to the
conjunction with the hot secondary star in front instead of the cool primary star, as they assumed.
The epoch of the deeper minimum observed by Barksdale et al. (1985) is
in good agreement with our ephemeris.
Following Lucy & Sweeney (1971), we have assumed circular orbits and deduced new orbital parameters from our own radial velocities. The best fit orbital solution for the cooler component is reported in Table 2.
![\begin{figure}
\par\includegraphics[width=7.95cm,clip]{ms1120f2.ps} \end{figure}](/articles/aa/full/2001/31/aa1120/img27.gif) |
Figure 2:
Radial velocities of HR 7428 and circular solution. Our own data
are displayed with filled circles. Other symbols represent literature RV
data, not used for the orbital solution.
Two radial velocity measurements for the hot star, from
our own blue-violet spectrum ( |
| Open with DEXTER | |
| Element | Present solution | Sanford solution |
|
|
22.1 kms-1 | |
|
|
|
-5.2 kms-1 |
|
|
|
2423455.21 |
| P |
|
108.5707 days |
|
|
|
|
|
|
|
0.1222 |
Due to the low S/N ratio of HR 7428 spectrum at these
wavelengths, the residual spectrum is rather noisy, but clearly shows the typical
signatures of a hot star, like the strong and wide Balmer lines.
![\begin{figure}
\par\includegraphics[width=8.15cm,clip]{ms1120f3.ps}\end{figure}](/articles/aa/full/2001/31/aa1120/img41.gif) |
Figure 3: Residual spectrum of the hot component of HR 7428 in the violet region, obtained as described in the text. The spectrum of Vega shifted downward by 0.2 units is displayed for comparison. The three hydrogen Balmer lines H9, H10 and H11 are clearly visible. |
| Open with DEXTER | |
We have cross-correlated the orders of the residual spectrum containing the
strongest lines with the corresponding ones of Vega to find the radial velocity
of the hotter component at this phase (
![]() ).
The evaluated radial velocity (-
).
The evaluated radial velocity (-
![]() )
has a rather large error
(
)
has a rather large error
(![]()
![]() )
because of the noise
and of the large width of the hydrogen lines.
)
because of the noise
and of the large width of the hydrogen lines.
Another possibility for measuring the radial velocity of the hot component is to
look for spectral signatures of the A2 star in high resolution IUE spectra.
Unfortunately, no high resolution spectrum at short wavelengths (where the
A2 star flux overcomes that of the cooler companion) is available.
However, we could use the well exposed part of the long-wavelength region
of spectrum LWR10313, acquired with IUE on 1981 April 8th (
![]() )
and
retrieved from the IUE Final Archive.
We have also retrieved the spectrum LWR09830 of Vega, acquired
nearly at the same time.
)
and
retrieved from the IUE Final Archive.
We have also retrieved the spectrum LWR09830 of Vega, acquired
nearly at the same time.
By cross-correlation of each order of the HR 7428 spectrum with the corresponding one
of Vega, we measured the radial velocity of the A2 star, obtaining
+
![]() .
The large error is essentially due to
the low S/N ratio.
.
The large error is essentially due to
the low S/N ratio.
With these two RV values, we are able to give, for the first time, a tentative orbital solution for the hot component.
The orbital parameters of the hot component,
including the values of
![]() we derived, are reported in Table 3.
we derived, are reported in Table 3.
Difficulties in accounting for optical and infrared magnitudes adopting stellar parameters reported in the literature were encountered by comparing black body emission with observed photometric fluxes (Rodonò et al. 1998).
As a first step, we have checked the consistency of magnitudes and colours with the
radius of the cool component reported in the literature, by means
of the Barnes-Evans relation (Barnes et al. 1976) between (V-R) colour
index, V magnitude and angular diameter ![]() for late type stars:
for late type stars:
 |
(2) |
We made a more accurate determination of physical parameters by using UBV magnitudes given in the literature and low resolution IUE spectra, whose spectral region is essentially dominated by the hot component, comparing them with synthetic theoretical spectra.
We defined an average observed UV spectrum using the available highest S/N ratio spectra, namely LWP 27954 and LWP 30925 for the long wavelength region (1850-3350 Å) and SWP 50606 and SWP 50609 for the short wavelength region (1150-2000 Å), retrieved from the IUE Final Archive (Nichols & Linsky 1996).
IUE spectra, as well as optical photometry, have been corrected for interstellar extinction.
The typical value of 1 magnitude per kilo-parsec for the interstellar extinction and the
Hipparcos distance, adopted for the computations, lead to
an extinction magnitude A(V
![]() 32.
Assuming the standard reddening law A(V
32.
Assuming the standard reddening law A(V
![]() (B-V), a colour excess
E(B-
(B-V), a colour excess
E(B-
![]() 10 has been derived.
IUE spectra have been de-reddened according to the selective extinction function of
Cardelli et al. (1989).
10 has been derived.
IUE spectra have been de-reddened according to the selective extinction function of
Cardelli et al. (1989).
Synthetic spectra have been generated with the NextGen (Hauschildt et al. 1999a, 1999b) photosphere models for the hotter secondary and cool primary star. The bright cool star model was computed for this purpose by Dr. Peter H. Hauschildt, including a spherical symmetry solution (Hauschildt et al. 1999b).
Consistent with the previous estimates of spectral type and with our
estimate of the mass, several models between
![]() K and 9400 K were considered
for the hot component.
To take into account the uncertainties in the relation between spectral type and
effective temperature of the cooler component, initially we considered models with
K and 9400 K were considered
for the hot component.
To take into account the uncertainties in the relation between spectral type and
effective temperature of the cooler component, initially we considered models with
![]() K, 4400 K, and 4600 K. The first model turned out to be cooler and
the last hotter for our observational data.
Finally, in agreement with the accurate spectral type determination by Ginestet et al.
(1999), two models of
K, 4400 K, and 4600 K. The first model turned out to be cooler and
the last hotter for our observational data.
Finally, in agreement with the accurate spectral type determination by Ginestet et al.
(1999), two models of
![]() K, with
K, with
![]() ,
[M/H]=0,
,
[M/H]=0,
![]() and with
and with ![]() ,
[M/H]=0,
,
[M/H]=0,
![]() respectively, were
considered.
respectively, were
considered.
Since synthetic spectra give fluxes at the stellar surface, the comparison of models with observations has been made by scaling the result with the angular radii of the components and the distance.
Several iterations have been performed to find the model that gives the better fit to the IUE spectrum and optical photometry, allowing the stellar parameters to vary independently. However, some constraints have been placed and tests for consistency have been made.
The distance was fixed to the Hipparcos value and the effective temperature adopted for the cool component was checked to be consistent with the spectral type classification and spectral line behaviour.
The temperature of the hotter component was mainly constrained by the shape of the UV spectral region. The temperature and the radius of the cooler component are instead mainly linked to the near-UV and optical spectral distribution.
The errors in the effective temperatures have been estimated as the minimum
![]() value that gives appreciable difference with respect to the observed
spectrum. Due to the evident mismatch in the flux distribution of the
two models with
value that gives appreciable difference with respect to the observed
spectrum. Due to the evident mismatch in the flux distribution of the
two models with
![]() and 4600 K with respect to the observed one, we can
estimate an uncertainty in the temperature of the cooler component, smaller than 200 K,
probably of 100-150 K.
For the hot component, having a lower weight in the composite spectrum,
an error
and 4600 K with respect to the observed one, we can
estimate an uncertainty in the temperature of the cooler component, smaller than 200 K,
probably of 100-150 K.
For the hot component, having a lower weight in the composite spectrum,
an error
![]() K is deduced from the UV spectral region.
K is deduced from the UV spectral region.
To evaluate the uncertainties in the radii we have considered the two main sources
of errors: the error in Hipparcos distance (![]() 52 pc) and the accuracy of the correction
for interstellar extinction.
The accuracy of the de-reddening procedure is affected by both the intrinsic uncertainties in
the E(B-V) value and the errors in distance.
We have evaluated the first one by assuming the standard deviation on colour
excesses equal to the variance of the coefficients given by Johnson (1965) for
different sky regions.
We find that the dominant source of errors is the distance uncertainty.
52 pc) and the accuracy of the correction
for interstellar extinction.
The accuracy of the de-reddening procedure is affected by both the intrinsic uncertainties in
the E(B-V) value and the errors in distance.
We have evaluated the first one by assuming the standard deviation on colour
excesses equal to the variance of the coefficients given by Johnson (1965) for
different sky regions.
We find that the dominant source of errors is the distance uncertainty.
The final best-fit stellar parameters are listed in Table 4 together with the estimated errors.
The errors in the parameters, listed in Table 4, do not include any intrinsic uncertainty for the synthetic spectra. However, Hauschildt et al. (1999a), from a comparison of their models with the observed UV and optical spectra of solar type stars and Vega, found discrepancies always smaller than a few percent in the continuum. This source of error should be thus negligible in comparison with the accuracy of the data themselves.
In Fig. 4 the spectrum obtained by summing the synthetic spectra for the hot and cool
component, degraded to the IUE spectral resolution, is plotted superimposed on the IUE
de-reddened spectrum (left) and on the UBV fluxes (right).
In the latter case the synthetic spectrum was convolved with a Gaussian kernel
having a semi-amplitude of 30 Å.
The models displayed have
![]() K,
K,
![]() and
and
![]() K,
K,
![]() for hotter and cooler components, respectively.
The radii which give the best fit to the observed spectrum are 2.25
for hotter and cooler components, respectively.
The radii which give the best fit to the observed spectrum are 2.25 ![]() and
40
and
40 ![]() ,
respectively.
,
respectively.
![\begin{figure}
\par\includegraphics[width=17.55cm,clip]{ms1120f4.ps} \end{figure}](/articles/aa/full/2001/31/aa1120/img78.gif) |
Figure 4:
Comparison of the photospheric models of the two components
of HR 7428 with the IUE low resolution spectra ( left) and UBV fluxes ( right)
at Earth.
Both IUE spectra and optical photometry have been de-reddened with E(B-V) = 0.10.
A distance of 322.6 pc, and radii of 2.25 and 40 |
| Open with DEXTER | |
The only measurements of the projected rotational velocity of HR 7428 that we found in the
literature are
![]() km
km![]() s-1 reported by Hui-song & Xue-fu (1987) and
s-1 reported by Hui-song & Xue-fu (1987) and
![]() km
km![]() s-1 measured by De Medeiros & Mayor (1995) with
CORAVEL.
Notwithstanding the moderate resolution, we have performed
s-1 measured by De Medeiros & Mayor (1995) with
CORAVEL.
Notwithstanding the moderate resolution, we have performed ![]() estimates on our
spectra, taking advantage of the large number of observations and of the high S/N ratio.
We have compared the echelle orders of HR 7428 centered at 6250 and 6400 Å with those of
several slowly-rotating K-type giant stars, acquired with the same instrumentation.
The standard stars that give the best reproduction of the HR 7428 spectrum are
estimates on our
spectra, taking advantage of the large number of observations and of the high S/N ratio.
We have compared the echelle orders of HR 7428 centered at 6250 and 6400 Å with those of
several slowly-rotating K-type giant stars, acquired with the same instrumentation.
The standard stars that give the best reproduction of the HR 7428 spectrum are ![]() Oph
(K2 III) and
Oph
(K2 III) and ![]() Ari (K2 III), whose
Ari (K2 III), whose ![]() 's are negligible in comparison to the
instrumental resolution.
's are negligible in comparison to the
instrumental resolution.
We have set up a procedure for the ![]() determination.
First we aligned in wavelength the spectra of the active and standard
star by means of cross-correlation,
then the spectrum of the standard star was progressively broadened by
convolution with a rotational profile of increasing
determination.
First we aligned in wavelength the spectra of the active and standard
star by means of cross-correlation,
then the spectrum of the standard star was progressively broadened by
convolution with a rotational profile of increasing ![]() .
At each step, the sum of residuals between the observed and template spectrum was calculated
and, at the end, the minimum of the residuals was found.
The
.
At each step, the sum of residuals between the observed and template spectrum was calculated
and, at the end, the minimum of the residuals was found.
The ![]() value that we deduced by analysing several HR 7428 spectra is
value that we deduced by analysing several HR 7428 spectra is
![]() km
km![]() s-1, in very good agreement with the CORAVEL measurement (De Medeiros &
Mayor 1995).
s-1, in very good agreement with the CORAVEL measurement (De Medeiros &
Mayor 1995).
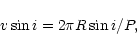
The projected rotational velocity is given by
The system inclination that we derive from Eq. (3) with
![]() km
km![]() s-1 is
s-1 is
![]() .
From the errors in radius (16%) and in
.
From the errors in radius (16%) and in ![]() (6%) we
estimated the error in
(6%) we
estimated the error in ![]() ,
which implies a system inclination in the
50
,
which implies a system inclination in the
50
![]() -75
-75
![]() range.
The maximum inclination of 75
range.
The maximum inclination of 75![]() is constrained by the absence of eclipse
in the HR 7428 light curve. Indeed, from radii and temperature that we determined
(Table 4), a primary eclipse (hot star beyond) of
0
is constrained by the absence of eclipse
in the HR 7428 light curve. Indeed, from radii and temperature that we determined
(Table 4), a primary eclipse (hot star beyond) of
0
![]() 07 in V band and 0
07 in V band and 0
![]() 13 in B should be observed.
These inclination values lead to masses of the two components
13 in B should be observed.
These inclination values lead to masses of the two components
![]()
![]() and
and
![]()
![]() for
for
![]() ,
and
,
and
![]()
![]() and
and
![]()
![]() for
for
![]() ,
while the
lower limit of inclination (50
,
while the
lower limit of inclination (50![]() )
would lead to higher masses not consistent with
the spectral types.
)
would lead to higher masses not consistent with
the spectral types.
Using the effective temperatures and radii in Table 4, we have placed the two
components of HR 7428 on the
![]() plane.
Their position and the evolutionary tracks for intermediate mass stars calculated by
Fagotto et al. (1994) are displayed in Fig. 5.
plane.
Their position and the evolutionary tracks for intermediate mass stars calculated by
Fagotto et al. (1994) are displayed in Fig. 5.
The cool component lies in the region of He-burning stars, and implies
a mass from 4 to 5 ![]() ,
more consistent with the higher inclination limit,
and an age from 140 to 150 Myr.
The position of the hot component is consistent with a 2.3
,
more consistent with the higher inclination limit,
and an age from 140 to 150 Myr.
The position of the hot component is consistent with a 2.3 ![]() star still on
the main-sequence band, but slightly evolved. Its estimated age of 100-250 Myr is in
perfect agreement with the estimated age of the cooler more massive component.
This suggests a normal evolution of the two stars, yet without any relevant mass exchange,
as expected from the long orbital period.
star still on
the main-sequence band, but slightly evolved. Its estimated age of 100-250 Myr is in
perfect agreement with the estimated age of the cooler more massive component.
This suggests a normal evolution of the two stars, yet without any relevant mass exchange,
as expected from the long orbital period.
![\begin{figure}
\par\includegraphics[width=8.4cm,clip]{ms1120f5.ps}\end{figure}](/articles/aa/full/2001/31/aa1120/img105.gif) |
Figure 5:
Position of the cool (grey dot) and hot (black square) components of
HR 7428 in a
|
| Open with DEXTER | |
The Hipparcos spacecraft has observed HR 7428 from December 1989 till March 1993.
The Hipparcos
![]() photometric system is characterised by a response curve including
B and V band and therefore not immediately comparable to classical UBV photometry.
photometric system is characterised by a response curve including
B and V band and therefore not immediately comparable to classical UBV photometry.
![\begin{figure}
\par\includegraphics[width=8.4cm,clip]{ms1120f6.ps}\end{figure}](/articles/aa/full/2001/31/aa1120/img107.gif) |
Figure 6: Top: Hipparcos' magnitudes of HR 7428 through the period between 1989 and 1993, where the dashed line is the light curve solution accounting for the proximity effects. Bottom: Difference between Hipparcos magnitudes and the synthetic light curve. |
| Open with DEXTER | |
The photometric data are shown in Fig. 6, where
![]() magnitudes are
plotted versus orbital phase computed with our new ephemeris.
Notwithstanding the scatter of points, a photometric double wave appears well defined,
with two maxima nearly at the quadratures and two minima nearly at the conjunctions.
However, the behaviour is clearly asymmetric, the first maximum being brighter, with a peak
at about phase 0.2. This behaviour is very similar to that observed by Strassmeier
et al. (1989) from 1983 to 1984.
These asymmetries were supposed to be connected to rotational modulation of starspots
unevenly distributed on the surface of the K primary star.
In a detailed study Hall et al. (1990a) show that the starspot wave, detected after
removal of the variability produced by the ellipticity effect, is not permanent, and sometimes two
different waves are simultaneously present.
magnitudes are
plotted versus orbital phase computed with our new ephemeris.
Notwithstanding the scatter of points, a photometric double wave appears well defined,
with two maxima nearly at the quadratures and two minima nearly at the conjunctions.
However, the behaviour is clearly asymmetric, the first maximum being brighter, with a peak
at about phase 0.2. This behaviour is very similar to that observed by Strassmeier
et al. (1989) from 1983 to 1984.
These asymmetries were supposed to be connected to rotational modulation of starspots
unevenly distributed on the surface of the K primary star.
In a detailed study Hall et al. (1990a) show that the starspot wave, detected after
removal of the variability produced by the ellipticity effect, is not permanent, and sometimes two
different waves are simultaneously present.
To better define the starspot wave, we have calculated the light curve, dominated by the ellipticity effect, in absence of starspots, using the system parameters we derived in the previous sections.
Assuming a system inclination of 67
![]() ,
we found a
full amplitude of about 0
,
we found a
full amplitude of about 0
![]() 02, that is a bit smaller than the 0
02, that is a bit smaller than the 0
![]() 033 value found by Hall
et al. (1990a), and than the 0
033 value found by Hall
et al. (1990a), and than the 0
![]() 04 value found by Strassmeier et al. (1989).
A better agreement can be found with a higher inclination (near the maximum value of 75
04 value found by Strassmeier et al. (1989).
A better agreement can be found with a higher inclination (near the maximum value of 75
![]() )
and a
larger radius of the cool star (46
)
and a
larger radius of the cool star (46 ![]() )
or with the minimum system separation allowed
by the errors in
)
or with the minimum system separation allowed
by the errors in
![]() .
.
The residual asymmetry that appears in the difference between Hipparcos data and the ellipticity light curve solution may result from the presence of starspots, as suggested by Hall et al. (1990a).
In 1999 we have acquired a spectrum of HR 7428 in the blue-violet region. The Ca II H & K line region is shown in Fig. 7.
![\begin{figure}
\par\includegraphics[width=8.08cm,clip]{ms1120f7.ps} \end{figure}](/articles/aa/full/2001/31/aa1120/img109.gif) |
Figure 7: Ca II H & K lines in a spectrum of HR 7428 acquired in 1999. |
| Open with DEXTER | |
The chromospheric emission core is evident both in H and K lines. These emission components are broad, as expected from the Wilson-Bappu effect for a low gravity star (Elgarøy et al. 1997).
The absorption wings of the Ca II H line are deeper than
those of the K line, due to the broad and stron hydrogen H![]() absorption
line of the hot component that is superimposed on the Ca II H line. Furthermore, the
asymmetry seen into the K line core is probably due to the sharp K line absorption of the hot
component spectrum that is blue-shifted at the time of the observation (
absorption
line of the hot component that is superimposed on the Ca II H line. Furthermore, the
asymmetry seen into the K line core is probably due to the sharp K line absorption of the hot
component spectrum that is blue-shifted at the time of the observation (
![]() ).
).
The observed profiles are similar to those observed by Fernández-Figueroa et al. (1994), but in their spectrum the K-line core absorption is slightly red-shifted.
![\begin{figure}
\par\includegraphics[width=8.8cm,clip]{ms1120f8.ps}\end{figure}](/articles/aa/full/2001/31/aa1120/img112.gif) |
Figure 8:
Spectral image for the H |
| Open with DEXTER | |
The H![]() line appears significantly variable in width, intensity and shape.
line appears significantly variable in width, intensity and shape.
In Fig. 8 all the spectra of HR 7428 we have obtained in the H![]() region are shown, in orbital-phase order, as a trailed spectral image.
In particular, from inspection of Fig. 8,
variable broad absorption and emission components (red-shifted and blue-shifted,
respectively) are apparent around the H
region are shown, in orbital-phase order, as a trailed spectral image.
In particular, from inspection of Fig. 8,
variable broad absorption and emission components (red-shifted and blue-shifted,
respectively) are apparent around the H![]() absorption line of the K2 II-III star.
absorption line of the K2 II-III star.
In order to analyze the behaviour of the H![]() feature in more detail,
we have used the technique of spectral subtraction.
The standard low-active star
feature in more detail,
we have used the technique of spectral subtraction.
The standard low-active star ![]() Ari, whose spectral type
(K2 III) is very similar to that of the cool component of HR 7428, has been used to provide
a "normal" H
Ari, whose spectral type
(K2 III) is very similar to that of the cool component of HR 7428, has been used to provide
a "normal" H![]() template.
template.
In the synthesis of the "inactive template'' we have neglected the contribution of the hot
component because, according to the spectral model fit developed in Sect. 3.2, its weight
to the total flux in the H![]() region is only 4%.
region is only 4%.
The difference H![]() profile, obtained with the spectral subtraction, therefore represents the
contribution from the chromosphere of the
K2 II-III star and from circumstellar material (see e.g. Richards 1992; Frasca et al. 2000).
profile, obtained with the spectral subtraction, therefore represents the
contribution from the chromosphere of the
K2 II-III star and from circumstellar material (see e.g. Richards 1992; Frasca et al. 2000).
Figure 9, left panel, displays a sample of observed spectra with
superimposed the spectrum
of ![]() Ari artificially broadened to
Ari artificially broadened to
![]() (De Medeiros & Mayor 1995). The difference of the observed profile with that of the
reference star
(De Medeiros & Mayor 1995). The difference of the observed profile with that of the
reference star ![]() Ari, right panel of
Fig. 9, displays a complicated structured profile.
The H
Ari, right panel of
Fig. 9, displays a complicated structured profile.
The H![]() line core appears always filled-in with emission, and, in many cases,
emission and/or absorption excess is present in the line wings.
We can distinguish three typical situations:
line core appears always filled-in with emission, and, in many cases,
emission and/or absorption excess is present in the line wings.
We can distinguish three typical situations:
![\begin{figure}
\par\includegraphics[width=14.05cm,clip]{ms1120f9.ps}\end{figure}](/articles/aa/full/2001/31/aa1120/img117.gif) |
Figure 9:
A sample of spectra of HR 7428 (thick lines)
compared to the rotationally broadened spectra of |
| Open with DEXTER | |
Such excess emission and/or absorption is not easily interpreted in terms of
chromospheric activity.
Broad H![]() emission wings are sometimes observed in RS CVn binaries.
The phenomenon is always associated with transient events like strong flares (Catalano & Frasca
1994; Foing et al. 1994) or intense active regions, but also the
line core fills in
with emission and the overall profile appears to be composed of a narrow bright emission component
and a broad fainter one (Montes et al. 1997, 2000;
Lanzafame et al. 2000).
emission wings are sometimes observed in RS CVn binaries.
The phenomenon is always associated with transient events like strong flares (Catalano & Frasca
1994; Foing et al. 1994) or intense active regions, but also the
line core fills in
with emission and the overall profile appears to be composed of a narrow bright emission component
and a broad fainter one (Montes et al. 1997, 2000;
Lanzafame et al. 2000).
Although this H![]() behaviour is difficult to ascribe to chromospheric inhomogeneities
and may arise from circumstellar matter, as we will propose below, a chromospheric emission
component should be present in the H
behaviour is difficult to ascribe to chromospheric inhomogeneities
and may arise from circumstellar matter, as we will propose below, a chromospheric emission
component should be present in the H![]() profile, as suggested by the Ca II emission
shown in Fig. 7 (see also Fernández-Figueroa et al. 1994), and by the
Mg II h and k emission.
We have re-determined, from archive IUE spectra, a Mg II flux
profile, as suggested by the Ca II emission
shown in Fig. 7 (see also Fernández-Figueroa et al. 1994), and by the
Mg II h and k emission.
We have re-determined, from archive IUE spectra, a Mg II flux
![]() at the stellar surface, and then,
according to the average correlation between H
at the stellar surface, and then,
according to the average correlation between H![]() and Mg II emission
established by Frasca & Catalano (1994), we estimate an expected net H
and Mg II emission
established by Frasca & Catalano (1994), we estimate an expected net H![]() equivalent
width of 0.2 Å.
equivalent
width of 0.2 Å.
![\begin{figure}
\par\includegraphics[width=8.7cm,clip]{ms1120f10.ps} \end{figure}](/articles/aa/full/2001/31/aa1120/img119.gif) |
Figure 10:
Equivalent width of net H |
| Open with DEXTER | |
We have determined, from the difference spectra, the excess H![]() equivalent width
(EW
equivalent width
(EW
![]() )
by integrating the difference profile including the extended wings. Values
are displayed in Fig. 10 including error bars determined as the product of the
integration range and the (S/N)-1 ratio, evaluated in two line-free windows selected
on the residual spectrum at the two sides of the H
)
by integrating the difference profile including the extended wings. Values
are displayed in Fig. 10 including error bars determined as the product of the
integration range and the (S/N)-1 ratio, evaluated in two line-free windows selected
on the residual spectrum at the two sides of the H![]() line.
line.
These measurements show a large spread, significantly greater than the estimated errors,
with some intrinsic
phase-dependent trend. In particular, the steady decrease from positive to negative values
between phase 0
![]() 2 and 0
2 and 0
![]() 4
clearly reflects the development of the extended absorption wings. Fluctuation of
the excess emission (positive values) reflects changes with phase and from cycle to cycle.
4
clearly reflects the development of the extended absorption wings. Fluctuation of
the excess emission (positive values) reflects changes with phase and from cycle to cycle.
The average net H![]()
![]() Å measured
between phase 0
Å measured
between phase 0
![]() 7 and 0
7 and 0
![]() 2, when no excess emission or absorption is present, fairly well
agrees with the expected chromospheric emission estimated from the Mg II emission flux.
Emission EW values significantly larger than
2, when no excess emission or absorption is present, fairly well
agrees with the expected chromospheric emission estimated from the Mg II emission flux.
Emission EW values significantly larger than ![]() 0.3 Å are found between phase
0
0.3 Å are found between phase
0
![]() 5 and 0
5 and 0
![]() 8 when the extended emission wings are present, thus we conclude that the real
chromospheric H
8 when the extended emission wings are present, thus we conclude that the real
chromospheric H![]() emission is at level of about
emission is at level of about ![]() 0.3 Å. No emission
modulation, ascribable to the rotation effect of inhomogeneous distribution
of emission, can be distinguished.
0.3 Å. No emission
modulation, ascribable to the rotation effect of inhomogeneous distribution
of emission, can be distinguished.
The emission wing profile, even if of lower intensity, is quite similar to that observed in
shell stars (Marlborough & Cowley 1974) or in mass-losing red giants (Cacciari &
Freeman 1983)
as well as in the spectrum of the supergiant component of the binary system ![]() Aurigae,
which is supposed to have a ring-like structure of moving gaseous clouds. On the other hand,
the extended absorption wing profile seen between phase 0
Aurigae,
which is supposed to have a ring-like structure of moving gaseous clouds. On the other hand,
the extended absorption wing profile seen between phase 0
![]() 2 and 0
2 and 0
![]() 3 closely resembles the
extra absorption present in the H
3 closely resembles the
extra absorption present in the H![]() line of the T Tau star SU Aur (Petrov et al.
1996), explained as the effect of simultaneous outflows and inflows of matter.
line of the T Tau star SU Aur (Petrov et al.
1996), explained as the effect of simultaneous outflows and inflows of matter.
These similarities do suggest that some flow of matter can be responsible of the excess
emission and absorption in HR 7428. Here we propose that a single cloud localized in the
region between phase 0
![]() 0 and 0
0 and 0
![]() 5 can produce both the extra emission and extra absorption
in the H
5 can produce both the extra emission and extra absorption
in the H![]() wings. This cloud is mainly seen projected against the K star disk at phase
0
wings. This cloud is mainly seen projected against the K star disk at phase
0
![]() 2-0
2-0
![]() 3 and produces the extra absorption in the H
3 and produces the extra absorption in the H![]() wing spectrum of that star.
Between phase 0
wing spectrum of that star.
Between phase 0
![]() 5 and 0
5 and 0
![]() 75 we see the same cloud illuminated and excited by the A2 star and
projected against the sky, so its contribution is an extra-emission, due to radiative
recombinations and de-excitations.
75 we see the same cloud illuminated and excited by the A2 star and
projected against the sky, so its contribution is an extra-emission, due to radiative
recombinations and de-excitations.
| HJD | Phase | Feature | Vel. Shift | Vel. disp. |
| - 2440000 | kms-1 | kms-1 | ||
| 1385.4111 | 0.2154 | Abs. | 11.2 | 49.2 |
| 1386.3447 | 0.2240 | Abs. | 12.6 | 54.5 |
| 1387.3975 | 0.2337 | Abs. | 4.6 | 50.8 |
| 1387.4258 | 0.2339 | Abs. | 4.3 | 55.2 |
| 1388.3750 | 0.2427 | Abs. | 1.0 | 59.1 |
| 631.5586 | 0.2724 | Abs. | 20.8 | 89.6 |
| 632.5635 | 0.2817 | Abs. | 28.1 | 125.3 |
| 633.5440 | 0.2907 | Abs. | 31.9 | 115.9 |
| 634.5732 | 0.3002 | Abs. | 43.6 | 136.6 |
| 636.5156 | 0.3181 | Abs. | 12.4 | 99.4 |
| 1407.6045 | 0.4198 | Abs. | 18.7 | 51.3 |
| 982.5674 | 0.5052 | Em. | 15.0 | 108.1 |
| 1417.5703 | 0.5115 | Em. | -41.7 | 133.2 |
| 1423.4961 | 0.5661 | Em. | -23.5 | 174.0 |
| 1426.4814 | 0.5936 | Em. | -31.5 | 146.1 |
| 1427.4102 | 0.6022 | Em. | -44.6 | 133.8 |
| 1000.5713 | 0.6710 | Em. | -16.0 | 87.9 |
| 1002.5664 | 0.6894 | Em. | -16.8 | 89.8 |
| 678.4854 | 0.7046 | Em. | -11.3 | 144.5 |
| 679.4756 | 0.7137 | Em. | -5.4 | 101.6 |
| 680.4775 | 0.7229 | Em. | 3.1 | 106.7 |
| 681.5195 | 0.7325 | Em. | -2.0 | 104.7 |
Both the broad extra-emission and absorption components exhibit asymmetric profiles
compared to the chromospheric excess emission line of the K2 II-III star, indicating a
relative global motion of the cloud with respect to the star.
To quantify this motion we have estimated the
central wavelength positions of the extra emission/absorption by fitting Gaussian profiles
to the broad components and to the sharp central
emission in the difference spectrum (see Fig. 11 for the description). Measured
velocity shifts of the broad component are reported in Table 5 together
with the velocity dispersion derived from the FWHM of the feature.
From this table one sees the red-shifted behaviour of the
extra-absorption feature,
that reaches its maximum shift (44 km![]() s-1), intensity and width at phase 0
s-1), intensity and width at phase 0
![]() 30.
The broad emission component is instead mainly blue-shifted with respect to the K2 II-III
star with a maximum of about 45 km
30.
The broad emission component is instead mainly blue-shifted with respect to the K2 II-III
star with a maximum of about 45 km![]() s-1 at phase
s-1 at phase ![]() 0
0
![]() 6.
6.
![\begin{figure}
\par\includegraphics[width=8.3cm,clip]{ms1120f11.ps}\end{figure}](/articles/aa/full/2001/31/aa1120/img123.gif) |
Figure 11:
Upper panel: simulation of the difference spectrum at phase
|
| Open with DEXTER | |
The average FWHM of the broad components ranges from 50 to 140
![]() for the extra-absorption, and from about 90 to 150
for the extra-absorption, and from about 90 to 150
![]() for
the wing emission. This strengthens our hypothesis of a unique structure as being
responsible for
both the extra absorption and the wing-emission, with turbulent velocity of the order of
100-150
for
the wing emission. This strengthens our hypothesis of a unique structure as being
responsible for
both the extra absorption and the wing-emission, with turbulent velocity of the order of
100-150
![]() .
.
![\begin{figure}
\par\includegraphics[width=7.8cm,clip]{ms1120f12.ps}\end{figure}](/articles/aa/full/2001/31/aa1120/img125.gif) |
Figure 12: Radial velocity of the extra-absorption (dots) and emission (open circles) in the barycentric rest frame. The dotted line is the RV curve of the K2 II-III star; the RV curve of the A2 star is also drawn (dash-dot line). The full line represents the RV curve of the extended region near the Roche-lobe limit of the K2 star (see Fig. 13). |
| Open with DEXTER | |
In Fig. 12 we plot the radial velocity
of the components and of the broad absorption and emission features in the center of mass
(CM) frame, as function of orbital phase. Although not strictly sinusoidal, the excess
emission/absorption follows the orbital motion of the K2 II-III star with a small phase shift
and a larger amplitude, about 45-50 km![]() s-1. This does support our hypothesis that the
emission/absorption features originate in a gas cloud placed somewhere within the system.
If we assume that the system is fully synchronized, the location of such a cloud relative to
the stars can be found from simple arguments.
s-1. This does support our hypothesis that the
emission/absorption features originate in a gas cloud placed somewhere within the system.
If we assume that the system is fully synchronized, the location of such a cloud relative to
the stars can be found from simple arguments.
Since the radial velocity of the supposed cloud is almost in phase with the K star, it
should be located on the same side of that star with respect to the CM.
Then the projected distance of the cloud is
![]() ,
where
,
where
![]() ,
with q mass ratio and a the system separation, is the
distance of the primary K star from the CM.
,
with q mass ratio and a the system separation, is the
distance of the primary K star from the CM.
![]() and
and ![]() are the velocity semi-amplitudes of the cloud and of the cool
star, respectively. Since the orbital solution gives
are the velocity semi-amplitudes of the cloud and of the cool
star, respectively. Since the orbital solution gives
![]() and
and
![]() ,
then
,
then
![]() km.
From the radial velocity curves in Fig. 12 we can
estimate a phase difference of
km.
From the radial velocity curves in Fig. 12 we can
estimate a phase difference of ![]() 0
0
![]() 1 with respect to the K2 II-III star, which
means that the cloud should lie outside the
line joining the centers of two stars in the direction of advancing
phases. Since we see absorption effects on the cool star spectrum only for a limited phase interval
(0
1 with respect to the K2 II-III star, which
means that the cloud should lie outside the
line joining the centers of two stars in the direction of advancing
phases. Since we see absorption effects on the cool star spectrum only for a limited phase interval
(0
![]() 2-0
2-0
![]() 4), the material should have a limited extent and some thickness
perpendicularly to the orbital plane, because the system inclination is smaller than 90
4), the material should have a limited extent and some thickness
perpendicularly to the orbital plane, because the system inclination is smaller than 90
![]() .
According to the above estimate of the
.
According to the above estimate of the
![]() distance and phase lag, the material seems to
be located inside the Roche lobe of the cool star on the trailing hemisphere side.
distance and phase lag, the material seems to
be located inside the Roche lobe of the cool star on the trailing hemisphere side.
The approximate location of the cloud is sketched as a shaded area in Fig. 13, where a scale model of HR 7428 is presented. Along the outer circle in Fig. 13, which indicates the position of the observer as a function of phase, the length of the arrows is proportional to the radial velocity of the broad emission/absorption feature in the CM rest frame.
![\begin{figure}
\par\includegraphics[width=8.2cm,clip]{ms1120f13.ps}\end{figure}](/articles/aa/full/2001/31/aa1120/img134.gif) |
Figure 13: Schematic model showing the Roche limit and the two components of the system in the orbital plane, as resulting from our solution. The cross indicates the center of mass of the system. The phase ranges of extra-absorption and broad emission features are stressed by thick grey lines. The possible location of the circumstellar region, responsible for the observed behaviour, is also showed as a shaded elliptical area. |
| Open with DEXTER | |
HR 7428 has been included in our program of the H![]() study of RS CVn binaries
because photometric variability attributed to starspots (Hall et al. 1990a)
and H
study of RS CVn binaries
because photometric variability attributed to starspots (Hall et al. 1990a)
and H![]() variable emission (Cha et al. 1994) make this binary an
interesting active system. Actually HR 7428 is not a typical RS CVn system
but an unusual Algol-type system in which the evolved companion is not yet
filling its Roche lobe and shows evident signs of magnetic activity.
variable emission (Cha et al. 1994) make this binary an
interesting active system. Actually HR 7428 is not a typical RS CVn system
but an unusual Algol-type system in which the evolved companion is not yet
filling its Roche lobe and shows evident signs of magnetic activity.
In this work, in addition to the H![]() chromospheric study, we have reached
three main goals: i) we have determined new accurate orbital
parameters; ii) we have given, for the first time, physical parameters of both
components; iii) evidence for inter-system material has been inferred from the
absorption/emission excesses in the H
chromospheric study, we have reached
three main goals: i) we have determined new accurate orbital
parameters; ii) we have given, for the first time, physical parameters of both
components; iii) evidence for inter-system material has been inferred from the
absorption/emission excesses in the H![]() profile.
profile.
We have found that the H![]() line behaviour is too complex to be
explained simply in terms of chromospheric activity. However, we have isolated an excess
emission in the line core that can reflect the chromospheric activity
of the cool K2 II-III component. The average activity level corresponding to an
H
line behaviour is too complex to be
explained simply in terms of chromospheric activity. However, we have isolated an excess
emission in the line core that can reflect the chromospheric activity
of the cool K2 II-III component. The average activity level corresponding to an
H![]() emission equivalent width EW
emission equivalent width EW
![]() Å is in
agreement with the emission in the Mg II h & k and Ca II
H & K lines, and as expected from the long rotation period of 108
Å is in
agreement with the emission in the Mg II h & k and Ca II
H & K lines, and as expected from the long rotation period of 108
![]() 8.
8.
We have derived complete physical parameters of HR 7428, from new radial
velocity data and spectral fit of the UV and optical spectrum. The hotter
component has definitely been classified as an A2 V star a little evolved
off the main sequence. The spectral model fit lead to a radius of about
40 ![]() for the cooler K2 II-III star. This value is significantly smaller
than the previous value of 62
for the cooler K2 II-III star. This value is significantly smaller
than the previous value of 62 ![]() (Hall 1990), but also
a little small to fully justify the observed photometric variations as an ellipticity
effect.
(Hall 1990), but also
a little small to fully justify the observed photometric variations as an ellipticity
effect.
The final values for the temperature and luminosity of the two components
of the system place the hot component as a little-evolved main-sequence
of about 2-3 ![]() and the cooler in the region of the He-burning stars,
in agreement with the range of 4-5
and the cooler in the region of the He-burning stars,
in agreement with the range of 4-5 ![]() we deduce from the orbital
solution. The similar time evolution estimated for the individual components
sets the age of the system in the range 100-200 Myr. This also indicates
a normal independent evolution of the two stars, yet without any relevant
mass exchange or mass loss. As a matter of fact the larger K2 II-III star is still
well inside the relative Roche lobe as shown by the scaled diagram in
Fig. 13, and no mass flow should be expected.
we deduce from the orbital
solution. The similar time evolution estimated for the individual components
sets the age of the system in the range 100-200 Myr. This also indicates
a normal independent evolution of the two stars, yet without any relevant
mass exchange or mass loss. As a matter of fact the larger K2 II-III star is still
well inside the relative Roche lobe as shown by the scaled diagram in
Fig. 13, and no mass flow should be expected.
According to the orbital period and the system separation, the more massive
component of HR 7428 should reach its Roche Lobe on the way to the red giant
branch, leading to a case-C mass exchange. The evolutionary tracks by
Fagotto et al. (1994) predict that the cool star will approach
the Roche-lobe limit at an age of about 170 Myr, i.e. about 20 Myr after
the present stage.
From the H![]() profile we have inferred the presence of inter-system
material that seems to be accumulated mainly on the trailing hemisphere of the
K2 II-III star, just near the edge of the lobe. From the width of the excess
absorption/emission profile we estimate turbulent velocities in the cloud of up to
150 km
profile we have inferred the presence of inter-system
material that seems to be accumulated mainly on the trailing hemisphere of the
K2 II-III star, just near the edge of the lobe. From the width of the excess
absorption/emission profile we estimate turbulent velocities in the cloud of up to
150 km![]() s-1.
Such velocities, very likely, could produce evaporation from the Roche Lobe and mass
loss from the cool star.
s-1.
Such velocities, very likely, could produce evaporation from the Roche Lobe and mass
loss from the cool star.
The evaporated material is expected to accumulate in an envelope or ring
around the system. The presence of circumstellar material around HR 7428
has been clearly detected from ISO observations. Rodonò et al. (1998)
found significant IR excess at wavelengths greater than 1.6 ![]() m
with a definite inversion of the spectrum slope at 25
m
with a definite inversion of the spectrum slope at 25 ![]() m.
m.
Since the K2 II-III star is still well inside its Roche lobe, the problem of the origin of the flowing mass arises. The magnetic activity does not appear able to produce extended loops or prominences, as sometime are observed in active systems like AR Lac (Frasca et al. 2000) or SS Boo (Hall et al. 1990b; Hall & Ramsey 1992) and therefore does not seem to be an appropriate mechanism to trigger a significant mass loss.
Evolutionary models including convection-overshooting predict for a 5 ![]() star a relevant mass loss at the present evolutionary stage of the HR 7428 cooler
component. Models by Maeder & Meynet (1988) and Schaerer et al. (1993)
predict mass loss rates of
star a relevant mass loss at the present evolutionary stage of the HR 7428 cooler
component. Models by Maeder & Meynet (1988) and Schaerer et al. (1993)
predict mass loss rates of
![]() or 10-8
or 10-8
![]() year-1
for stars of 4 or 5 solar masses in these evolutionary phases. Such mass loss rates could
be responsible for the observed circumstellar effects like the extra-absorption/emission
at H
year-1
for stars of 4 or 5 solar masses in these evolutionary phases. Such mass loss rates could
be responsible for the observed circumstellar effects like the extra-absorption/emission
at H![]() and the infrared excess.
A more detailed model of the circumstellar material could be attained with higher
resolution spectra and a better phase coverage.
and the infrared excess.
A more detailed model of the circumstellar material could be attained with higher
resolution spectra and a better phase coverage.
Acknowledgements
We wish to thank the Referee, Dr. D. S. Hall, for carefully reading the manuscript and for valuable comments. We would like to thank G. Carbonaro, A. Distefano, G. Occhipinti, and M. Puleo for valuable help in carrying out our observations. We are grateful to Dr. Peter Hauschildt for the atmosphere models he calculated for us. This work has been supported by the Italian Ministero dell' Università e della Ricerca Scientifica e Tecnologica, the Gruppo Nazionale di Astronomia of the CNR and by the Regione Sicilia which are gratefully acknowledged.