

| Galaxy | Radio | H |
| NGC1055 | no | -- |
| NGC1406 | yes | -- |
| NGC1421 | no | no |
| NGC1511 | yes | yes |
| NGC2748 | no | -- |
| NGC3175 | yes | no |
| NGC3437 | no | -- |
| NGC3717 | no | -- |
| NGC4700 | yes | yesa |
| NGC7090 | yes | yesa |
| NGC7462 | yes | yesa |
 ,
no AGNs and no nearby
interaction partners) the current detection rate is 6 out of 11,
i.e. 55%.
,
no AGNs and no nearby
interaction partners) the current detection rate is 6 out of 11,
i.e. 55%.
The absence of clear evidence for the presence of halos in the remaining galaxies can, as indicated above, have different reasons:
 can exacerbate the problem;
 is
indeed a good search criterion for galaxies with a gaseous
halo.
is
indeed a good search criterion for galaxies with a gaseous
halo.
In addition to the synchrotron radio continuum from relativistic
CR electrons there are other tracers of gaseous halos around
spiral galaxies, of which the most important are H
recombination radiation of warm ionised gas and soft X-ray
emission from a hot thermal plasma (cf. Dahlem 1997).
In the following we briefly summarise those previously published radio continuum images that are relevant for searches of extraplanar emission in the galaxies presented here.
NGC1421: Irwin et al. (1999) found some evidence for extraplanar emission in NGC1421 from their VLA C array 1.4 GHz radio continuum image (see their Fig. 4). The authors provided us with their data, which were combined with our D array visibilities to obtain a map that contains the full flux and has improved angular resolution (as displayed in Fig. 3).
NGC2748: A 15'' resolution 1.465 GHz map of NGC2748 by Hummel et al. (1985) might indicate the presence of radio continuum emission away from its disk plane (their Fig. 1c). However, these authors quote a lower total flux than measured by us. Due to missing short spacings (and thus missing extended flux) these data cannot be used for the present study.
NGC2820: The VLA C array image by Hummel & van der Hulst (1989) has a
higher angular resolution than ours (15'' [their Fig. 1]
compared to
 ;
Fig. 6, above),
but lower sensitivity. Based on a z profile as used by us here
(their Fig. 2), Hummel & van der Hulst (1989) found that
NGC2820 has a thick radio disk or halo at 1.465 GHz. Since
these authors did not report an exponential scale height for
the halo emission, we rely here on our own measurement (note
that this galaxy has been removed from the sample anyway).
The fact that Hummel & van der Hulst find evidence for the
presence of a halo, while there is none in our data,
demonstrates the need for sufficient angular resolution.
;
Fig. 6, above),
but lower sensitivity. Based on a z profile as used by us here
(their Fig. 2), Hummel & van der Hulst (1989) found that
NGC2820 has a thick radio disk or halo at 1.465 GHz. Since
these authors did not report an exponential scale height for
the halo emission, we rely here on our own measurement (note
that this galaxy has been removed from the sample anyway).
The fact that Hummel & van der Hulst find evidence for the
presence of a halo, while there is none in our data,
demonstrates the need for sufficient angular resolution.
NGC3175: A 1.49 GHz radio continuum map of NGC3175 by Condon et al. (1996)
displays three maxima in the galaxy disk, one at the centre and
one each about 45'' on either side of it, thus coinciding with
the most prominent H II regions in the H
image by Ryder
& Dopita (1994). The contour map displayed in Condon et al. (1996) might
also indicate halo emission above its central region. This VLA C
array map has a higher angular resolution (15'' compared to
 )
than ours, but lower sensitivity. It exhibits
a low axial ratio of the radio continuum emission, suggesting that
there might be a relatively small outflow from the nuclear region.
Since it recovers the total flux (the same within the error margins
as our measurement; see Table 3), Condon et al.'s image
can be used for a study of the z structure of the emission
distribution.
)
than ours, but lower sensitivity. It exhibits
a low axial ratio of the radio continuum emission, suggesting that
there might be a relatively small outflow from the nuclear region.
Since it recovers the total flux (the same within the error margins
as our measurement; see Table 3), Condon et al.'s image
can be used for a study of the z structure of the emission
distribution.
Because of the very different integration times, it is not possible to combine Condon et al.'s data with ours. However, the image being available via NED, we have retrieved it and used it to produce a second z profile. This higher-resolution z profile is displayed separately in Fig. 34. The plot reassuringly reproduces the major features from Fig. 25, however in more detail. The distribution of excess emission beyond the thin disk is slightly asymmetric, being brighter on the south-east side (negative offset values), as already visible in our DnC array data. But now it is much clearer that this excess emission, in particular also that on the north-west side, is indeed significant. The results from the fitting process are collected in Table 4.
NGC3437: Condon et al. (1990) presented a high-resolution 1.49 GHz image of NGC3437. However, since it does not recover the total flux of the galaxy, it is not suitable for investigations of the extended emission distribution, including the z structure perpendicular to the disk plane.
NGC5073: We note here that a 1.49 GHz radio image of NGC5073 by Condon
et al. (1990) exhibits a compact central source that is unresolved
at a resolution of about 5''. This is relevant in the context
of the H
data of this galaxy mentioned below. Since it
does not recover the full extended flux of the galaxy, the radio
map cannot be used for a study of the large-scale emission
distribution along the minor axis.
NGC7090: Two "spurs'' of radio emission above the disk of NGC7090 were detected by Harnett & Reynolds (1985) at 843 MHz (see their Plate 3). Our maps are more sensitive and have better angular resolution thus showing more extended halo emission. The brightest spur north-east of the central region, now embedded in extended emission, is visible in our 1.43 GHz map (cf. Fig. 13) as kinks in the isophotal contours, which can be traced from close to the disk plane out to the detection limit of the halo.
NGC7462: There is a tentative detection of extraplanar radio continuum emission from NGC7462 in a 1.49 GHz VLA map by Condon et al. (1987). However, the angular resolution (of 1') and sensitivity of these snapshot observations were insufficient to make a firm statement. Our detection is much more conclusive, in particular because the result comes from observations at two independent frequencies.
NGC7541: Condon et al. (1990) published a snapshot 1.49 GHz map of NGC7541, with a resolution of 15''. It exhibits a dominant unresolved central source, which might hint at the presence of an active nucleus. Since this radio image does not recover all extended source flux, it is not used as part of the present investigation.
line imaging
5 of the 15 galaxies studied here are also in the sample by Lehnert
& Heckman (1995): NGC1511, NGC2820, NGC4527, NGC5073 and
NGC7541. Three of these, namely NGC1511, NGC4527 and NGC5073,
were imaged in H
line emission. In addition, Himages of a few more individual galaxies can be found in the
literature.
NGC1421: An unpublished H
image by Dettmar (priv. comm.) exhibits
numerous H II regions in the disk of NGC1421, indicating a
two-arm spiral structure and an inclination of
.
No extraplanar H
line emission was detected. However,
this might be due to a lack of sensitivity.
NGC1511: The H
image of NGC1511 by Lehnert & Heckman (1995) shows a
disturbed structure, with H II regions that are located outside the
thin disk plane. There are also indications of diffuse H,
which apparently does not arise from the central disk plane, but
there is no direct evidence for halo emission. The disturbance of
its disk might arise from interactions with one of its partners,
NGC1511A or B, or just be its intrinsic structure. With an absolute R magnitude of -18.6 (Lehnert & Heckman 1995) NGC1511 is a low
optical luminosity, low-mass galaxy, in which disturbances are known
to be quite normal (compare, e.g., with NGC1569, NGC4449 or
NGC2188).
NGC3175: An H
image by Ryder & Dopita (1994) shows bright H II regions at the position of the nucleus and what appears to be a
starburst ring with a radius of 3.5 kpc around it. The H II regions at the tangential points of this ring are apparently
the brightest. These might also be "thick'', i.e. extended in
the direction perpendicular to the disk plane. However, no
extended diffuse H
emission is visible, especially
away from the disk plane. Note that NGC3175 does not exhibit
any signs of ongoing star formation outside the starburst ring.
Its outer disk has a very red colour (Ryder & Dopita 1994)
and is H I deficient (Dahlem et al. 2001).
NGC4527: The H
image of NGC4527 by Lehnert & Heckman (1995)
shows no obvious signs of extraplanar emission. Instead, it
indicates that the disk is not inclined exactly edge-on. From
its optical axial ratio of 3 Tully (1988) derived an inclination
angle of about
 ,
which has been taken into account
in our representation of the radio emission from the disk in
Fig. 28 and which is the reason for removing
the object from the present sample.
,
which has been taken into account
in our representation of the radio emission from the disk in
Fig. 28 and which is the reason for removing
the object from the present sample.
NGC4700: NGC4700 was observed by us (Rossa 2001) and the resulting image
will be presented separately. Clear evidence for extraplanar
H
emission is visible in our frame; therefore the
corresponding entry was made in Table 6.
NGC5073: In the H
image of NGC5073 by Lehnert & Heckman (1995)
one can see little diffuse emission above the nuclear area and a
strong point source in the centre. Together with the unresolved
nuclear radio continuum source, this might hint at the presence
of a previously unclassified active nucleus, which could explain
why a high
f60/f100 flux ratio is observed and the radio
emission is unresolved by our data, while there is no indication
of a halo.
NGC7090 and NGC7462: Both galaxies were observed and extraplanar H
emission
clearly detected (Rossa 2001). These results will be presented
at a later time, together with those on NGC4700.
Resume:
The small number of H
detections is probably in most cases
due to sensitivity problems, because the images available in the
literature were not taken for dedicated searches of low surface
brightness extraplanar emission. Long integration times are
required for attempts to detect such emission.
Data existing in archives. ROSAT archival data exist for NGC1406, NGC2820, NGC4527; however, they do not contribute anything new to the current investigation. NGC1406 is detected, but unresolved; a by-eye inspection of the data reveals no detected emission from either NGC2820 or NGC4527.
Einstein observations of NGC1421 show weak emission from its disk, but also from a "tail'' to the south of the optically visible disk and also west of the nuclear area, thus perpendicular to the disk plane, where the extreme colour stretch used by Fabbiano et al. (1992) for the underlying optical image might suggest the presence of a stellar tidal arm.
Future observations. Of the present sample, Chandra observations of NGC1055 have been approved. We will obtain XMM-Newton Guaranteed Time observations of NGC1511 and NGC5073, which will be presented elsewhere in due course.
Considering all observations listed above of tracers of gaseous
halos, 6 out of the 11 galaxies presented here show signs of
extraplanar emission in at least one waveband. Different
components of the halo ISM in the target galaxies were detected
in four cases, as previously done in more nearby systems (see
e.g. Dahlem 1997). A list of the detection/non-detection of
extraplanar radio and H
emission is provided in
Table 6.
Thus, it appears that the existence of gaseous halos around late-type spiral galaxies is indeed not as uncommon as it appeared in the past. Rather, the search criteria are now optimised. Also the high detection rate by Irwin et al. (1999) of >90% fits into this scenario.
FIR brightness and in particular "warm'' FIR colours, i.e. high f60/f100 flux ratios, have turned out to be a very effective search criterion (Heckman et al. 1990; Lehnert & Heckman 1995). This is also born out by the fact that all FIR-warm nearby edge-on starburst galaxies studied by us previously in the soft X-ray regime (D98) exhibit diffuse extraplanar X-ray emission. A somewhat lower detection rate in the present sample can be expected, because we include here objects at larger distances and thus with lower flux densities and surface brightnesses than before. With values of in some cases 5-9 kpc (Table 4) also the spatial resolution of our data is not always sufficient yet.
As outlined by Dahlem (1997), several processes can contribute to the creation of gaseous halos around late-type spirals. In order to make sure that only star-formation related energy input is taken into account, galaxies with AGNs and closely interacting systems have been removed from the original sample above. Many starburst galaxies are interacting, or reversely, there is an overabundance of starbursts in interacting galaxies (cf. Hummel et al. 1990; Lutz 1992). In the case of distant encounters one can hope that the interaction has only caused minor disturbances of the gas in the galaxies, leading to the accretion of gas near their inner Lindblad resonance (Combes 1987) or turnover point of galactic rotation (Lesch et al. 1990) and subsequently to the onset of the observed starbursts, while the starbursts themselves dominate the energy balance at the time of the observation. This leaves galaxies that have high f60/f100 flux ratios because of SF-related heating of their dust, with approximately unperturbed gravitational potentials. SF-related heating sources are photo-ionisation, shocks and/or turbulent mixing layers, but in principle all energy comes from processes relating to the evolution of high-mass stars (winds and type II supernovae; Leitherer & Heckman 1995; Leitherer et al. 1999). The above points out that careful selection of candidates and interpretation of the results is crucial; too many free parameters would leave doubts about the source of the energy driving the gaseous halos. Based on the above selection, we are confident that halo emission detected in the remaining 11 galaxies of our sample arises from energy input into the ISM from high-mass stars and type II SNe.
Having ensured that SF dominates the energy input into the disk ISM, the next step in an investigation of a potential connection between halo properties and SF activity in the underlying disk is to quantify the level of energy input and the halo properties.
In earlier studies of halo properties (e.g. Hummel et al. 1991b; Dahlem et al. 1994; Dahlem et al. 1997) we have used z profiles averaged over a broad radial range to quantify the properties of radio halos. This has the advantage of increasing the signal-to-noise ratio compared to a single-pixel profile. At the same time, data are only averaged over regions where emission in the halo has clearly been detected, adapting the measurements to the individual target's geometry.
Ellipsoidal fitting to radio images, as performed by Irwin et al. (1999) makes sense under the assumption that radio halos are
engulfing their host galaxies. However, this is not observed
in images with sufficient angular resolution. Images that might
suggest such behaviour (like, for example, our 1.43 GHz map of
NGC1511 in Fig. 4) often suffer from insufficient
angular resolution. Instead, with good resolution, a behaviour
as described by us earlier (DLG95)
is observed in most galaxies: radio halos exist only above the
brightest emission regions of the underlying galaxy disks, i.e.
the active SF regions. The radial extent of the halos is similar
to the radius out to which SF is observed,
 ,
and thus
smaller than that of the entire disks. This is evident in our new
1.43 GHz and 2.45 GHz images of NGC7090 (Fig. 13).
Supporting evidence for this result comes from recent H
observations by Rossa & Dettmar (2000). Ellipses do not fit the
geometry of the halo plus disk emission properly. We find that
the most reliable technique to detect and quantify extraplanar
emission is by producing averaged z profiles.
,
and thus
smaller than that of the entire disks. This is evident in our new
1.43 GHz and 2.45 GHz images of NGC7090 (Fig. 13).
Supporting evidence for this result comes from recent H
observations by Rossa & Dettmar (2000). Ellipses do not fit the
geometry of the halo plus disk emission properly. We find that
the most reliable technique to detect and quantify extraplanar
emission is by producing averaged z profiles.
Based on radio data of the nearby edge-on galaxies NGC891 and
NGC4631, and - with less detailed information - on a few other
galaxies, we started investigating whether such a dependence
exists (DLG95). As a measure of the energy input into the disk ISM
per unit time,  ,
we used the nonthermal radio continuum
emission produced by type II SNe. In order to obtain a good
measure of the energy density in a given volume within the
galaxy disk, the area over which energy input by active SF
takes place,
,
we used the nonthermal radio continuum
emission produced by type II SNe. In order to obtain a good
measure of the energy density in a given volume within the
galaxy disk, the area over which energy input by active SF
takes place,
 ,
was quantified by us. Determining
from radial profiles of the radio continuum emission distribution
in the disk a cut-off radius of SF processes,
,
we calculated, adopting circular symmetry,
,
as
the circular area within the disk of the galaxies over which
SF-related energy production occurs, following the simple
relation
,
was quantified by us. Determining
from radial profiles of the radio continuum emission distribution
in the disk a cut-off radius of SF processes,
,
we calculated, adopting circular symmetry,
,
as
the circular area within the disk of the galaxies over which
SF-related energy production occurs, following the simple
relation
 .
can be determined equally well from the radial distribution
of radio continuum emission in the disk.
Data of in total 9 galaxies indicated a trend that those galaxies
with the highest energy injection rates,
.
can be determined equally well from the radial distribution
of radio continuum emission in the disk.
Data of in total 9 galaxies indicated a trend that those galaxies
with the highest energy injection rates,
 ,
per unit time and unit surface area, have the most prominent
radio halos (DLG95). Below a certain energy input level no outflows
are enabled and galaxies thus do not exhibit extraplanar radio
emission.
Similar results were reached by Rand (1996) and Meurer et al.
(1995, 1997), based on data from other wavebands. A possible
link between high energy input rates into the disk ISM and the
existence of soft X-ray halo emission is discussed by Ehle
et al. (1998) and Dahlem et al. (1998).
,
per unit time and unit surface area, have the most prominent
radio halos (DLG95). Below a certain energy input level no outflows
are enabled and galaxies thus do not exhibit extraplanar radio
emission.
Similar results were reached by Rand (1996) and Meurer et al.
(1995, 1997), based on data from other wavebands. A possible
link between high energy input rates into the disk ISM and the
existence of soft X-ray halo emission is discussed by Ehle
et al. (1998) and Dahlem et al. (1998).
The remaining 11 galaxies in the present sample can also be
studied for such a dependence. The relevant properties are
listed in Table 7.
We use as a measure of
the beam-deconvolved
radial extent of the 1.43 GHz radio continuum emission from
our current observations. We limit our studies here to the
global energy input as a measure of which we will use the
total FIR luminosity
 ,
as done by Rossa &
Dettmar (2000).
Based on the total FIR flux, FIR, following the relation
FIR =
,
as done by Rossa &
Dettmar (2000).
Based on the total FIR flux, FIR, following the relation
FIR =
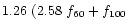 ), we calculate
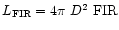 .
.
 is the FIR luminosity normalised per unit surface area of the
star-forming part of the disk, representing the energy input
rate (
), as defined similarly by us based
on radio surface brightnesses (DLG95). This quantity is used
as a measure of the global rate of energy injection into the
ISM via SF-related processes (stellar winds and type II
supernovae), see Col. 7 in Table 7.
is the FIR luminosity normalised per unit surface area of the
star-forming part of the disk, representing the energy input
rate (
), as defined similarly by us based
on radio surface brightnesses (DLG95). This quantity is used
as a measure of the global rate of energy injection into the
ISM via SF-related processes (stellar winds and type II
supernovae), see Col. 7 in Table 7.
 ,
finally, is the exponential scale height of
the radio halos from Table 4.
,
finally, is the exponential scale height of
the radio halos from Table 4.
Rossa & Dettmar (2000) have made further progress in another
direction, plotting the
f60/f100 flux ratio vs. the
total FIR luminosity (as a measure of )
normalised by
the disk surface area,
 (in particular,
their Fig. 13), where they find a clear distinction between
quiescent and starburst galaxies.
All galaxies classified as starbursts by their location in the
f60/f100 vs.
plot (their Fig. 13)
have detections of H
emission from extraplanar diffuse
ionised gas (eDIG). Compared to DLG95, the FIR luminosity,
,
substitutes the radio luminosity to represent
the level of energy injection, .
As a first approximation, Rossa & Dettmar use in their
determination of the surface area of the energy input the
25th magnitude isophotal diameter, D25. For the
galaxies with wide-spread SF over their disks as used in
their sample, this approximation is acceptable.
However, in other cases-especially the classic starburst
galaxies with circumnuclear activity-the use of D25 can
lead to serious errors: systems like, e.g., NGC1808 actively
form stars over a much smaller area than their disks out to
D25 (e.g., Dahlem et al. 1990). In the present sample
NGC3175 is such a case. While its D25 is 5', the
diameter of the star-forming part of its disk can be determined
(from H
and radio continuum images; see Condon et al.
1996; Ryder & Dopita 1994) very reliably to be only 90''
(7 kpc). Thus, using D25 would lead to an over-estimate of
the surface area over which its energy input is distributed, by
a factor of 11.1 and thus underestimate the energy density in
the disk by the same factor. In these cases one must determine
the area over which SF takes place more accurately, by using
and
instead.
(in particular,
their Fig. 13), where they find a clear distinction between
quiescent and starburst galaxies.
All galaxies classified as starbursts by their location in the
f60/f100 vs.
plot (their Fig. 13)
have detections of H
emission from extraplanar diffuse
ionised gas (eDIG). Compared to DLG95, the FIR luminosity,
,
substitutes the radio luminosity to represent
the level of energy injection, .
As a first approximation, Rossa & Dettmar use in their
determination of the surface area of the energy input the
25th magnitude isophotal diameter, D25. For the
galaxies with wide-spread SF over their disks as used in
their sample, this approximation is acceptable.
However, in other cases-especially the classic starburst
galaxies with circumnuclear activity-the use of D25 can
lead to serious errors: systems like, e.g., NGC1808 actively
form stars over a much smaller area than their disks out to
D25 (e.g., Dahlem et al. 1990). In the present sample
NGC3175 is such a case. While its D25 is 5', the
diameter of the star-forming part of its disk can be determined
(from H
and radio continuum images; see Condon et al.
1996; Ryder & Dopita 1994) very reliably to be only 90''
(7 kpc). Thus, using D25 would lead to an over-estimate of
the surface area over which its energy input is distributed, by
a factor of 11.1 and thus underestimate the energy density in
the disk by the same factor. In these cases one must determine
the area over which SF takes place more accurately, by using
and
instead.
Figure 38 corresponds with Figs. 11 and 12 by Rossa
& Dettmar (2000). It displays the
f60/f100 FIR flux
ratio (thus a measure of the mean dust temperature) vs. the
total FIR luminosity, normalised with the area in which active
SF is taking place. In this logarithmic plot all galaxies occupy
the upper right-hand quadrant where, according to Rossa & Dettmar
(2000) the starburst galaxies fall. Based on our selection criteria
the bottom left-hand corner of the plot is empty; there are no
quiescent galaxies in the sample.
Amongst the galaxies plotted in Fig. 38 a trend is
visible that the galaxies with the highest
values have the highest
f60/f100 flux ratios and thus
mean dust temperatures.
| Galaxy |
 |
|
|
FIR |
|
 |
 |
| (''/kpc) | (103 kpc2) | (10-14 W m-2) | (1043 erg s-1) | (1040 erg s-1 kpc-2) | (kpc) | ||
| NGC1055 | 0.34 | 236/18.3 | 1.06 | 135.85 | 4.16 | 3.94 | -- |
| NGC1406 | 0.44 | 110/ 7.9 | 0.20 | 72.74 | 1.93 | 9.75 | 1.66 |
| NGC1421 | 0.40 | 145/21.9 | 1.50 | 54.43 | 6.30 | 4.20 | -- |
| NGC1511 | 0.62 | 73/ 6.2 | 0.12 | 124.81 | 4.57 | 38.08 | 1.76 |
| NGC2748 | 0.39 | 103/14.3 | 0.65 | 45.54 | 4.49 | 6.96 | -- |
| NGC3175 | 0.46 | 45/ 3.5 | 0.04 | 78.02 | 2.36 | 62.11 | 1.62 |
| NGC3437 | 0.57 | 96/11.9 | 0.48 | 62.77 | 4.88 | 10.92 | -- |
| NGC3717 | 0.44 | 177/23.3 | 1.71 | 60.24 | 5.29 | 3.09 | -- |
| NGC4700 | 0.57 | 54/ 6.6 | 0.14 | 16.67 | 1.30 | 9.35 | 3.06 |
| NGC7090 | 0.33 | 131/ 7.4 | 0.17 | 41.76 | 0.68 | 3.93 | 1.77 |
| NGC7462 | 0.49 | 103/ 7.5 | 0.18 | 18.07 | 4.93 | 27.54 | 1.82 |
| NGC1569 | 0.96 | 72/0.77 | 0.00186 | 207.20 | 0.12 | 64.50 | -- |
The new result of our investigation is that in 6 out of 11 objects
radio halo emission has been detected (open squares). There is a
clear trend that halos were detected in those galaxies with the
highest
and
f60/f100 values, with the
notable exception of NGC3437, which was discussed above.
We have selected highly inclined galaxies only for technical
reasons. The fact that most, if not all FIR-warm edge-on
galaxies have radio halos should apply to galaxies with any
inclination angle. We just need to develop tools to find
them in more face-on systems.
We have produced the same kind of plot as Fig. 38 based on the total 1.43 GHz radio continuum flux density, as
listed in Table 3, which is presented in
Fig. 39. The total 1.43 GHz radio luminosity
was calculated using the equation
 ,
neglecting the term
,
neglecting the term
 ,
because it
is not relevant for the low-redshift galaxies studied here
(Condon et al. 1990).
Because of the strong radio-FIR correlation the two plots look
almost identical, although the positions of individual galaxies
can shift with respect to their location in Fig. 38.
This similarity of the two plots-and thus relations between
luminosity and dust temperature-makes our present study and
the results by Rossa & Dettmar (2000) comparable to our
earlier investigations (DLG95). As in Fig. 38,
the data points in Fig. 39 also indicate a
trend of the galaxies with the highest
values having the highest mean dust temperatures.
,
because it
is not relevant for the low-redshift galaxies studied here
(Condon et al. 1990).
Because of the strong radio-FIR correlation the two plots look
almost identical, although the positions of individual galaxies
can shift with respect to their location in Fig. 38.
This similarity of the two plots-and thus relations between
luminosity and dust temperature-makes our present study and
the results by Rossa & Dettmar (2000) comparable to our
earlier investigations (DLG95). As in Fig. 38,
the data points in Fig. 39 also indicate a
trend of the galaxies with the highest
values having the highest mean dust temperatures.
A second important result is that all physically small galaxies
(with
 kpc; in the present sample NGC1511,
NGC4700, NGC7090 and NGC7462) have prominent radio halos.
Their total mass being low, it appears to be easier for CR
electrons to escape from the thin disk than in galaxies with
higher total masses,
kpc; in the present sample NGC1511,
NGC4700, NGC7090 and NGC7462) have prominent radio halos.
Their total mass being low, it appears to be easier for CR
electrons to escape from the thin disk than in galaxies with
higher total masses,
 .
Even NGC7090, with a moderate
mean dust temperature and also a correspondingly moderate energy
injection rate (
;
note that NGC1055 and
NGC7090 have almost equal values, see Table 7),
can produce a radio halo. Radio halos are visible, because these
galaxies are no dwarfs (in which case they might be too light to
retain their magnetic fields so that CRs might escape almost
loss-free and thereby remain invisible), but intermediate-mass
systems.
.
Even NGC7090, with a moderate
mean dust temperature and also a correspondingly moderate energy
injection rate (
;
note that NGC1055 and
NGC7090 have almost equal values, see Table 7),
can produce a radio halo. Radio halos are visible, because these
galaxies are no dwarfs (in which case they might be too light to
retain their magnetic fields so that CRs might escape almost
loss-free and thereby remain invisible), but intermediate-mass
systems.
We note here that the simplifying assumption has been made that all energy contained in CR electrons emitting synchrotron radiation originally arises from the galaxy disks. Lacking images showing details, such an assumption must be made, without any distinction as to where the radio continuum emission comes from. The same assumption is made for the FIR data too (not only by us, but also by Rossa & Dettmar 2000 and other investigators).
Based on a larger sample, Irwin et al. (1999) did not find
a connection between the properties of gaseous halos and the
global level of underlying SF activity, using radio continuum
images. However, these authors did not distinguish
between different object classes contained in their sample due to the small number of galaxies in total.
From their sample, NGC3735 and NGC4388 should be excluded,
because they host Sy-2 nuclei (NED). The existence of a
radio halo in NGC3432, despite its low energy injection rate,
can be explained because it is a magellanic irregular with low
total mass and thus shallow gravitational potential, similar to
the small galaxies in our sample. In addition, NGC3432 is
closely interacting and should therefore be removed from the
sample for studies of the dependence of halo properties on the
level of underlying SF activity in the galaxy disk. NGC5433
and IC562 from the sample by Irwin et al. (1999) should be
excluded, as we did above with NGC5073 and NGC7541, because
their emission distribution is not resolved by the data. Once
this target selection is applied, we do see a trend in the data
by Irwin et al. (1999) suggesting that the galaxies with the
highest
values have halos, while those with lower
energy input levels do not always have halos. Therefore, there
is no contradiction in the data by these authors to our hypothesis
from the paper by DLG95. Instead, their data support our claim,
as do our new results presented here, that late-type spiral
galaxies with warm dust do have gaseous halos and that those
with the most active SF tend to have the most prominent halos.
 and
and
 ?
?
However, trying to go one step further, we find that there is
clearly no direct quantitative relationship between the
halo scale height,
,
and the normalised energy
input,
,
as listed in Table 7.
In our earlier sample (DLG95) we presented only L* galaxies,
i.e. systems near the "knee'' of the galaxy luminosity function,
with total masses somewhere on the order of
 .
There, we found a trend that galaxies with the highest SF rates
in their disks have the most prominent halos and that the halos
are brightest above the most actively star-forming regions.
.
There, we found a trend that galaxies with the highest SF rates
in their disks have the most prominent halos and that the halos
are brightest above the most actively star-forming regions.
The present sample, as indicated above, contains a number of physically small galaxies as well as L* galaxies. This implies that, compared to our earlier study (DLG95), an additional free parameter has entered the equation, namely the different resistence that particles meet when expelled from their birth sites in the disks.
We have therefore tried to normalise the energy input rate
not only by the area over which it is distributed, but also
by the gravitational potential of the galaxy as measured by
the total mass. Also for this quantity we have found no
convincing correlation with
.
This implies
that yet more, or other, factors affect the propagation of
CRs out of galaxy disks.
In particular, the energy losses that CR electrons undergo
on their way out of the disk influence the properties of
the observed radio halos:
Although predicting different kinds of behaviour, both
static and dynamic models of CR radio halos (Lerche &
Schlickeiser 1981a-c; Werner 1988) predict a dependence
of the extent of radio halos on the mean lifetime of
the CR electrons. In case of pure diffusive CR propagation
the dependence is directly proportional to the diffusion
index of the CRs. The influence of convection is expected
to increase with increasing energy input. However, at the
same time inverse Compton losses become more important
with increasing energy input too. This is the reason why
no direct dependence is found between the measured scale
heights and the level of energy input in the underlying
disks.
Significant energy losses of the CR electrons leaving the disk are in agreement with the observed slight steepening of the radio spectral indices (Sect. 3.3).
 vs. radial halo extent
Based on images with sufficient spatial resolution a direct
morphological comparison can be made, as done by us earlier
(DLG95), of the radial extent of the radio halo with respect
to the radial extent of the actively star-forming part of
the disk,
.
We had found in our previous sample
that the radio halo emission breaks off radially near the
point where the surface brightness in the disk drops rapidly,
i.e.
.
This implies that halo emission is observed only above
the most actively star-forming parts of the galaxy disks. In
the present sample, the ATCA data have the highest angular
resolution. The effect is visible most clearly in NGC7090,
and also-though to a lesser degree-in NGC7462 (here
especially at 2.45 GHz, where the angular resolution is highest).
Higher resolution is required to study the same effect in the
galaxies observed with the VLA D array, especially in cases
like NGC4700 (cf. Fig. 11). In the case of
NGC3175 the data by Condon et al. (1996) suggest the same
behaviour. The extraplanar radio emission is restricted to the
radial regime of the central starburst. More details on this
will be presented elsewhere.
Despite the relatively good spatial resolution of our data, NGC1511, with its very smooth emission distribution, shows little of this effect. It comes closest to the ellipsoidal emission distribution that might be expected in case of purely diffusive particle propagation.
Copyright ESO 2001
![\begin{figure}
\par\includegraphics[width=8.6cm,clip]{H2604f38.ps}\par\end{figure}](/articles/aa/full/2001/28/aah2604/img165.gif)
![\begin{figure}
\par\includegraphics[width=8.6cm,clip]{H2604f39.ps}\end{figure}](/articles/aa/full/2001/28/aah2604/img166.gif)