A&A 374, 83-91 (2001)
DOI: 10.1051/0004-6361:20010691
D. Bettoni1 - G. Galletta2 - F. Prada3
1 - Osservatorio Astronomico di Padova, Vicolo dell'Osservatorio 5, 35122 Padova, Italy
2 -
Dipartimento di Astronomia, Università di Padova, Vicolo dell'Osservatorio 2, 35122 Padova, Italy
3 -
Centro Astronómico Hispano-Alemán, Apartado 511, 04080 Almería, Spain
Received 6 February 2001 / Accepted 23 April 2001
Abstract
In this paper we present a statistical study of the environments of 49
galaxies in which there is gas- or stellar-counterrotation. The
number of possible companions in the field (to apparent magnitude 22),
their size and concentration were considered. All the statistical
parameters were analysed by means of Kolgomorov-Smirnov tests,
using a control sample of 43 galaxies without
counterrotation. From our data, no significant differences between the
counter-rotating and control samples appear. This is different to
Seyfert or radio-loud galaxies which lie in environments with a higher
density of companions. On the contrary, if a weak tendency exists,
for galaxies with gas counterrotation only, it is discovered in
regions of space where the large scale density of galaxies is
smaller. Our results tend to disprove the hypothesis that
counterrotation and polar rings derive from a recent interaction with
a small satellite or a galaxy of similar size. To a first
approximation, they seem to follow the idea that all galaxies are
born through a merger process of smaller objects occurring very
early in their life, or that they derive from a continuous,
non-traumatic infall of gas that formed stars later. Whatever the
special machinery is which produces counterrotation or polar rings
instead of a co-planar, co-rotating distribution of gas and stars,
it seems not to be connected to the present galaxy density of their
environments.
Key words: galaxies: evolution - galaxies: formation - galaxies: interactions - galaxies: peculiar
A different result has been found by analysing the environment of other galaxy categories, whose peculiar origin has been connected in the literature to galactic interactions or mergers (Gunn 1979), similar to polar rings. In particular, the environment of Seyfert galaxies appears to be richer in physical companions than that of normal galaxies (Dahari 1984; Rafanelli et al. 1995). Similarly, the local galaxy density of 47 radio-loud elliptical and lenticular galaxies appears higher than that of radio-quiet galaxies by a factor 2-3 (Heckman et al. 1985). Even radio-loud QSO with 0.9<z<1.5 appear surrounded by a statistically significant excess of galaxies (Hintzen et al. 1991). Among these peculiar environments, the apparent normality of polar ring galaxies looks anomalous and distinguishes them from the other categories of astronomical objects whose peculiarity or activity is ascribed to interaction or merger. Therefore, we wish to see if other types of peculiar galaxies have an environment similar to that of the active galaxies or if they are "normal'' in this respect, as the polar ring galaxies appear to be.
In this paper, the environment of another category of peculiar
galaxies, in which the rotation of the gas or of the stars is opposite
to that of most of the stars in the galaxy, is analysed. This
phenomenon, known as "counterrotation'', presents a variety of aspects:
it may be present in the gas only (Bettoni 1984; Caldwell et al. 1986; Galletta 1987; Ciri et al. 1995), in a portion of the stars (Bender 1988; Franx 1988; Jedrzejewski & Schecther 1988; Bettoni 1989; Rubin et al. 1992; Merrifield and Kuijken 1994; Prada et al. 1996, 1999) or in both (Bertola et al. 1996; Galletta 1987). The existing observations suggest that counterrotation is a phenomenon which is present all along the Hubble sequence.
As in the case of polar ring galaxies, the origin of the
counterrotation has been attributed to different mechanisms. One of
these is the collision between the accretor galaxy and a small
satellite (Kennicut 1996; Thakar & Ryden 1996). The difference to the formation
of a polar ring may reside in the satellite orbit, coplanar with the
disk of the accretor (and retrograde) to generate counterrotation
(Thakar & Ryden 1996). Another mechanism may be the merger of two
spirals of unequal mass (Balcells & Gonzalez 1998; Bekki 1998), which is able to
transfer matter as large as 108 ![]() or more in counterrotation
(Bettoni et al. 1991; Rubin et al. 1992; Ciri et al. 1995; Bettoni et al. 1999). A third alternative
involves an extended period of star- or gas-infall
during which the spin of the accreted matter changes rapidly
(Voglis et al. 1991; Quinn & Binney 1992; Merrifield & Kuijken 1994; Ostriker & Binney 1989; Rix et al. 1992).
or more in counterrotation
(Bettoni et al. 1991; Rubin et al. 1992; Ciri et al. 1995; Bettoni et al. 1999). A third alternative
involves an extended period of star- or gas-infall
during which the spin of the accreted matter changes rapidly
(Voglis et al. 1991; Quinn & Binney 1992; Merrifield & Kuijken 1994; Ostriker & Binney 1989; Rix et al. 1992).
If counterrotation arises from accretion of a satellite galaxy, there should be some peculiarity in the environment of these galaxies that may be detectable in the present epoch, as happens in Seyfert or radio-loud galaxies. Possibilities include: 1) a local over-density of galaxies or 2) a larger number of satellites if the accretion event occurred recently. A trace of the satellite accretion may also remain if the phenomenon is not recent; for instance, a deficit of satellites due to depletion of the environment may differentiate them from a normal population. Finally, if the counterrotation is generated by pure gas, pure star infall or by a merger in the early epoch of galaxy formation, no traces of differences should exist in the present surrounding field.
The first step in this work was to select a sample of galaxies with counterrotation and, as wide as possible, a comparison sample of "normal'' galaxies. The latter should be representative of galaxies without counterrotation but with distributions of luminosity and morphological type similar to that of the galaxies with counterrotation. This selection required a short analysis of the samples.
Our initial selection from the literature included all known examples of gas or stellar counterrotation. For this selection the compilations of Galletta (1996) and Corsini & Bertola (1998) were used. We removed from the lists a few doubtful examples and those with still unpublished references. These included NGC 2217, with a polar ring seen almost face-on (Bettoni et al. 1990) and NGC 4684, with gas streams along a pole-on bar (Bettoni et al. 1993) that mimic gas counterrotation. At the end of this selection, our working list contained 49 galaxies, whose names are indicated in the first column of Table 2. They have been divided according to the kind of counterrotation present. Four systems show both kinds of counterrotation and have been considered separately in the statistical analysis. They include IC 4889 = IC 4891, NGC 3593, NGC 4550 and NGC 7079. In the following, the label "gas cr'' or "stars cr'' refer only to the pure cases of gas and star counterrotation, while "all cr'' or "cr galaxies'' indicates both samples plus these four galaxies.
The mean astrophysical parameters of these galaxies have been obtained from the Lyon-Meudon Extragalactic Database (Paturel et al. 1997). They are apparent and absolute magnitudes, radial velocity and morphological type.
In order to prepare a comparison sample, we made an initial list of galaxies for which both gas and star rotation curves were published. The principal source for this list was the Catalogue of Spatially Resolved Kinematics of Galaxies (Prugniel et al. 1998) that is available on the web. The published rotation curves for each galaxy in the list was analysed, in order to determine the data-supported co-rotation for the stars and gas. The comparison sample also includes galaxies studied by Kuijken et al. (1996), where the authors claim that no counter-rotating cores have been detected.
This list contains a high percentage of spirals, whereas galaxies with
counterrotation mostly have morphological types earlier than Sa. This
may alter the comparison between samples, with spiral galaxies
generally being present in a lower density environment. To minimize
this difference, we extracted from the initial list of comparison
galaxies a sub-sample with a distribution of morphological types
similar to that of galaxies with counterrotation. This sub-sample was
checked to exclude the presence of other biases in their general
properties, applying a Kolgomorov-Smirnov test to their distributions
of absolute magnitudes MB, red-shift and morphological type. To
this end, we determined the cumulative frequency distribution S(X)for each sample of observations by using the same interval for both
distributions. S(X) is the fraction of data observed equal to or
less than X. Then, for each interval we subtracted one step function
from the other, evaluating
![]() which is
the maximum absolute difference found for the two distributions. The
probability of the two samples having the calculated
which is
the maximum absolute difference found for the two distributions. The
probability of the two samples having the calculated ![]() and
coming from different galaxy populations is estimated by means of the
theoretical significance level SL, which is a function of the sizes of
the samples and is tabulated in statistical books. Comparing various
sub-samples of comparison galaxies we found one whose distribution of
intrinsic properties is not significantly different, at a confidence
level of
and
coming from different galaxy populations is estimated by means of the
theoretical significance level SL, which is a function of the sizes of
the samples and is tabulated in statistical books. Comparing various
sub-samples of comparison galaxies we found one whose distribution of
intrinsic properties is not significantly different, at a confidence
level of ![]() ,
from that of all the cr galaxies (see Table 1). All the SL values calculated on the basis of the
corresponding
,
from that of all the cr galaxies (see Table 1). All the SL values calculated on the basis of the
corresponding ![]() are lower than this value.
are lower than this value.
| gas cr vs. no cr | star cr vs. no cr | all cr vs. no cr | ||||||
| Parameter | SL | SL | SL | |||||
| Morphological Type | 0.344 | 92.3% | 0.220 | 57.1% | 0.240 | 84.2% | ||
| MB | 0.244 | 60.7% | 0.152 | 13.5% | 0.170 | 44.2% | ||
| Red-shift | 0.314 | 86.6% | 0.193 | 40.0% | 0.222 | 77.1% | ||
| N. members (Garcia et al. 1993) | 0.175 | <10% | 0.157 | <10% | 0.133 | <10% | ||
| N. members (Tully 1987) | 0.218 | 22.9% | 0.034 | <10% | 0.118 | <10% | ||
| Group velocity dispersion (Tully 1987) | 0.096 | <10% | 0.112 | <10% | 0.058 | <10% | ||
An independent test of the quality of this comparison sample
concerns the large scale environment in which these galaxies are
located with respect to that of the cr galaxies. We then checked each
galaxy for which kind of environment it belongs to: field,
small groups and large clusters. This classification was made
for galaxies with red-shift ![]() 3000 kms-1 by Tully (1987) who
indicates for each one the richness and the velocity dispersion of
the group to which it belongs. The group richness is also available
for galaxies brighter than magnitude 14 and with red-shift lower than
5500 kms-1 (Garcia et al. 1993).
3000 kms-1 by Tully (1987) who
indicates for each one the richness and the velocity dispersion of
the group to which it belongs. The group richness is also available
for galaxies brighter than magnitude 14 and with red-shift lower than
5500 kms-1 (Garcia et al. 1993).
These data show that the galaxies with counterrotation are present in all kinds of environments, discovered both in clusters as rich as Virgo as well in regions of the sky apparently empty of companions. The distributions of richness and group velocity dispersion show a large spread of values, without any tendency for clustering of data at particular values. As performed for the absolute magnitudes and morphological types, a Kolgomorov-Smirnov test was applied to the samples (see Table 1) and indicates that the differences between galaxies with counterrotations and the comparison sample are not significant.
These tests defined the final list for the comparison galaxies that was used in the following sections as a reference sample of normal galaxies. It is shown in the first column of Table 3 and contains 43 galaxies.
To study the properties of the visible environment of these galaxies, we searched all the objects present in the sky around every galaxy, starting from the optical image databases available in the literature. Our research was focused along different lines:
The first search was performed by adopting a searching radius of 100 kpc
and looking at all the objects present within that radius. The search
was performed by extracting the data from the APM Sky Catalogue,
available for Internet access from the Observatory of Edinburgh
(Irwing et al. 1994). It contains data extracted by scanning and
photometrically calibrating the B and R plates of the Palomar Sky
Survey and the ESO/SRC J survey. It lists all the objects present in
the plates over the brightness level of 24 magarcsec-2 for the blue plates
and 23 magarcsec-2 for the red plates. They correspond to a limiting apparent
magnitude B=21.5 and R=20.0. For each object present in a field
corresponding to 100 kpc at the distance of the central galaxy, we
extracted the following parameters: ![]() and
and ![]() co-ordinates,
B and R apparent magnitudes, semi-major axis, ellipticity and PA of
the ellipse fitting the image. In APM, galaxies are distinguished from
stars by means of a comparison of their Point Spread Function with
that of an "average'' stellar image.
co-ordinates,
B and R apparent magnitudes, semi-major axis, ellipticity and PA of
the ellipse fitting the image. In APM, galaxies are distinguished from
stars by means of a comparison of their Point Spread Function with
that of an "average'' stellar image.
For most of the objects in the field the true distance is unknown, so
we adopted the following method to discard background and foreground
objects: all the parameters extracted from APM were converted in
distance from the central galaxy (kpc), absolute magnitude and linear
size (kpc) as if all the objects were at the same distance as the
central galaxy. We expected that many background galaxies would appear
with a linear size or magnitude too small to be real
companions. Similarly, eventual foreground galaxies would appear too
big. The limits taken to keep a galaxy were from 2 to 50 kpc for the
size and from MB=-14 to MB=-23. These figures have been chosen
as typical mean size and luminosity of the galaxies, taken from the
Local Group members (Zombeck 1990; Sandage & Tamman 1981) and from the Revised
Shapley-Ames Catalog (Sandage & Tamman 1981). A limit of this method is given
by the fact that galaxies intrinsically fainter than MB=-14 do
exist, e.g. Leo I, whose absolute magnitude is MB=-9.6(Sandage & Tamman 1981). It is clear that a more relaxed limit, for instance
![]() ,
may include all the possible dwarf galaxies in the
surroundings of the central galaxy but will surely fill the sample of
nearby objects with a large number of background galaxies. After a
set of tests with nearby central galaxies, we chose to limit the sample
at MR=-14, bearing in mind that for fainter limits the possibility
of contamination by background objects is higher than the chances of
excluding possible dwarfs. Based on the distances of the central
object, we computed that an object of MB=-14 with apparent Bmagnitudes should always appear brighter than the APM detection limits
both for counterrotation and normal galaxy fields. For this reason,
we are confident that most of the faint objects around the sample
galaxies are present in our search.
,
may include all the possible dwarf galaxies in the
surroundings of the central galaxy but will surely fill the sample of
nearby objects with a large number of background galaxies. After a
set of tests with nearby central galaxies, we chose to limit the sample
at MR=-14, bearing in mind that for fainter limits the possibility
of contamination by background objects is higher than the chances of
excluding possible dwarfs. Based on the distances of the central
object, we computed that an object of MB=-14 with apparent Bmagnitudes should always appear brighter than the APM detection limits
both for counterrotation and normal galaxy fields. For this reason,
we are confident that most of the faint objects around the sample
galaxies are present in our search.
A problem to be faced in using the APM data is that the large galaxies present in the field, especially if belonging to late morphological types, appear fragmented in a set of small extended objects, reducing their contribution to the local population of galaxies extracted from APM. For this reason, we had to look at all the fields by plotting the position and size of the objects present around the central galaxies and we compared this map with the image of the same field extracted from Palomar or ESO/SRJ atlases. When a galaxy is not included in the APM catalogue, we extracted its position and size from other catalogues and inserted it in our files. At the end of this correction, our set of data contained 40 galaxies with counterrotation and 38 comparison galaxies, some systems not being present in the APM catalogue. There are 16 galaxies with pure gas counterrotation, whereas 20 systems exhibit pure stellar counterrotation. Four galaxies have both types of counterrotation.
A second search concerned the detection of bright galaxies that may
have been gas or star donors during a close encounter. In this case
the search area has been defined in a different way: assuming that a
companion galaxy exists which may have encountered the central galaxy
in the past, its linear distance will be
![]() ,
,
![]() being the relative velocity in space and
being the relative velocity in space and ![]() t
the time elapsed since the encounter. If we assume a typical maximum
value
t
the time elapsed since the encounter. If we assume a typical maximum
value
![]() kms-1 and a maximum elapsed time of 1 Gyr, the
maximum projected angular distance between the two galaxies seen at a
distance d will be
kms-1 and a maximum elapsed time of 1 Gyr, the
maximum projected angular distance between the two galaxies seen at a
distance d will be
![]() [Mpc], which was our
search radius. This corresponds to a linear distance of 0.61 Mpc. We then searched galaxies within a radius of 0.61 Mpc from the
central galaxy and having red-shift difference cz lower than 600 kms-1
with respect to it.
[Mpc], which was our
search radius. This corresponds to a linear distance of 0.61 Mpc. We then searched galaxies within a radius of 0.61 Mpc from the
central galaxy and having red-shift difference cz lower than 600 kms-1
with respect to it.
This time we used the NED database, extracting position, red-shift,
apparent magnitude and size of every listed galaxy lying on the sky
inside ![]() and having
and having
![]() kms-1 .
These data were converted into distances from the
central galaxy, differences in radial velocity, absolute magnitudes
and linear sizes. In this search, only galaxies with known redshift
were included in the sample. The final set of data includes 47 galaxies with counterrotation (18 gas cr, 25 star cr, 4 mixed) and 42 galaxies of the comparison sample. The excluded objects have too wide a field (such as NGC 253, with 14
kms-1 .
These data were converted into distances from the
central galaxy, differences in radial velocity, absolute magnitudes
and linear sizes. In this search, only galaxies with known redshift
were included in the sample. The final set of data includes 47 galaxies with counterrotation (18 gas cr, 25 star cr, 4 mixed) and 42 galaxies of the comparison sample. The excluded objects have too wide a field (such as NGC 253, with 14
![]() 6 of search field) or have no
published red-shift (e.g. NGC 2612).
6 of search field) or have no
published red-shift (e.g. NGC 2612).
In addition to our data, we also used density values present in the
literature and computed on a much wider scale. We extracted from the
Nearby Galaxies Catalog (Tully 1988) the values of
![]() ,
the density of galaxies brighter than -16 mag determined within 40 Mpc
using a grid of 0.5 Mpc.
,
the density of galaxies brighter than -16 mag determined within 40 Mpc
using a grid of 0.5 Mpc.
To have a direct comparison with our data, a "galaxy density'' from APM
and NED data was calculated. In the first case, the total number
of observed faint objects within 100 kpc has produced
![]() ,
the projected density of faint galaxies in units of Mpc-2. The area
of 1 Mpc2 is merely an arbitrary choice to plot the data and
produce large numbers. In the second case, the NED data were used to
produce a
,
the projected density of faint galaxies in units of Mpc-2. The area
of 1 Mpc2 is merely an arbitrary choice to plot the data and
produce large numbers. In the second case, the NED data were used to
produce a
![]() ,
in galaxies/Mpc3, corresponding to
the mean density of bright objects with known redshift present in a
sphere of volume 0.95 Mpc3, whose radius is the distance covered at a
velocity of 600 kms-1 in 1 Gyr.
,
in galaxies/Mpc3, corresponding to
the mean density of bright objects with known redshift present in a
sphere of volume 0.95 Mpc3, whose radius is the distance covered at a
velocity of 600 kms-1 in 1 Gyr.
The values so determined from our data are listed in the last columns
of Tables 2 and 3 and are plotted in the two panels of
Fig. 1 versus
![]() .
.
| Name | APM data | NED data | galaxy densities | ||||||||||||||
|
|
|
|
|
|
|||||||||||||
| gas cr | |||||||||||||||||
| ESO 263-G48 | 1 | 0.168 | 0.084 | 0.014 | 0.000 | 0.000 | 1 | ||||||||||
| IC 2006 | 14 | 1.347 | 4.680 | 0.412 | 0.028 | 0.014 | 15 | ||||||||||
| NGC 128 | 3 | 0.264 | 15.538 | 1.220 | 0.568 | 1.328 | 10 | 1.842 | 17.609 | 2.354 | 1.677 | 5.188 | 11 | 100 | |||
| NGC 253 | 0 | 0.000 | 0.000 | 0.000 | 0.000 | 0.000 | 0.22 | 0 | |||||||||
| NGC 497 | 5 | 0.363 | 6.457 | 0.483 | 0.061 | 0.034 | 3 | 0.663 | 0.580 | 0.120 | 0.005 | 0.001 | 3 | 167 | |||
| NGC 1052 | 7 | 0.506 | 17.999 | 0.930 | 0.209 | 0.273 | 9 | 1.408 | 4.744 | 0.696 | 0.123 | 0.076 | 0.49 | 9 | 234 | ||
| NGC 1216 | 2 | 0.584 | 2.839 | 0.857 | 0.470 | 0.584 | 2 | ||||||||||
| NGC 2768 | 2 | 0.147 | 2.472 | 0.174 | 0.015 | 0.006 | 2 | 0.239 | 0.731 | 0.076 | 0.003 | 0.000 | 0.31 | 2 | 67 | ||
| NGC 3497 | 9 | 0.389 | 15.892 | 0.667 | 0.077 | 0.059 | 1 | 0.142 | 1.022 | 0.146 | 0.021 | 0.010 | 1 | 300 | |||
| NGC 3626 | 2 | 0.080 | 4.148 | 0.193 | 0.028 | 0.025 | 10 | 0.984 | 5.632 | 0.518 | 0.051 | 0.022 | 0.32 | 11 | 67 | ||
| NGC 3941 | 1 | 0.041 | 1.650 | 0.067 | 0.005 | 0.002 | 3 | 0.374 | 0.804 | 0.103 | 0.004 | 0.001 | 0.29 | 3 | 34 | ||
| NGC 4379 | 3 | 0.152 | 4.801 | 0.263 | 0.036 | 0.026 | 34 | 2.964 | 10.198 | 0.927 | 0.055 | 0.014 | 2.89 | 36 | 100 | ||
| NGC 4546 | 2 | 0.071 | 6.439 | 0.209 | 0.023 | 0.021 | 2 | 0.151 | 0.541 | 0.042 | 0.001 | 0.000 | 0.27 | 2 | 67 | ||
| NGC 4826 | 1 | 0.023 | 1.299 | 0.029 | 0.001 | 0.000 | 0.20 | 34 | |||||||||
| NGC 5252 | 5 | 0.214 | 7.941 | 0.358 | 0.031 | 0.018 | 1 | 0.242 | 0.272 | 0.066 | 0.004 | 0.001 | 1 | 167 | |||
| NGC 5354 | 6 | 0.525 | 23.129 | 2.038 | 1.301 | 3.848 | 15 | 2.801 | 12.884 | 2.455 | 1.076 | 1.519 | 16 | 200 | |||
| NGC 5898 | 5 | 0.788 | 6.385 | 0.856 | 0.252 | 0.292 | 0.23 | 5 | |||||||||
| NGC 7007 | 7 | 0.241 | 8.932 | 0.298 | 0.013 | 0.004 | 0 | 0.000 | 0.000 | 0.000 | 0.000 | 0.000 | 0.14 | 0 | 234 | ||
| NGC 7097 | 8 | 0.245 | 11.739 | 0.385 | 0.026 | 0.014 | 2 | 0.197 | 0.697 | 0.060 | 0.002 | 0.000 | 0.26 | 2 | 267 | ||
| NGC 7332 | 3 | 0.174 | 11.996 | 0.629 | 0.222 | 0.334 | 1 | 0.136 | 3.310 | 0.451 | 0.204 | 0.304 | 0.12 | 1 | 100 | ||
| stars cr | |||||||||||||||||
| IC 1459 | 9 | 0.586 | 15.543 | 0.936 | 0.205 | 0.186 | 14 | 2.033 | 2.529 | 0.400 | 0.026 | 0.006 | 0.28 | 15 | 300 | ||
| NGC 936 | 3 | 0.199 | 5.944 | 0.332 | 0.042 | 0.025 | 5 | 0.580 | 3.792 | 0.439 | 0.062 | 0.038 | 0.24 | 5 | 100 | ||
| NGC 1439 | 12 | 1.469 | 3.114 | 0.387 | 0.017 | 0.003 | 0.45 | 13 | |||||||||
| NGC 1543 | 0 | 0.000 | 0.000 | 0.000 | 0.000 | 0 | 11 | 1.288 | 1.983 | 0.211 | 0.004 | 0.000 | 0.95 | 12 | 0 | ||
| NGC 1574 | 1 | 0.021 | 1.828 | 0.039 | 0.002 | 0.001 | 20 | 2.376 | 4.221 | 0.520 | 0.022 | 0.003 | 0.98 | 21 | 34 | ||
| NGC 1700 | 0 | 0.000 | 0.000 | 0.000 | 0.000 | 0.000 | 0 | ||||||||||
| NGC 2841 | 1 | 0.021 | 2.288 | 0.049 | 0.002 | 0.001 | 3 | 0.104 | 1.912 | 0.062 | 0.002 | 0.000 | 0.13 | 3 | 34 | ||
| NGC 2983 | 1 | 0.250 | 0.215 | 0.054 | 0.003 | 0.000 | 0.16 | 1 | |||||||||
| NGC 3608 | 4 | 0.199 | 11.118 | 0.524 | 0.083 | 0.087 | 12 | 0.988 | 11.485 | 1.283 | 0.534 | 0.869 | 0.56 | 13 | 134 | ||
| NGC 4073 | 9 | 0.592 | 12.717 | 0.805 | 0.104 | 0.06 | 10 | 1.946 | 4.652 | 0.758 | 0.080 | 0.031 | 11 | 300 | |||
| NGC 4138 | 3 | 0.088 | 3.942 | 0.117 | 0.005 | 0.002 | 14 | 1.494 | 5.162 | 0.562 | 0.043 | 0.014 | 0.84 | 15 | 100 | ||
| NGC 4472 | 6 | 0.180 | 11.165 | 0.345 | 0.023 | 0.013 | 71 | 4.502 | 46.441 | 2.437 | 0.235 | 0.283 | 3.31 | 75 | 200 | ||
| NGC 4477 | 4 | 0.213 | 7.383 | 0.386 | 0.053 | 0.041 | 39 | 3.283 | 13.461 | 1.222 | 0.106 | 0.053 | 4.06 | 41 | 134 | ||
| NGC 4596 | 2 | 0.064 | 2.632 | 0.086 | 0.004 | 0.002 | 12 | 1.574 | 4.078 | 0.505 | 0.041 | 0.013 | 2.87 | 13 | 67 | ||
| NGC 4643 | 0 | 0.000 | 0.000 | 0.000 | 0.000 | 0 | 18 | 2.700 | 3.436 | 0.522 | 0.030 | 0.006 | 0.25 | 19 | 0 | ||
| NGC 4816 | 6 | 0.328 | 9.335 | 0.528 | 0.069 | 0.05 | 26 | 4.333 | 9.467 | 1.505 | 0.359 | 0.464 | 27 | 200 | |||
| NGC 5005 | 0 | 0.000 | 0.000 | 0.000 | 0.000 | 0 | 8 | 0.796 | 1.919 | 0.210 | 0.015 | 0.003 | 0.28 | 8 | 0 | ||
| NGC 5322 | 7 | 0.219 | 11.397 | 0.337 | 0.020 | 0.011 | 9 | 1.344 | 1.211 | 0.153 | 0.003 | 0.000 | 0.43 | 9 | 234 | ||
| NGC 5728 | 6 | 0.175 | 8.930 | 0.287 | 0.022 | 0.016 | 0 | 0.000 | 0.000 | 0.000 | 0.000 | 0.000 | 0.18 | 0 | 200 | ||
| NGC 6684 | 7 | 1.137 | 0.736 | 0.092 | 0.002 | 0.000 | 0.21 | 7 | |||||||||
| NGC 6701 | 15 | 0.549 | 27.578 | 0.977 | 0.082 | 0.058 | 0 | 0.000 | 0.000 | 0.000 | 0.000 | 0.000 | 0 | 500 | |||
| NGC 7217 | 0 | 0.000 | 0.000 | 0.000 | 0.000 | 0 | 0 | 0.000 | 0.000 | 0.000 | 0.000 | 0.000 | 0.15 | 0 | 0 | ||
| NGC 7331 | 3 | 0.203 | 1.089 | 0.066 | 0.002 | 0.000 | 0.33 | 3 | |||||||||
| NGC 7796 | 6 | 0.415 | 10.085 | 0.718 | 0.132 | 0.113 | 0 | 0.000 | 0.000 | 0.000 | 0.000 | 0.000 | 0 | 200 | |||
| UGC 9922A | 8 | 0.287 | 12.187 | 0.445 | 0.029 | 0.014 | 1 | 0.043 | 4.005 | 0.174 | 0.030 | 0.034 | 1 | 267 | |||
| gas plus stars cr | |||||||||||||||||
| IC 4889 | 10 | 0.410 | 16.651 | 0.680 | 0.060 | 0.033 | 1 | 0.108 | 0.315 | 0.034 | 0.001 | 0.000 | 0.13 | 1 | 334 | ||
| NGC 3593 | 0 | 0.000 | 0.000 | 0.000 | 0.000 | 0 | 8 | 1.159 | 3.301 | 0.592 | 0.093 | 0.036 | 0.19 | 8 | 0 | ||
| NGC 4550 | 2 | 0.080 | 7.225 | 0.348 | 0.095 | 0.161 | 7 | 0.315 | 7.640 | 0.396 | 0.053 | 0.050 | 2.97 | 7 | 67 | ||
| NGC 7079 | 0 | 0.000 | 0.000 | 0.000 | 0.000 | 0 | 1 | 0.166 | 0.241 | 0.040 | 0.002 | 0.000 | 0.19 | 1 | 0 | ||
| Name | APM data | NED data | galaxy densities | ||||||||||||||
|
|
|
|
|
|
|||||||||||||
| IC 5063 | 9 | 0.267 | 20.083 | 0.625 | 0.055 | 0.041 | 2 | 0.290 | 0.227 | 0.037 | 0.001 | 0.000 | 2 | 300 | |||
| NGC 488 | 7 | 0.380 | 11.232 | 0.599 | 0.056 | 0.032 | 3 | 0.291 | 2.543 | 0.200 | 0.015 | 0.006 | 0.28 | 3 | 234 | ||
| NGC 628 | 0 | 0.000 | 0.000 | 0.000 | 0.000 | 0 | 7 | 0.553 | 2.422 | 0.204 | 0.012 | 0.003 | 0.18 | 7 | 0 | ||
| NGC 1023 | 2 | 0.069 | 2.261 | 0.078 | 0.003 | 0.001 | 9 | 0.625 | 17.799 | 0.833 | 0.346 | 1.328 | 0.57 | 9 | 67 | ||
| NGC 1275 | 8 | 1.754 | 4.078 | 0.911 | 0.156 | 0.078 | 8 | ||||||||||
| NGC 1291 | 2 | 0.053 | 5.320 | 0.147 | 0.013 | 0.01 | 3 | 0.270 | 0.910 | 0.091 | 0.004 | 0.001 | 0.14 | 3 | 67 | ||
| NGC 1300 | 4 | 0.395 | 1.669 | 0.187 | 0.015 | 0.006 | 0.71 | 4 | |||||||||
| NGC 1566 | 2 | 0.063 | 3.283 | 0.104 | 0.006 | 0.002 | 12 | 2.160 | 2.320 | 0.407 | 0.017 | 0.002 | 0.92 | 13 | 67 | ||
| NGC 2613 | 1 | 0.124 | 0.169 | 0.021 | 0.000 | 0.000 | 0.15 | 1 | |||||||||
| NGC 2787 | 4 | 0.121 | 5.705 | 0.184 | 0.012 | 0.006 | 3 | 0.173 | 0.750 | 0.038 | 0.001 | 0.000 | 0.06 | 3 | 134 | ||
| NGC 2903 | 2 | 0.052 | 2.081 | 0.054 | 0.002 | 0 | 0 | 0.000 | 0.000 | 0.000 | 0.000 | 0.000 | 0.12 | 0 | 67 | ||
| NGC 2974 | 5 | 0.112 | 9.964 | 0.220 | 0.012 | 0.007 | 0 | 0.000 | 0.000 | 0.000 | 0.000 | 0.000 | 0.26 | 0 | 167 | ||
| NGC 3079 | 3 | 0.109 | 6.278 | 0.251 | 0.028 | 0.023 | 3 | 0.213 | 6.280 | 0.368 | 0.112 | 0.207 | 0.29 | 3 | 100 | ||
| NGC 3190 | 5 | 0.263 | 12.673 | 0.725 | 0.159 | 0.197 | 12 | 1.025 | 12.844 | 1.642 | 0.887 | 1.891 | 0.52 | 13 | 167 | ||
| NGC 3198 | 1 | 0.033 | 1.078 | 0.036 | 0.001 | 0 | 1 | 0.033 | 0.125 | 0.004 | 0.000 | 0.000 | 0.15 | 1 | 34 | ||
| NGC 3489 | 0 | 0.000 | 0.000 | 0.000 | 0.000 | 0 | 11 | 1.076 | 2.174 | 0.219 | 0.006 | 0.001 | 0.39 | 12 | 0 | ||
| NGC 3516 | 2 | 0.075 | 3.821 | 0.144 | 0.012 | 0.007 | 0 | 0.000 | 0.000 | 0.000 | 0.000 | 0.000 | 0.19 | 0 | 67 | ||
| NGC 3607 | 6 | 0.216 | 22.133 | 0.806 | 0.171 | 0.323 | 14 | 0.976 | 23.177 | 1.574 | 0.720 | 2.310 | 0.34 | 15 | 200 | ||
| NGC 3623 | 1 | 0.142 | 1.504 | 0.213 | 0.045 | 0.031 | 7 | 1.236 | 4.603 | 1.055 | 0.399 | 0.310 | 0.44 | 7 | 34 | ||
| NGC 3898 | 5 | 0.169 | 9.638 | 0.302 | 0.022 | 0.015 | 13 | 1.145 | 4.210 | 0.374 | 0.038 | 0.026 | 0.56 | 14 | 167 | ||
| NGC 3921 | 20 | 0.778 | 32.854 | 1.393 | 0.175 | 0.173 | 2 | 0.476 | 1.976 | 0.311 | 0.050 | 0.027 | 2 | 667 | |||
| NGC 3945 | 1 | 0.024 | 1.546 | 0.037 | 0.001 | 0 | 4 | 0.450 | 1.059 | 0.090 | 0.002 | 0.000 | 0.50 | 4 | 34 | ||
| NGC 3962 | 2 | 0.049 | 2.826 | 0.069 | 0.002 | 0.001 | 2 | 0.211 | 0.423 | 0.040 | 0.001 | 0.000 | 0.32 | 2 | 67 | ||
| NGC 4026 | 1 | 0.051 | 1.121 | 0.057 | 0.003 | 0.001 | 22 | 2.451 | 14.406 | 1.146 | 0.354 | 0.833 | 1.71 | 23 | 34 | ||
| NGC 4027 | 14 | 2.139 | 6.055 | 0.624 | 0.044 | 0.021 | 0.61 | 15 | |||||||||
| NGC 4036 | 2 | 0.051 | 3.585 | 0.096 | 0.006 | 0.004 | 5 | 0.699 | 1.262 | 0.163 | 0.007 | 0.001 | 0.44 | 5 | 67 | ||
| NGC 4111 | 8 | 0.344 | 19.254 | 0.754 | 0.093 | 0.08 | 13 | 1.138 | 25.703 | 1.337 | 0.340 | 0.754 | 1.09 | 14 | 267 | ||
| NGC 4350 | 1 | 0.086 | 3.484 | 0.300 | 0.090 | 0.117 | 25 | 2.773 | 8.731 | 1.093 | 0.260 | 0.328 | 2.72 | 26 | 34 | ||
| NGC 4379 | 2 | 0.111 | 3.630 | 0.215 | 0.034 | 0.026 | 34 | 2.964 | 10.198 | 0.927 | 0.055 | 0.014 | 2.89 | 36 | 67 | ||
| NGC 4450 | 1 | 0.024 | 3.509 | 0.086 | 0.007 | 0.006 | 9 | 1.083 | 2.464 | 0.285 | 0.012 | 0.002 | 1.88 | 9 | 34 | ||
| NGC 4565 | 5 | 0.188 | 6.516 | 0.251 | 0.017 | 0.008 | 2 | 0.363 | 2.851 | 0.400 | 0.102 | 0.101 | 1.00 | 2 | 167 | ||
| NGC 4579 | 1 | 0.029 | 1.595 | 0.046 | 0.002 | 0.001 | 35 | 3.215 | 8.425 | 0.849 | 0.047 | 0.012 | 3.26 | 37 | 34 | ||
| NGC 4594 | 1 | 0.022 | 1.543 | 0.034 | 0.001 | 0 | 2 | 0.203 | 0.467 | 0.044 | 0.001 | 0.000 | 0.32 | 2 | 34 | ||
| NGC 4736 | 1 | 0.020 | 1.020 | 0.021 | 0.000 | 0 | 0.42 | 34 | |||||||||
| NGC 4762 | 2 | 0.139 | 4.719 | 0.324 | 0.074 | 0.071 | 16 | 1.534 | 6.618 | 0.726 | 0.131 | 0.114 | 2.65 | 17 | 67 | ||
| NGC 5018 | 5 | 0.354 | 7.384 | 0.491 | 0.116 | 0.085 | 3 | 0.871 | 2.590 | 0.696 | 0.256 | 0.250 | 0.29 | 3 | 167 | ||
| NGC 5055 | 1 | 0.045 | 1.562 | 0.070 | 0.005 | 0.002 | 4 | 0.287 | 1.403 | 0.067 | 0.002 | 0.000 | 0.40 | 4 | 34 | ||
| NGC 5084 | 4 | 0.306 | 7.022 | 0.463 | 0.062 | 0.038 | 7 | 0.950 | 3.186 | 0.399 | 0.035 | 0.013 | 0.29 | 7 | 134 | ||
| NGC 5746 | 4 | 0.098 | 5.349 | 0.132 | 0.005 | 0.002 | 7 | 0.594 | 2.978 | 0.296 | 0.032 | 0.014 | 0.83 | 7 | 134 | ||
| NGC 5846 | 3 | 0.457 | 4.665 | 0.662 | 0.261 | 0.231 | 14 | 1.862 | 28.351 | 1.264 | 0.443 | 2.149 | 0.84 | 15 | 100 | ||
| NGC 5866 | 5 | 0.196 | 8.878 | 0.337 | 0.024 | 0.012 | 3 | 0.513 | 1.858 | 0.350 | 0.077 | 0.039 | 0.24 | 3 | 167 | ||
| NGC 6868 | 7 | 0.491 | 14.982 | 1.007 | 0.270 | 0.43 | 10 | 1.882 | 2.565 | 0.519 | 0.041 | 0.008 | 0.47 | 11 | 234 | ||
| NGC 7052 | 1 | 0.161 | 0.093 | 0.015 | 0.000 | 0.000 | 1 | ||||||||||
The statistical analysis of all fields for the cr galaxies and
comparison sample was done defining a set of
density parameters for each field:
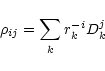 |
(1) |
The first three parameters describe the environment of the galaxies
with different criteria: the population (![]() ), the total size
of sky covered by surrounding galaxies (
), the total size
of sky covered by surrounding galaxies (![]() ), the
concentration of surrounding galaxies
), the
concentration of surrounding galaxies ![]() .
The remaining three
are linked with these:
.
The remaining three
are linked with these: ![]() is proportional to the
gravitational potential and
is proportional to the
gravitational potential and ![]() to the gravitational force
exerted by the surrounding galaxies on the central object, whereas
to the gravitational force
exerted by the surrounding galaxies on the central object, whereas
![]() is proportional to the tidal interaction between the
surrounding galaxies and the central one. The last two parameters
amplify the effects present in the parameter
is proportional to the tidal interaction between the
surrounding galaxies and the central one. The last two parameters
amplify the effects present in the parameter ![]() .
These
parameters were chosen in accordance with similar studies
(Heckman et al. 1985; Fuentes-Williams & Stocke 1988).
.
These
parameters were chosen in accordance with similar studies
(Heckman et al. 1985; Fuentes-Williams & Stocke 1988).
After conversion into linear units, as described in the precedent paragraphs,
the diameters and the distances from the central galaxies were
converted into units of 100 kpc. The resulting values of the ![]() for the field of each central galaxy are listed in Tables 2 and 3.
Results from the APM
database and NED are presented together in these tables.
for the field of each central galaxy are listed in Tables 2 and 3.
Results from the APM
database and NED are presented together in these tables.
After defining the ![]() parameters for the two samples of
counter-rotating galaxies and normal galaxies, a
Kolgomorov-Smirnov test was applied to the
parameters for the two samples of
counter-rotating galaxies and normal galaxies, a
Kolgomorov-Smirnov test was applied to the ![]() parameters of the local environment (APM data, galaxies within 100 kpc), to that of the intermediate environment (NED, bright galaxies
with similar red-shift) and to
parameters of the local environment (APM data, galaxies within 100 kpc), to that of the intermediate environment (NED, bright galaxies
with similar red-shift) and to
![]() densities (Tully 1988, on 40 Mpc
scale). The results are shown in Table 4.
densities (Tully 1988, on 40 Mpc
scale). The results are shown in Table 4.
We begin by considering the local densities
at three different scales: a close environment within 100 kpc, an
intermediate environment inside 0.61 Mpc, defined by a crossing time
of 1 Gyr, and a large scale environment inside 40 Mpc. These densities
were extracted from the APM, NED and Tully (1988) catalogues
respectively. The APM data refers to a projected galaxy density
![]() ,
whereas the NED and Tully (1988) data use the red-shift
to define "volume'' densities
,
whereas the NED and Tully (1988) data use the red-shift
to define "volume'' densities
![]() and
and
![]() respectively. When these densities are plotted against each other
(Fig. 1) we can see that
respectively. When these densities are plotted against each other
(Fig. 1) we can see that
![]() ,
and
,
and
![]() are correlated. In particular, excluding NGC 4379, all
the remaining galaxies with gas counterrotation belong to groups where
the density of galaxies
are correlated. In particular, excluding NGC 4379, all
the remaining galaxies with gas counterrotation belong to groups where
the density of galaxies
![]() galaxies Mpc-3 and
galaxies Mpc-3 and
![]() galaxies Mpc-3. On the contrary, the projected
densities extracted from APM data span the entire range of
plotted values, without any particular clustering of points. This may
be affected by the presence of background objects, which alter the
sample, despite our selection criteria defined in Sect. 4, or
may suggest that there is no particular clustering of objects in the
surrounding of our sample galaxies. However, bearing in mind that our
cut-off levels in magnitudes and sizes for possible companion galaxies
were quite high, it is more likely that a few satellites were missed
rather than having a significant contamination by background
objects. We think then that the plot reflects the real situation of
the densities existing within 100 kpc of our sample objects.
galaxies Mpc-3. On the contrary, the projected
densities extracted from APM data span the entire range of
plotted values, without any particular clustering of points. This may
be affected by the presence of background objects, which alter the
sample, despite our selection criteria defined in Sect. 4, or
may suggest that there is no particular clustering of objects in the
surrounding of our sample galaxies. However, bearing in mind that our
cut-off levels in magnitudes and sizes for possible companion galaxies
were quite high, it is more likely that a few satellites were missed
rather than having a significant contamination by background
objects. We think then that the plot reflects the real situation of
the densities existing within 100 kpc of our sample objects.
![\begin{figure}
\par\includegraphics[width=7cm,clip]{MS1116f1.eps}
\end{figure}](/articles/aa/full/2001/28/aa1116/img31.gif) |
Figure 1:
Plot of the density of objects around all the sample galaxies in
environments with different size. The galaxies with pure gas
counterrotation or pure stellar counterrotation are indicated by full
diamonds and open squares respectively; the normal galaxies are
indicated by crosses. The galaxies with both gas and stellar
counterrotation are plotted with open circles. Top panel: plot
of (
|
| Open with DEXTER | |
| gas cr vs. no cr | stars cr vs. no cr | all cr vs. no cr | ||||||
| Param. | SL | SL | SL | |||||
| APM (100 kpc environment) | ||||||||
| 0.178 | 13.3% | 0.292 | 78.6% | 0.217 | 64.9% | |||
| 0.283 | 66.9% | 0.258 | 64.9% | 0.233 | 72.9% | |||
| 0.257 | 54.9% | 0.237 | 54.3% | 0.207 | 58.8% | |||
| 0.207 | 28.5% | 0.179 | 20.9% | 0.179 | 40.6% | |||
| 0.145 | <10% | 0.121 | <10% | 0.096 | <10% | |||
|
|
0.171 | 10.4% | 0.079 | <10% | 0.050 | <10% | ||
| NED (1 Gyr similar redshift companions) | ||||||||
| 0.167 | 12.7% | 0.130 | <10% | 0.056 | <10% | |||
| 0.206 | 34.6% | 0.242 | 67.9% | 0.166 | 40.1% | |||
| 0.071 | <10% | 0.129 | <10% | 0.058 | <10% | |||
| 0.135 | <10% | 0.129 | <10% | 0.095 | <10% | |||
| 0.111 | <10% | 0.150 | 12.8% | 0.097 | <10% | |||
|
|
0.056 | <10% | 0.154 | 15.4% | 0.097 | <10% | ||
| densities of galaxies from different catalogues | ||||||||
|
|
0.372 | 84.2% | 0.140 | <10% | 0.238 | 71.6% | ||
|
|
0.206 | 34.6% | 0.155 | 15.9% | 0.063 | 20.4% | ||
|
|
0.178 | 13.3% | 0.203 | 34.8% | 0.153 | 22.3% | ||
This segregation/concentration for galaxies with gas counterrotation
in Fig. 1 is confirmed by a Kolgomorov-Smirnov test
applied to the galaxy densities around the whole sample, except for
NGC 4379. The population of galaxies with gas counterrotation and the
population of normal galaxies appear to be different at a significance
level of 93.7%. However, there is no a priori justification for
the exclusion of NGC 4379. Its inclusion reduces the significance
level to 84% and weakens the difference between populations. The same
test applied to the NED and APM densities indicates that the
difference between samples decreases when smaller environments are
considered (see the last lines of Table 4). We may conclude
that, in the limited number of galaxies with pure gas counterrotation
available, they tend to lie in less dense groups, on scales larger
than ![]() 0.5 Mpc.
0.5 Mpc.
Looking at the other studied parameters, described by the ![]() quantities (Tables 2 and 3), Kolgomorov-Smirnov tests
indicate that no marked differences are evident in APM or in the NED
data. In fact, no significance level is above
quantities (Tables 2 and 3), Kolgomorov-Smirnov tests
indicate that no marked differences are evident in APM or in the NED
data. In fact, no significance level is above ![]() 80% (Table 4).
80% (Table 4).
We deduce that in general the surrounding regions of galaxies with counterrotation do not appear statistically different from those of normal galaxies. This result is similar to that found in Paper I for the environment of polar ring galaxies but distinguish our galaxies from the other active galaxy categories (Dahari 1984; Heckman et al. 1985; Hintzen et al. 1991; Rafanelli et al. 1995).
Among the hypotheses presented in the Introduction about the origin of counterrotation and polar rings, our result tend to disprove that of a recent interaction with a small satellite or a galaxy with similar size. If such a process is at the origin of the counterrotation phenomenon (Balcells & Gonzalez 1998; Bekki 1998; Kennicut 1996; Thakar & Ryden 1996), it cannot be younger than 1 Gyr, the crossing time for the volumes of space studied in this paper. Otherwise it is difficult to conceive that no trace of the donor galaxy remains in the surrounding space, both as a single galaxy present in the NED archive or in a form detectable in APM data as diffuse surrounding objects.
This result, to a first approximation, support the hypothesis that all galaxies are born from a merger process of smaller objects occurring early in their life. However, only a few galaxies that we know of develop counterrotation and polar rings. It may be natural to attribute this peculiarity to a richer environment, which makes the possibility of collisions easier. Our data are also contrary to this hypothesis, because the environment of such galaxies does not appear to be richer in satellites. This is different to Seyfert or radio-loud galaxies which lie in environments with a higher density of companions. On the contrary, if a weak tendency exists for galaxies with gas counterrotation only, it is seen in regions of space where the large scale density of galaxies is smaller. Whatever the special machinery is which produces counterrotation or polar rings instead of a co-planar, co-rotating distribution of gas and stars, it is not connected to the present galaxy density of their environments.
An alternative mechanism to form counterrotation and polar rings may arise from a continuous, non traumatic infall of gas that later formed stars (Voglis et al. 1991; Quinn & Binney 1992; Merrifield & Kuijken 1994; Ostriker & Binney 1989; Rix et al. 1992). In such a case the past and present visible environment of these galaxies would appear similar to that of the other galaxies, even if the process is still active. This explanation is consistent with all the results we found. The slow infall of matter on a galaxy should not alter either its luminosity distribution or its stellar kinematics, untill the accreted mass is large enough to generate tidal actions. The galaxies with counterrotation and the polar rings may in such a scenario appear relaxed or in equilibrium, even if some star formation is active (see the polar rings of NGC 4650A and NGC 5128).
The study of the peculiar galaxies that present gas accretion is still under discussion of the possible models to explain their origin and evolution. It is currently impossible to decide between the previous, perhaps incompatible, theories (early merging with special dynamical conditions or continuous slow infall). On the other hand, the observations of galaxies with counterrotation, begun in 1984, provide clues to their evolution, but are still not conclusive. To solve the problem, we are planning to study the gas content of galaxies with counterrotation and polar rings (Bettoni et al. 2001).
Acknowledgements
We would like to thank Dr. J. Sulentic for useful suggestions regarding this paper. This research was done using the LEDA database, (leda.univ-lyon1.fr), of the NASA/IPAC Extragalactic Database (NED, nedwww.ipac.caltech.edu) which is operated by the Jet Propulsion Laboratory, California Institute of Technology, under contract to the National Aeronautics and Space Administration and of the Hypercat database (www-obs.univ-lyon1.fr/hypercat). This search has been granted by the funds 60%-2000 of the Università di Padova.