Several evolutionary sequences with low-mass secondaries (
A&A 374, 195-203 (2001)
DOI: 10.1051/0004-6361:20010688
E. Ergma1,2 - M. J. Sarna3
1 - Physics Department, Tartu University, Ülikooli 18, 50090
Tartu, Estonia
2 -
Astronomical Observatory, Helsinki University, Box 14, 00014 Helsinki,
Finland
3 -
N. Copernicus Astronomical Center,
Polish Academy of Sciences,
ul. Bartycka 18, 00-716 Warsaw, Poland
Received 23 January 2001 / Accepted 11 May 2001
Abstract
Several evolutionary sequences with low-mass secondaries
(
![]() ,
1.5 and 1.7
,
1.5 and 1.7 ![]() )
and black hole accretors
(
)
and black hole accretors
(
![]() and 10
and 10 ![]() )
are calculated. The angular momentum
losses due to magnetic braking and gravitational wave radiation
are included. Using full nuclear networks (p-p and CNO cycles) we
follow carefully the evolution of the surface composition of the
secondary star. We find that the surface chemical composition of the
secondary star may give additional information which
helps to understand the formation of soft X-ray transients with
black holes as accretors. We show that observations of isotope ratios
12C/13C, 14N/15N and 16O/17O with comparison
to computed sequences allow estimates independent of spectroscopy of the
mass of the secondary component.
We find that our evolutionary calculations satisfactorily explain the observed
)
are calculated. The angular momentum
losses due to magnetic braking and gravitational wave radiation
are included. Using full nuclear networks (p-p and CNO cycles) we
follow carefully the evolution of the surface composition of the
secondary star. We find that the surface chemical composition of the
secondary star may give additional information which
helps to understand the formation of soft X-ray transients with
black holes as accretors. We show that observations of isotope ratios
12C/13C, 14N/15N and 16O/17O with comparison
to computed sequences allow estimates independent of spectroscopy of the
mass of the secondary component.
We find that our evolutionary calculations satisfactorily explain the observed
![]() distribution for Soft X-ray transients
with orbital periods less than one day. Using our evolutionary
calculations we estimate secondary masses and surface chemical
abundances (C, N, O) for different systems. We distinguished three different
phases in the SXT's evolution. The optical component shows (i) cosmic C, N, O
abundances and 12C/13C isotopic ratio; (ii) cosmic C, N, O
abundances but modified 12C/13C ratio; and (iii) depletion of C and
enhanced of N abundances and strongly modified isotopic ratios of C, N, O.
distribution for Soft X-ray transients
with orbital periods less than one day. Using our evolutionary
calculations we estimate secondary masses and surface chemical
abundances (C, N, O) for different systems. We distinguished three different
phases in the SXT's evolution. The optical component shows (i) cosmic C, N, O
abundances and 12C/13C isotopic ratio; (ii) cosmic C, N, O
abundances but modified 12C/13C ratio; and (iii) depletion of C and
enhanced of N abundances and strongly modified isotopic ratios of C, N, O.
Key words: stars: evolution - X-ray: stars
In recent years, about a dozen black hole candidates (BHC) with low-mass
companion stars have been identified as the so-called soft X-ray transients
(SXTs).
During the low X-ray luminosity stage (quiescent phase) optical/infrared
observations of the optical companion allow the measurement of the mass
function and sets a strong lower limit on the mass of the unseen companion
 |
(1) |
If
![]() ,
then
,
then
![]() is larger than the upper limit the gravitational
mass of a neutron star (Rhoades & Ruffini 1974) and these compact objects
are black holes. The total number of close binaries with a black hole
companion in the Galaxy is estimated to be between a few hundred and a
few thousand. Only a small fraction of these systems show X-ray activity
(Tanaka & Lewin 1995; Tanaka & Shibazaki 1996).
is larger than the upper limit the gravitational
mass of a neutron star (Rhoades & Ruffini 1974) and these compact objects
are black holes. The total number of close binaries with a black hole
companion in the Galaxy is estimated to be between a few hundred and a
few thousand. Only a small fraction of these systems show X-ray activity
(Tanaka & Lewin 1995; Tanaka & Shibazaki 1996).
The most popular scenario for the origin of low-mass X-ray binaries proposes as a starting point a relatively wide binary system with an extreme mass ratio (van den Heuvel 1983). After filling its Roche lobe, the massive primary engulfs its low-mass companion which will spiral-in inside its envelope (common envelope). In the common envelope scenario, if the envelope of the massive star is expelled before the low-mass secondary coalesces with the massive helium core of the primary, then a close binary system forms. Black hole formation occurs due to the collapse of the massive helium core after the ejection of the red supergiant envelope.
The critical question is which stars end their evolution with black hole formation.
For a long time it has been accepted that black holes form from very massive
stars (more than 40-50 ![]() ). Recently,
observational and theoretical evidence suggest that black holes form
from stars with masses above
25
). Recently,
observational and theoretical evidence suggest that black holes form
from stars with masses above
25![]() (Portegies Zwart et al. 1997; Ergma & van den Heuvel 1998;
Ergma & Fedorova 1998; Fryer 1999).
(Portegies Zwart et al. 1997; Ergma & van den Heuvel 1998;
Ergma & Fedorova 1998; Fryer 1999).
The majority of observed black hole candidates (see Table 1) have orbital periods less than one day. Therefore, the transient nature of BHC systems and short orbital periods put rather strong constraints on the properties of the progenitor systems and hence our understanding of how these systems evolve.
In this paper we would like to show that there is one additional, independent observational piece of evidence - the abundance of CNO elements and their isotopic ratios - which will give us information about the progenitors of SXTs and their evolutionary stage.
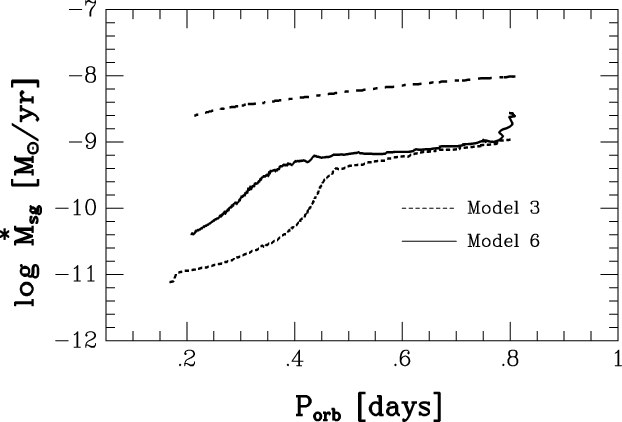 |
Figure 1: The evolution of mass accretion rate as a function of the orbital period: dashed line - model 3, solid line - model 6. The critical mass accretion rate computed from Eq. (2) is also shown (dash-dotted line). |
| Open with DEXTER | |
To understand why these sources are transients we use the dwarf nova instability criterion adapted to account for X-ray heating of the disk.
King et al. (1997) have realized that heating
by irradiation is
much weaker if the accreting object is a black hole rather than a neutron
star, since the black hole has no hard surface and cannot act as a point
source for irradiation. For black hole binaries King et al. (1997) have
obtained the following formula for the critical accretion rate:
![\begin{displaymath}\dot{M}_{\rm cr}^{\rm irr}\approx 2.86\times 10^{-11}M_{\rm b...
...rm sg}^{-1/6}
P_{\rm orb}^{4/3} ~~~~~[M_\odot~{\rm yr}^{-1}].
\end{displaymath}](/articles/aa/full/2001/28/aa1055/img24.gif) |
(2) |
Ergma & Fedorova (1998) found the bifurcation period
![]() ,
which
separates orbital evolution of Case (3) and Case (2) from
Case (1), to be about
one day. So to have short orbital period systems it is
necessary that the secondary fills its Roche lobe (RLOF) with an
initial orbital period
,
which
separates orbital evolution of Case (3) and Case (2) from
Case (1), to be about
one day. So to have short orbital period systems it is
necessary that the secondary fills its Roche lobe (RLOF) with an
initial orbital period
![]() (RLOF) less
than
(RLOF) less
than
![]() .
Also, the mass of the secondary is not arbitrary but must be between
1 and 1.8
.
Also, the mass of the secondary is not arbitrary but must be between
1 and 1.8 ![]() to have Case (2) or (3) evolution.
Pylyser & Savonije's (1988) calculations show an absence of Case (2)
or (3)
evolution for a binary consisting of
to have Case (2) or (3) evolution.
Pylyser & Savonije's (1988) calculations show an absence of Case (2)
or (3)
evolution for a binary consisting of
![]()
![]() with an initial
donor star mass
with an initial
donor star mass ![]() 1.7
1.7 ![]() .
.
| Sources |
|
q | f(
|
i | References |
| [d] | [ |
||||
| XTE J1118+480 | 0.171 | McClintock et al. (2000, 2001) | |||
| Wagner et al. (2001) | |||||
| GRO J0422+32 | 0.212 | 0.116+0.079-0.071 |
|
35-55 | Harlaftis et al. (1999) |
|
|
Webb et al. (2000) | ||||
| GRS 1009-45 | 0.285 |
|
|
<80 | Filippenko et al. (1999) |
| A0620-00 | 0.323 |
|
|
31-54 | Marsh et al. (1994) |
| GS 2000+25 | 0.345 |
|
|
66 | Casares et al. (1995), Harlaftis et al. (1996) |
| GRS 1124-683 | 0.433 | 0.128+0.044-0.039 |
|
54-65 | Casares et al. (1997) |
| H1705-250 | 0.521 | <0.053 |
|
60-80 | Harlaftis et al. (1997) |
| 4U 1755-338 | 0.186 | BHC | Pan et al. (1995) | ||
| XTE J1859+226 | 0.382 | BHC | Sanchez-Fernandez et al. (2000) | ||
| GX339-4 | 0.617 | BHC | Tanaka & Lewin (1995) | ||
The Roche-filling-component (secondary star) models were computed using a standard stellar evolution code based on the Henyey-type code of Paczynski (1970), which has been adapted to low-mass stars (Marks & Sarna 1998). The carbon-nitrogen-oxygen (CNO) tri-cycle affects the abundance ratios we are interested in outside the hydrogen burning core. As the secondary loses matter, due to mass transfer, layers originally below the surface are exposed. As a consequence of mass loss and nuclear evolution, a convective envelope develops and penetrates to even deeper layers of the star, which are then mixed, changing its surface chemical composition.
Our nuclear reaction network is based on that of Kudryashov & Ergma (1980), who included the reactions of the CNO tri-cycle in their calculations of hydrogen and helium burning in the envelope of an accreting neutron star . We have included the reactions of the proton-proton (p-p) chain. Hence, we are able to follow the evolution of the elements 1H, 3He, 4He, 7Be, 12C, 13C, 13N, 14N, 15N, 14O, 15O, 16O, 17O and 17F. We assume that the abundances of 18O and 20Ne stay constant throughout the evolution. We use the reaction rates of Fowler et al. (1967, 1975), Harris et al. (1983), Caughlan et al. (1985), Caughlan & Fowler (1988), Bahcall & Ulrich (1988), Bahcall & Pinsonneault (1992), Bahcall et al. (1995) and Pols et al. (1995).
| Model |
|
|
|
|
|
|
|
| (RLOF) | (C/N=1) | (C/N=0.1) | (C/N=1) | (C/N=0.1) | |||
| [d] | [d] | [d] | [ |
[ |
[ |
[ |
|
| 1 | 0.6 | 0.234 | 0.191 | 10 | 1.25 | 0.472 | 0.346 |
| 2 | 0.7 | 0.315 | 0.277 | 10 | 1.25 | 0.488 | 0.365 |
| 3 | 0.8 | 0.455 | 0.431 | 10 | 1.25 | 0.514 | 0.353 |
| 4 | 0.7 | 0.295 | 0.249 | 5 | 1.25 | 0.487 | 0.372 |
| 5 | 0.7 | 0.277 | 0.309 | 10 | 1.50 | 0.624 | 0.505 |
| 6 | 0.8 | 0.373 | 0.336 | 10 | 1.50 | 0.636 | 0.505 |
| 7 | 0.9 | 0.791 | 0.599 | 10 | 1.50 | 0.671 | 0.599 |
| 8 | 0.8 | 0.347 | 0.312 | 5 | 1.50 | 0.632 | 0.507 |
| 9 | 0.8 | 0.442 | 0.394 | 10 | 1.70 | 0.749 | 0.610 |
| 10 | 0.8 | 0.410 | 0.355 | 5 | 1.70 | 0.746 | 0.611 |
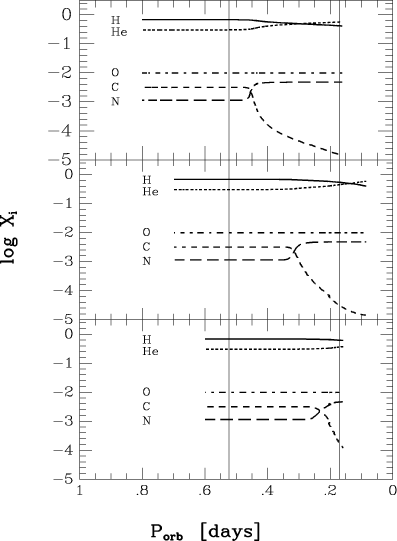 |
Figure 2: The evolution of the red subgiant surface abundances of H, He, O, C, N as a function of orbital period: lower panel - sequence (1), middle panel - sequence (2), upper panel - sequence (3). The two thin solid vertical lines show the orbital period region for SXT's. |
| Open with DEXTER | |
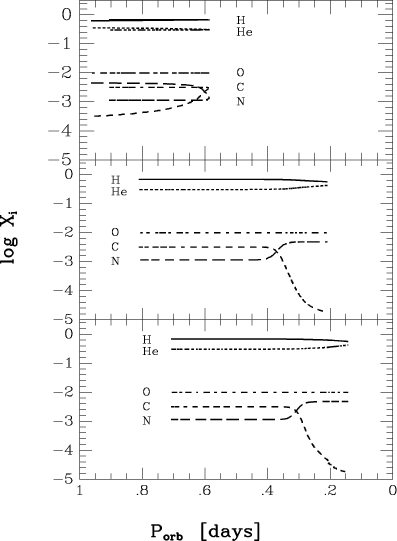 |
Figure 3: The same as for Fig. 2: lower panel - sequences (5), middle panel - sequences (6), upper panel - sequence (7). |
| Open with DEXTER | |
For radiative transport, we use the opacity tables of Iglesias & Rogers (1996). Where the Iglesias & Rogers (1996) tables are incomplete, we have filled the gaps using the opacity tables of Huebner et al. (1977). For temperatures less than 6000 K we use the opacities given by Alexander & Ferguson (1994) and Alexander (private communication). The contribution from conduction, which is present in the Huebner et al. (1977) opacity tables, has been added to the other tables as well, since they don't include it (Haensel, private communication). The chemical compositions are X=0.7, Z=0.02. In calculating evolutionary models of binary stars, we must take into account mass transfer and the associated physical mechanisms which lead to angular momentum loss. We consider the subsequent mass transfer from the secondary to the black hole when the secondary star reaches contact with its Roche lobe. We use the Eggleton (1983) formula to calculate the size of the secondary's Roche lobe. We take into account angular momentum losses due to gravitational wave radiation (Landau & Lifshitz 1971) and magnetic stellar wind braking (Verbunt & Zwaan 1981).
In Table 1 we present observational data for all known or suspected SXTs with a black hole as accretor and orbital period less than one day.
Spectral observations and a mass function determination have been done for several systems. For a few systems C, N, O spectral lines in different wavelength ranges were also detected.
XTE J1118+480 is a BHC (Table 1) with an orbital period of 0.171 d (Patterson
2000). McClintock et al. (2000, 2001) found that
![]()
![]() .
Similar result has been presented by Wagner et al. (2001)
.
Similar result has been presented by Wagner et al. (2001)
![]() ).
Haswell et al. (2000) found that the Balmer jump appears in absorption.
N V emission (124.0, 124.3 nm) is most prominent with equivalent
width 0.6 nm. No C IV or O V emission is detected, suggesting that the
accreting material has been CNO-processed.
).
Haswell et al. (2000) found that the Balmer jump appears in absorption.
N V emission (124.0, 124.3 nm) is most prominent with equivalent
width 0.6 nm. No C IV or O V emission is detected, suggesting that the
accreting material has been CNO-processed.
XTE J1859+226 is a suspected BHC with suggested orbital period
![]() d
(Sanchez-Fernander et al. 2000). The ultraviolet spectrum shows broad
and deep Ly-
d
(Sanchez-Fernander et al. 2000). The ultraviolet spectrum shows broad
and deep Ly-![]() absorption, strong C IV 155.5 nm emission
and weaker emission lines of C III, N V, O III, O IV, O V, Si IV and He II
(Hynes et al. 1999).
absorption, strong C IV 155.5 nm emission
and weaker emission lines of C III, N V, O III, O IV, O V, Si IV and He II
(Hynes et al. 1999).
The spectrum is nearly featureless. Very weak He II was measured in one spectrum in 1986 (Cowley et al. 1988).
Della Valle et al. (1991)
found that the most prominent emission lines are
H![]() ,
H
,
H![]() ,
N III+He II and N II (721.7 nm). The
N III emission is normally attributed to the X-ray heating driving
the Bowen fluorescence process, but in the present case it appears
broadened by the O II and C III ions.
,
N III+He II and N II (721.7 nm). The
N III emission is normally attributed to the X-ray heating driving
the Bowen fluorescence process, but in the present case it appears
broadened by the O II and C III ions.
In Table 2 we present computed masses and orbital periods for two different phases of the binary evolutionary sequences: for the beginning of carbon depletion (C/N=1) and the high carbon depletion (C/N=0.1).
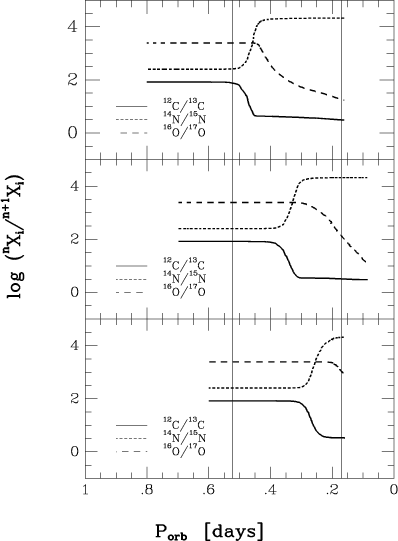 |
Figure 4:
The evolution of various isotope ratios 12C/13C,
14N/15N and 16O/17O versus orbital period for the
1.25 |
| Open with DEXTER | |
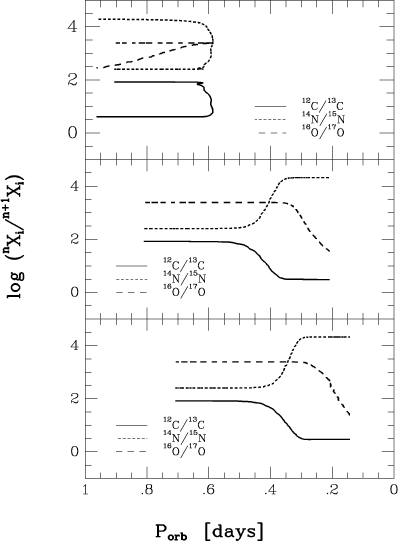 |
Figure 5:
The same as for Fig. 4 but for 1.5 |
| Open with DEXTER | |
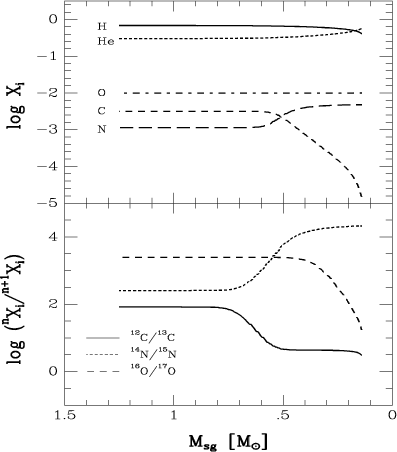 |
Figure 6: The evolution of red subgiant surface abundances of H, He, O, C (upper panel) and isotopic ratios of 12C/13C, 14N/15N and 16O/17O (lower panel) as function of secondary mass (Model 3). |
| Open with DEXTER | |
In our Table 2, only for Model 7, the secondary fills the Roche lobe
close to the bifurcation period and binary evolution ends up with almost the
same period as the initial orbital period. For other models,
since
![]() ,
all binaries evolve towards short orbital
periods. In Fig. 1 we present mass accretion rate versus orbital period for
Models 3 and 6. The critical mass accretion rate (Eq. (2)) is also
shown (dash-dotted line). Our calculations show that during evolution the
secular mass accretion rate is always less than the critical one.
Ergma & Fedorova (1998) pointed out that the
condition for disk instability is more favorable in systems with
higher black hole masses.
,
all binaries evolve towards short orbital
periods. In Fig. 1 we present mass accretion rate versus orbital period for
Models 3 and 6. The critical mass accretion rate (Eq. (2)) is also
shown (dash-dotted line). Our calculations show that during evolution the
secular mass accretion rate is always less than the critical one.
Ergma & Fedorova (1998) pointed out that the
condition for disk instability is more favorable in systems with
higher black hole masses.
Our main interest was concerned with how the surface chemical composition
evolves depending on the initial secondary mass and the initial orbital period
of RLOF. In Figs. 2a-c we present the evolution of
the 1.25![]() red subgiant surface abundances
of H, He, O, C, N as a function of orbital period for Models 1, 2 and 3.
In Figs. 3a-c the same is shown but for 1.5
red subgiant surface abundances
of H, He, O, C, N as a function of orbital period for Models 1, 2 and 3.
In Figs. 3a-c the same is shown but for 1.5![]() secondaries (Models 5, 6, 7).
secondaries (Models 5, 6, 7).
Figures 2 and 3 show that surface chemical composition may give us
additional information about the progenitors of SXTs. If
we do not observe carbon in the spectra of the optical companion of SXTs
with an orbital period of about 0.4 d, then the secondary must fill its
Roche lobe near
![]() d (but less than one day).
The secondary initial mass must be less than 1.7
d (but less than one day).
The secondary initial mass must be less than 1.7 ![]() .
We predict that if we observe carbon in the spectra of the secondary
star in SXT with
.
We predict that if we observe carbon in the spectra of the secondary
star in SXT with
![]() d, then the
initial mass of the secondary must be less than 1.5
d, then the
initial mass of the secondary must be less than 1.5 ![]() (Fig. 3).
For
(Fig. 3).
For
![]() ,
initial Roche lobe filling must occur when
,
initial Roche lobe filling must occur when
![]() d. In Figs. 4a-c and 5a-c the
dependence of various isotope ratios 12C/13C, 14N/15N
and 16O/17O versus orbital period are shown.
d. In Figs. 4a-c and 5a-c the
dependence of various isotope ratios 12C/13C, 14N/15N
and 16O/17O versus orbital period are shown.
In Figs. 6a, b we show the evolution of the red subgiant surface abundances
of H, He, O, C, N (a) and
12C/13C, 14N/15N and 16O/17O (b) as a
function of secondary mass (Model 3). In Figs. 7a, b the same
is shown for Model 6. From these figures we can see that for more
massive secondaries, isotope ratios start to change when the mass of the
secondary has decreased to 0.9 ![]() (0.7
(0.7 ![]() for a less massive
secondary) and C/N ratios change when
for a less massive
secondary) and C/N ratios change when
![]() 0.6
0.6 ![]() (for 1.5
(for 1.5
![]() )
and
)
and
![]() (for 1.25
(for 1.25 ![]() ), independent
of the initial period of the RLOF.
), independent
of the initial period of the RLOF.
From the point of view of the evolution of chemical composition we will distinguish three different phases of the SXT's evolutionary stage:
1) For
![]() and
and
![]() d the optical component shows solar/cosmic C, N, O abundances and
isotopic ratio of 12C/13C;
d the optical component shows solar/cosmic C, N, O abundances and
isotopic ratio of 12C/13C;
2) For
![]() and
and
![]() d the optical component shows
cosmic C, N, O abundances but a modified 12C/13C ratio;
d the optical component shows
cosmic C, N, O abundances but a modified 12C/13C ratio;
3) For
![]() and
and
![]() d the optical
component shows depletion of carbon and enhancement of N abundances (small C/Nratio) and strongly modified isotopic ratios of C, N and O.
d the optical
component shows depletion of carbon and enhancement of N abundances (small C/Nratio) and strongly modified isotopic ratios of C, N and O.
We conclude that chemical evolution can give us extra information about the mass of the secondary and this is independent of the black hole mass and the initial evolutionary stage of the secondary component (see Table 2).
In Fig. 8 we present calculated q versus orbital period
![]() for
for
![]() ,
1.50, 1.25
,
1.50, 1.25 ![]() and
and
![]() (upper curves) and
(upper curves) and
![]()
![]() (lower curves).
In this figure we also plot observed q values from Table 1. We see
that for five systems (XTE J1118+480, A0620-003, GS 2000+25, GRS 1124-683
and H1705-250 (only upper limit)) our theoretical results agree
satisfactorily with the observations. For GRO J0422+32 and
GRS 1009-45 agreement is not good. The mass ratio for GRS 1009-45 is based
only on an H
(lower curves).
In this figure we also plot observed q values from Table 1. We see
that for five systems (XTE J1118+480, A0620-003, GS 2000+25, GRS 1124-683
and H1705-250 (only upper limit)) our theoretical results agree
satisfactorily with the observations. For GRO J0422+32 and
GRS 1009-45 agreement is not good. The mass ratio for GRS 1009-45 is based
only on an H![]() emission radial velocity curve that is not exactly
in antiphase with respect to the absorption line velocity curve. Therefore
this mass ratio should be treated with extreme caution (referee remark).
The mass ratio for GRS 1009-45 is not reliable so that point in the
emission radial velocity curve that is not exactly
in antiphase with respect to the absorption line velocity curve. Therefore
this mass ratio should be treated with extreme caution (referee remark).
The mass ratio for GRS 1009-45 is not reliable so that point in the
![]() diagram can move down (good for theoretical models) or up
(bad for our picture).
For XTE J1118+480 Wagner et al. (2001) found that modeling of the light curves
gives a small mass ratio (
diagram can move down (good for theoretical models) or up
(bad for our picture).
For XTE J1118+480 Wagner et al. (2001) found that modeling of the light curves
gives a small mass ratio (![]() 0.05) which fits well with our model
calculation results (see also Fig. 8).
0.05) which fits well with our model
calculation results (see also Fig. 8).
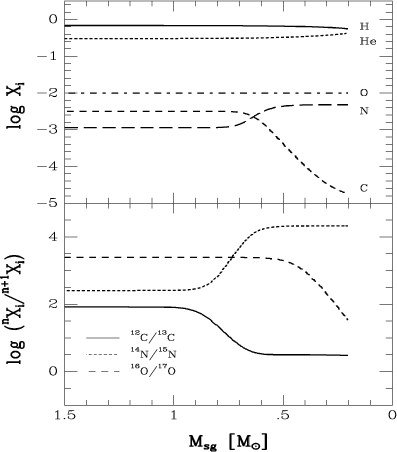 |
Figure 7: The same as for Fig. 7 but for model 6. |
| Open with DEXTER | |
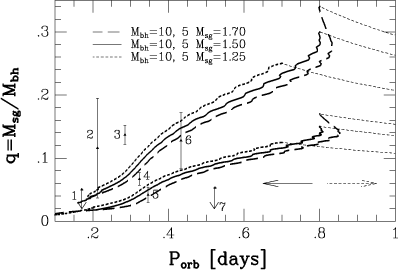 |
Figure 8:
The observed mass ratio q versus orbital period
|
| Open with DEXTER | |
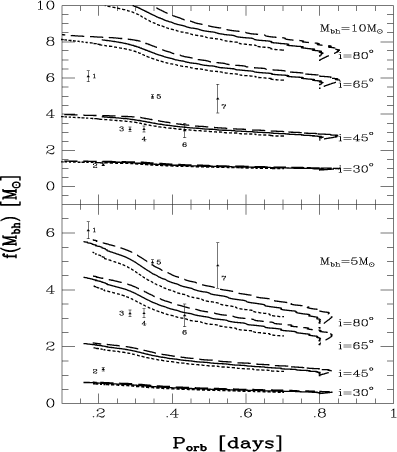 |
Figure 9:
The observed mass function
|
| Open with DEXTER | |
In Fig. 9 computed mass functions (for different values of orbital
inclination) are shown for two black hole masses (5 and 10 ![]() )
and
three secondary masses (1.25, 1.5 and 1.7
)
and
three secondary masses (1.25, 1.5 and 1.7 ![]() ).
).
From computed evolutionary sequences
we predict the chemical composition of the optical companion of the black
hole.
For all systems with known orbital period (see Table 1) we estimate (from our
grid of models) the following parameters: C/N, 12C/13C ,
16O/17O and
![]() .
The data are presented in Table 3.
For all systems we predict the
range of secondary masses using only orbital period and our grid of
models.
.
The data are presented in Table 3.
For all systems we predict the
range of secondary masses using only orbital period and our grid of
models.
All our models (beside Model 7) predict that near an orbital period of
0.2-0.3 d,
carbon is depleted (GRO J0422+32 and XTE J1118+480). For XTE J1118+480 we
estimate a secondary mass in the range 0.14-0.29![]() and a rather small
mass ratio (q< 0.04).
and a rather small
mass ratio (q< 0.04).
If XTE J1859-058 has an orbital period of 0.382 d and its UV spectrum shows carbon emission lines then besides Models 3, 7, 9 and 10, carbon is not depleted near this orbital period.
| Sources |
|
C/N | 12C/13C | 16O/17O |
|
| [d] | [ |
||||
| XTE J1118+480 | 0.171 | 0.005-0.04 | 3-3.4 | 20-1100 | 0.14-0.29 |
| GRO J0422+32 | 0.212 | 0.004-0.02 | 3-3.4 | 30-500 | 0.15-0.36 |
| GRS 1009-45 | 0.285 | 0.01-1.14 | 3.1-3.8 | 50-2000 | 0.17-0.54 |
| A0620-00 | 0.323 | 0.005-1.6 | 3-5.2 | 70-2470 | 0.18-0.67 |
| GS 2000+25 | 0.345 | 0.02-2.78 | 10-83 | 100-2470 | 0.20-0.83 |
| GRS 1124-683 | 0.433 | 0.12-2.78 | 4-83 | 1600-2470 | 0.36-1.05 |
| H1705-250 | 0.521 | 2.78 | 74-83 | 2470 | 0.77-1.24 |
| 4U 1755-338 | 0.186 | 0.005-0.09 | 3-3.4 | 20-1800 | 0.15-0.33 |
| XTE J1859+226 | 0.382 | 0.03-2.78 | 7-83 | 200-2470 | 0.25-0.90 |
| GX339-4 | 0.617 | 2.78 | 83 | 2470 | 0.94-1.25 |
Besides the UV and blue spectral regions it is interesting to try to observe in red spectral regions (Charles 2001, private communication) and infrared regions of the spectrum.
The red CN bands
![]() (Bauschlicher et al.
1988) from 4370-15050 Å are useful for observations. We propose to
observe the spectral region near 7920-7940 Å to identify two 13CN lines
at 7921.13 Å and 7935.67 Å which are very useful for both
12C/13C
isotopic ratio and C, N abundance determination. In the
case of a low 12C/13C ratio (<10) these lines are clearly recognized
(Fujita 1985). However, in stars of high 12C/13C ratio (>20)
both isotopic lines are undetectable. The best candidates for such
observations are GRS 1009-45, A0620-00 and GRS 1124-683. The EB-V in
the direction of these systems is not very high and also optical companions
are not too faint. For the first two systems we predict no carbon detection
while for last one, carbon lines must be visible.
(Bauschlicher et al.
1988) from 4370-15050 Å are useful for observations. We propose to
observe the spectral region near 7920-7940 Å to identify two 13CN lines
at 7921.13 Å and 7935.67 Å which are very useful for both
12C/13C
isotopic ratio and C, N abundance determination. In the
case of a low 12C/13C ratio (<10) these lines are clearly recognized
(Fujita 1985). However, in stars of high 12C/13C ratio (>20)
both isotopic lines are undetectable. The best candidates for such
observations are GRS 1009-45, A0620-00 and GRS 1124-683. The EB-V in
the direction of these systems is not very high and also optical companions
are not too faint. For the first two systems we predict no carbon detection
while for last one, carbon lines must be visible.
Following Sarna et al. (1995), Marks et al. (1997) and
Marks & Sarna (1998), the isotopic
ratios 12C/13C and 16O/17O can be determined by infrared
observations of the CO bands. Specifically, the bands of 12CO and
13CO around 1.59, 2.3 (2.29, 2.32, 2.35 and 2.38 ![]() m) and 4.6
m) and 4.6 ![]() m (Bernat et al. 1979; Harris & Lambert 1984a,b; Harris et al. 1988) give a direct measurement of the isotopic ratio
12C/13C. If we can estimate also the 16O/17O
ratio then it is possible to determine the secondary mass using computed
sequences. For such observations a 10 m class telescope is necessary.
m (Bernat et al. 1979; Harris & Lambert 1984a,b; Harris et al. 1988) give a direct measurement of the isotopic ratio
12C/13C. If we can estimate also the 16O/17O
ratio then it is possible to determine the secondary mass using computed
sequences. For such observations a 10 m class telescope is necessary.
Our theoretical models show that observations of chemical
abundances may give additional information about the progenitors of SXTs and
also about the mass of the secondary component. To produce the majority of
observed short orbital
period SXTs with a black hole as accretor, the initial secondary mass must be
between 1 and 1.7 ![]() and the initial orbital period (when the secondary is
filling its Roche lobe) between 0.5 and 1 d. It will be interesting to do
population synthesis analyses to see how many systems it is possible to
produce in the suggested orbital period - secondary mass range.
Having data about observed C, N, O and their isotope abundances it is
possible to estimate the mass of the secondary component.
Non-conservative evolution (in the sense of the orbital angular momentum
loss from the system) is able to explain satisfactorily the observed mass
ratio and orbital period distributions. From our analysis one can conclude
that the black hole masses are between 5 and 10
and the initial orbital period (when the secondary is
filling its Roche lobe) between 0.5 and 1 d. It will be interesting to do
population synthesis analyses to see how many systems it is possible to
produce in the suggested orbital period - secondary mass range.
Having data about observed C, N, O and their isotope abundances it is
possible to estimate the mass of the secondary component.
Non-conservative evolution (in the sense of the orbital angular momentum
loss from the system) is able to explain satisfactorily the observed mass
ratio and orbital period distributions. From our analysis one can conclude
that the black hole masses are between 5 and 10 ![]() ,
which agrees
well with Bailyn et al. (1998)
results, who compiled the observations of the mass functions and the best
estimates of the mass ratios and inclinations and concluded that the
black hole masses were clustered near 7
,
which agrees
well with Bailyn et al. (1998)
results, who compiled the observations of the mass functions and the best
estimates of the mass ratios and inclinations and concluded that the
black hole masses were clustered near 7 ![]() .
.
Acknowledgements
EE thanks Dr. D. Hannikainen for careful reading this paper and useful remarks. EE acknowledges warm hospitality of the Astronomical Observatory of Helsinki University where this paper was prepared. MJS thanks prof. P. Charles for very useful discussions during his stay at the University of Southampton. We thank the anonymous referee for his/hers very constructive referee opinion which really improved the text of this paper. This work was partially supported by a grant No. 157992 from the Academy of Finland to Dr. Osmi Vilhu and ESF grant No. 4338. In Warsaw, this work has been supported through grants 2-P03D-014-13 and 2-P03D-005-16 by the Polish National Committee for Scientific Research and by the NATO Collaborative Linkage Grant PST.CLG.977383.