A&A 373, 1089-1098 (2001)
DOI: 10.1051/0004-6361:20010678
Numerical simulations of kink instability
in line-tied coronal Loops
C. L. Gerrard1 - T. D. Arber2 - A. W. Hood1 - R. A. M. Van der Linden3
1 - School of Mathematics and Statistics, University of St
Andrews, North Haugh, St Andrews, Fife KY16 9SS, Scotland
2 - Space and
Astrophysics Group,Physics Department, University of Warwick, Coventry, CV4 7AL,
UK
3 - Koninklijke Sterrenwacht van Belgie, Ringlaan 3, 1180 Ukkel, Belgium
Received 13 December 2000 / Accepted 9 May 2001
Abstract
The results from numerical simulations carried out using a new shock-capturing,
Lagrangian-remap, 3D MHD code, Lare3d are presented. We study the
evolution of the m=1 kink mode instability in a photospherically line-tied
coronal loop that has no net axial current. During the non-linear evolution of
the kink instability, large current concentrations develop in the neighbourhood
of the infinite length mode rational surface. We investigate whether this strong
current saturates at a finite value or whether scaling indicates current sheet
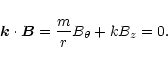
formation. In particular, we consider the effect of the shear, defined by
 where
where
 is the fieldline twist of the loop, on the current concentration. We also include a non-uniform resistivity in the simulations and observe the amount of free magnetic energy released by magnetic reconnection.
Key words: MHD - Sun
Solar flares are a clear manifestation of the dramatic conversion of
magnetic energy into heat and motion. Large two-ribbon flares involve
the complete destruction of a magnetic structure and are frequently
associated with prominence eruptions and coronal mass ejections.
Smaller compact loop flares appear as a brightening in an individual
loop but the loop structure is not destroyed and the energy released
is substantially smaller. Both of these types of flares occur
extremely rapidly, on a timescale comparable to the coronal Alfvén
timescale, and involve the release of magnetic energy. This paper is
concerned with the non-linear magnetic instabilities which may be responsible
for compact loop flares.
The Alfvén timescale,
 ,
for a loop of length
,
for a loop of length
 m,
magnetic field strength of 100 Gauss and number density
m,
magnetic field strength of 100 Gauss and number density
 m-3 is of the order of a few seconds. This is comparable
to the rise time at the start of a flare, suggesting that the initial
instability is due to an Alfvénic process. An obvious candidate for
generating such fast processes is
an an ideal MHD instability. However, the problem here is that the magnetic
topology is conserved in an ideal MHD and the amount of magnetic energy
that can be released as kinetic energy is quite small. Resistivity must be
included so that field line topologies with lower magnetic energy can be reached
by reconnection, releasing kinetic energy and, through ohmic dissipation, heat.
m-3 is of the order of a few seconds. This is comparable
to the rise time at the start of a flare, suggesting that the initial
instability is due to an Alfvénic process. An obvious candidate for
generating such fast processes is
an an ideal MHD instability. However, the problem here is that the magnetic
topology is conserved in an ideal MHD and the amount of magnetic energy
that can be released as kinetic energy is quite small. Resistivity must be
included so that field line topologies with lower magnetic energy can be reached
by reconnection, releasing kinetic energy and, through ohmic dissipation, heat.
Magnetic reconnection can occur in several ways. For example, it may
occur through the non-linear
development of a resistive instability, such as the tearing mode. However
the timescale for this is of the order
 ,
where
is the Alfvén timescale defined above and
,
where
is the Alfvén timescale defined above and
 is the magnetic diffusion timescale. For typical coronal conditions
the tearing mode timescale is the order of a day and, hence, is too slow
to be responsible for a compact loop flare. Alternatively, magnetic reconnection can
be driven and, indeed, may be driven at the Alfvén speed making it a viable
mechanism for magnetic energy release. Reconnection only occurs when
the gradients in the magnetic field are sufficiently large. The required magnitude of these
gradients depends on the Lundquist number, defined as
is the magnetic diffusion timescale. For typical coronal conditions
the tearing mode timescale is the order of a day and, hence, is too slow
to be responsible for a compact loop flare. Alternatively, magnetic reconnection can
be driven and, indeed, may be driven at the Alfvén speed making it a viable
mechanism for magnetic energy release. Reconnection only occurs when
the gradients in the magnetic field are sufficiently large. The required magnitude of these
gradients depends on the Lundquist number, defined as
 ,
and must
be larger if the value of the Lundquist number is larger. In this paper we refer
to the Lundquist number, rather than the more commonly used magnetic Reynolds
number, because we use the Alfvén speed as the reference speed rather than a typical flow speed. The
key problem, in this case, is to explain how reconnection
can be driven on an Alfvénic timescale. A possible mechanism is the
build-up of large gradients in the current in a narrow region as a consequence
of the non-linear development of an ideal MHD instability. Thus, reconnection can occur and the
magnetic field can be carried, by the instability, into the
reconnection region on a timescale related to the growth time of an
ideal MHD instability, namely the order of the Alfvénic timescale. For
further details of considerations about reconnection see Priest & Forbes
(2000) and references therein.
,
and must
be larger if the value of the Lundquist number is larger. In this paper we refer
to the Lundquist number, rather than the more commonly used magnetic Reynolds
number, because we use the Alfvén speed as the reference speed rather than a typical flow speed. The
key problem, in this case, is to explain how reconnection
can be driven on an Alfvénic timescale. A possible mechanism is the
build-up of large gradients in the current in a narrow region as a consequence
of the non-linear development of an ideal MHD instability. Thus, reconnection can occur and the
magnetic field can be carried, by the instability, into the
reconnection region on a timescale related to the growth time of an
ideal MHD instability, namely the order of the Alfvénic timescale. For
further details of considerations about reconnection see Priest & Forbes
(2000) and references therein.
So magnetic reconnection may be driven by a build-up of current due
to an ideal MHD instability. The idea is attractive but it does depend
on the non-linear development of the instability producing a region with large
current. If the instability saturates and the maximum current
reaches a finite value, then the Lundquist number must be smaller than a
particular, critical value for reconnection to occur. The value of the coronal
resistivity, and hence the Lundquist number, is unknown making it
difficult to estimate this critical value. However, if the ideal MHD instability
produces a current sheet, an infinitely thin region of infinite current density
in the strict mathematical sense through which the magnetic field changes direction, then, regardless of the value of the
coronal resistivity, reconnection will always occur and
magnetic energy will be converted into heat and motion. Hence, numerical
simulations based on a larger value of the resistivity will produce
qualitatively correct results. Thus, it is
important to understand the conditions under which the non-linear stage of
an ideal MHD instability produces a current sheet.
At this point it may be
useful to explain the difference between a current sheet and a current
concentration. A current concentration is a large build up of current but the
current will saturate at some value whereas for a current sheet the current is
infinite and therefore there is no saturation. Numerically a current sheet can be
recognised through the fact that the maximum value of the current will increase
with higher grid resolution. Therefore to check for current sheet formation, we
carry out simulations on different grid resolutions and see how the maximum
current scales. If it does not continually increase with higher resolution, flattening off at some value
then we have saturation of the current and a current concentration has formed
rather than a current sheet.
There is compelling theoretical evidence that once the electron fluid slow
speed,  ,
exceeds the phase velocity of the ion-acoustic mode,
,
exceeds the phase velocity of the ion-acoustic mode,
 ,
that ion-acoustic turbulence would have a profound effect on current sheet
development. Indeed Bychenkov et al. (1988) have shown that under a
wide range of conditions the effective anomalous resistivity is a function of
,
that ion-acoustic turbulence would have a profound effect on current sheet
development. Indeed Bychenkov et al. (1988) have shown that under a
wide range of conditions the effective anomalous resistivity is a function of
 (or
(or  )
and adjusts to keep
)
and adjusts to keep
 .
Thus an effective formula for anomalous resistivity would be,
.
Thus an effective formula for anomalous resistivity would be,
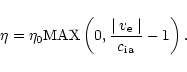 |
(1) |
In this paper we assume that
 and take,
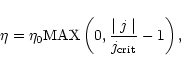 |
(2) |
where
 .
.
This theory would suggest that the largest current density which would evolve in
an unstable loop would have
 .
If we take,
.
If we take,
 |
(3) |
then to reach this
 we would require a scale length collapse to
 where,
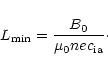 |
(4) |
For
B0 = 100G,
 m-3 and
 ms-1 this gives L=765 m. Taking the loop radius to be
  Mm
this gives a difference in scale lengths of around 1300. Thus to fully resolve
current densities up to
would require grids of around
50003. This estimate is based on a uniform grid. Allowing for stretched grids
this can be reduced but only to around 30003. This is because the
higher resolution is needed around the rational surface but Lare3d uses a Cartesian grid so this amounts to having a fine, but
uniform, grid over the central region and then stretching to larger
spacing in the potential field outer region. The central region must still
be capable of resolving the 1300 times difference in scale lengths and the
boundary must be remote from the central column. This problem would be
ideally suited to an adaptive mesh approach but Lare3d is currently
fixed grid. Here we are limited to 2513 grids and so cannot reach the
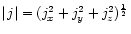
fully resolved limit. Our measure of current concentration formation is
taken throughout to be
Mm
this gives a difference in scale lengths of around 1300. Thus to fully resolve
current densities up to
would require grids of around
50003. This estimate is based on a uniform grid. Allowing for stretched grids
this can be reduced but only to around 30003. This is because the
higher resolution is needed around the rational surface but Lare3d uses a Cartesian grid so this amounts to having a fine, but
uniform, grid over the central region and then stretching to larger
spacing in the potential field outer region. The central region must still
be capable of resolving the 1300 times difference in scale lengths and the
boundary must be remote from the central column. This problem would be
ideally suited to an adaptive mesh approach but Lare3d is currently
fixed grid. Here we are limited to 2513 grids and so cannot reach the
fully resolved limit. Our measure of current concentration formation is
taken throughout to be
 ,
the infinite norm supremum current
density. In the continuous limit this is itself undefined. However, for
the finite resolutions considered here, this is just the
maximum grid based current density and is a sensible, and finite,
measure.
,
the infinite norm supremum current
density. In the continuous limit this is itself undefined. However, for
the finite resolutions considered here, this is just the
maximum grid based current density and is a sensible, and finite,
measure.
As in previous work, the equilibrium coronal loop is modelled as a cylindrical
structure with axial, Bz, and azimuthal,
 ,
magnetic field components that are
just functions of the radial co-ordinate. Linear stability theory has shown
that a current sheet is likely to
form at a mode rational surface if the loop is of infinite length.
For perturbations of the form
,
magnetic field components that are
just functions of the radial co-ordinate. Linear stability theory has shown
that a current sheet is likely to
form at a mode rational surface if the loop is of infinite length.
For perturbations of the form
a mode rational surface is the radius, for given values of the wavenumbers mand k, at which
 |
(5) |
However, coronal loops do not have an infinite length and the ends of
the magnetic fields, the footpoints, are located in the
dense solar photosphere. This means that the coronal magnetic field lines are
inertially line-tied to the photosphere and the simplest way of
simulating the dense photosphere is to assume that all components of
the plasma velocity vanish at the footpoints. Discussions of the
relevant photospheric boundary conditions can be found in Hood (1986); Velli
et al. (1990); Van der Linden et al. (1994).
One immediate consequence of photospheric line-tying is that mode
rational surfaces do not exist mathematically (Velli et al. 1990). However, the linear
instabilities still exhibit regions where the current gradient does indeed
build-up. The non-linear behaviour is not really known and it is
important to determine whether current sheet formation is a natural
consequence of an ideal MHD instability when photospheric line-tying
is included.
The three-dimensional evolution of the kink instability in coronal loops has recently been
investigated by various authors. Some of these (Baty & Heyvaerts 1996;
Baty 1997a,b; Baty et al. 1998) found that a non-singular current concentration
formed during the non-linear evolution of the instability.
In contrast, other authors (Bazdenkov & Sato 1998; Lionello et al. 1998; Arber
et al. 1999;
Baty 2000a,b) have observed indications of current sheet formation rather than
the formation of a non-singular current concentration.
In this paper we again investigate the question of current sheet formation. In
particular we consider the suggestion of Baty (2000a) that saturation of the current
may be difficult to observe for loops of large shear and that this may explain
the apparently contradictory results on current sheet formation during the
non-linear evolution of the kink instability. We, therefore, consider
two initial equilibria one of which has shear of 6.32 whilst the second is
defined such that we can vary the shear. We present results for the second
equilibrium with shear between 1.67 and 9.42. We carry out the numerical
simulations using a new 3D MHD code, Lare3d (Arber et al. 1999) which is
described in Sect. 2. The equilibria are defined in Sect. 3 and the results
for the non-linear and resistive evolution are presented in Sect. 4. Finally
in Sect. 5 we discuss how the shear affects the non-linear evolution. In particular, we concentrate on whether we
observe saturation of the currents or scaling indicative of current sheet formation and present
results for the resistive evolution of the instability.
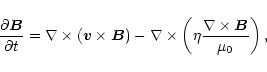
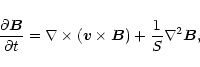
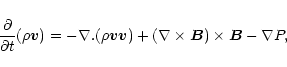
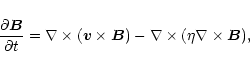
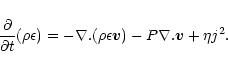
The non-linear evolution of the loop is modelled by the MHD equations,
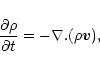 |
(6) |
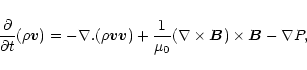 |
(7) |
 |
(8) |
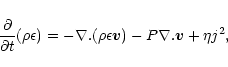 |
(9) |
with specific energy density,
 |
(10) |
 is the magnetic field,
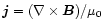 is the current density,
  is the velocity, P is the thermal
pressure,
is the velocity, P is the thermal
pressure,  is the specific energy density (
 ),
),
 is the mass density,
  is the resistivity, and
 is the magnetic permittivity. We ignore the effects
of thermal conduction, radiation and heating, apart from ohmic heating. Also
since the scale height in the corona is relatively large (approximately 100 Mm) compared to the height of the loops (10 - 50 Mm) we neglect the
effect of gravity.
is the magnetic permittivity. We ignore the effects
of thermal conduction, radiation and heating, apart from ohmic heating. Also
since the scale height in the corona is relatively large (approximately 100 Mm) compared to the height of the loops (10 - 50 Mm) we neglect the
effect of gravity.
The equations are made dimensionless by setting,
where a tilde denotes a dimensionless variable.  is the Alfvén speed given by
 ,
,
 is the Alfvén transit time,
 .
Often the normalisation adopted in MHD studies is to
take
.
Often the normalisation adopted in MHD studies is to
take
 so that for uniform resistivity we
can write Eq. (8) as,
so that for uniform resistivity we
can write Eq. (8) as,
 |
(11) |
and then specify S. However, as already discussed we do not use uniform
resistivity and consequently we have kept a normalised
explicitly in the
equations by taking
 .
This is then chosen to
prevent
.
This is then chosen to
prevent
 from greatly exceeding
,
for reasons already
discussed earlier and in Arber et al. (1999).
Thus
we obtain the dimensionless equations, removing the tildes from the dimensionless quantities,
from greatly exceeding
,
for reasons already
discussed earlier and in Arber et al. (1999).
Thus
we obtain the dimensionless equations, removing the tildes from the dimensionless quantities,
 |
(12) |
 |
(13) |
 |
(14) |
 |
(15) |
We consider both the ideal evolution ( )
and the resistive evolution of
the instability. The choice of the form for the resistivity follows Arber
et al. (1999). We take, in dimensionless variables,
)
and the resistive evolution of
the instability. The choice of the form for the resistivity follows Arber
et al. (1999). We take, in dimensionless variables,
| |
(16) |
such that the resistivity will be switched on only once the current has exceeded
some critical value.
The simulations are carried out using a 3D MHD, Lagrangian remap, shock
capturing code (Lare3d). The Lagrangian step is fully 3D, uses the
predictor-corrector method and artificial
viscosity. The remap step uses Van Leer gradient limiters (Van Leer 1997),
applied to the density, specific energy density, velocities and magnetic fluxes, to
ensure that it is monotonicity preserving. Furthermore, Lare3d uses Evans and
Hawley constrained transport (Evans & Hawley 1988) to guarantee that if
 is initially zero it is maintained at zero to machine precision
throughout the evolution. The
numerical grid is staggered so that the density, pressure and specific energy
density are defined at the cell centres; the velocities at the vertices; the
magnetic field components at the cell faces and the current components along
the edges of the numerical cell.
is initially zero it is maintained at zero to machine precision
throughout the evolution. The
numerical grid is staggered so that the density, pressure and specific energy
density are defined at the cell centres; the velocities at the vertices; the
magnetic field components at the cell faces and the current components along
the edges of the numerical cell.
 and the resistivity are defined at the same vertices
as the velocities. The staggered grid reduces the amount of averaging required
in some of the calculations, thus reducing the associated error, and removes
chequerboard biasing. Further details of the code are given in Arber et al. (2001). This code has many similarities with the ZEUS code (Stone &
Norman 1992a,b). The major difference is that by using a second order
Lagrangian step to treat all of the physics there is no need to adopt
MOC techniques to upwind in the Alfvén waves. Indeed, there is no
upwinding at all as the Lagrangian step does not include advection terms.
The remap step is the only stage in which Van Leer limiters are needed
and this is purely geometrical, i.e. upwinding is not an issue. The
velocity components are also defined on cell vertices, not face centred
as in ZEUS, to reduce checkerboard biasing.
and the resistivity are defined at the same vertices
as the velocities. The staggered grid reduces the amount of averaging required
in some of the calculations, thus reducing the associated error, and removes
chequerboard biasing. Further details of the code are given in Arber et al. (2001). This code has many similarities with the ZEUS code (Stone &
Norman 1992a,b). The major difference is that by using a second order
Lagrangian step to treat all of the physics there is no need to adopt
MOC techniques to upwind in the Alfvén waves. Indeed, there is no
upwinding at all as the Lagrangian step does not include advection terms.
The remap step is the only stage in which Van Leer limiters are needed
and this is purely geometrical, i.e. upwinding is not an issue. The
velocity components are also defined on cell vertices, not face centred
as in ZEUS, to reduce checkerboard biasing.
As in previous simulations, the coronal loop is modelled as an initially straight
cylinder. This can be justified as coronal loops generally have aspect ratios
(ratio of length to width) of order 10 and it also allows for comparison with
previous work. The loop has length Lz with line-tying boundary
conditions imposed at
z = -Lz /2 and
z = Lz /2. The code is written in
Cartesian co-ordinates with the numerical box stretching from -Lx /2 to
Lx /2 and -Ly /2 to Ly /2. While not the appropriate geometry for
the linear instabilities the use of Cartesian geometry does remove the problems
associated with the singular nature of the axis at r = 0. Cylindrical
co-ordinates would be preferable for the equilibrium but the m=1 instability
corresponds to a lateral displacement of the axis and thus the 1/r dependence
would be a problem. Also, we had no prior reason to think that the fully
non-linear developed stage would preserve any cylindrical symmetry. The use of
Cartesian co-ordinates does have limitations but has been shown to reproduce
the cylindrically symmetric eigenvalues (Arber et al. 1999) and to
accurately find m=0 and m=1 growth rates.
The values of Lx and Ly are chosen such that the boundary conditions imposed in the x and y directions
have no effect on the evolution of the loop, which remains localised within a
smaller region.
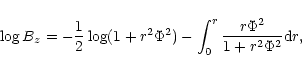
We solve the linear equations to establish the critical lengths for the equilibria
and the form of the eigenmodes. Solving the Hain-Lust
equations (Goedbloed 1983), gives
the maximum growth rate and the corresponding value of the axial wavenumber, k. From the linearised
MHD equations for line-tied loops of finite length, we find the growth rates for finite lengths of the loop, the
length for marginal stability and the form of the eigenfunctions. From these
results we can choose the length of the loop, Lz, such that it is unstable
and we can use an initial velocity perturbation based on the eigenmodes to speed
up the development of the instability.
In this paper we consider two equilibria. The first has a shear of 6.32 at the
mode rational surface, where
the shear is defined as
 |
(17) |
the twist is defined by,
 |
(18) |
The second equilibrium was chosen so that we could vary
the shear and thus investigate the effect of shear on the formation of
current sheets.
Equilibrium 1, is defined by specifying
,
 |
= |
 |
(19) |
This gives
 at r=1.0 and
jz = 0.0 at r=1.0 - there is
no net axial current in the loop.
The axial field component is obtained from,
at r=1.0 and
jz = 0.0 at r=1.0 - there is
no net axial current in the loop.
The axial field component is obtained from,
 |
(20) |
as,
Bz = 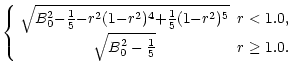 |
(21) |
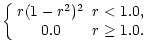
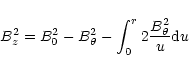
Bz2 must remain positive hence we choose
B0 = 0.5, and run the
equilibrium for a uniform density of 1.0. We consider four forms for the pressure:
pressure, P = 0 ( )
and pressure given by a plasma
)
and pressure given by a plasma  of 10-2, 10-3 and 10-4. This initial equilibrium configuration gives the twist and shear profiles shown in Fig. 1.
Since the equilibrium current is confined within a radius of 1 we take
Lx = Ly
= 5 and we stretch the grid in the x and y directions such that 50% of
the points lie within r = 1.1. The results for the linear
evolution provide the critical length of the
loop and the form of a suitable velocity perturbation to start the non-linear
simulations. Thus,
 since the critical half-length of the loop is approximately 2.2. This gives a
length of loop which exceeds the critical length guaranteeing that the loop is
unstable to the m=1 kink mode and taking this larger value for the length
speeds up the evolution of the instability.
since the critical half-length of the loop is approximately 2.2. This gives a
length of loop which exceeds the critical length guaranteeing that the loop is
unstable to the m=1 kink mode and taking this larger value for the length
speeds up the evolution of the instability.
The second equilibrium configuration (Equilibrium 2) is chosen so that the value
of the shear may be chosen as either small (< 6) or large (> 6). This
equilibrium is defined by specifying the twist,
 = = 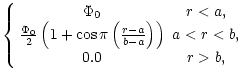 |
(22) |
where a, b and  are variables. The magnetic field components can
then be calculated from,
are variables. The magnetic field components can
then be calculated from,
 |
(23) |
and,
 |
(24) |
The integral in Eq. (23) is evaluated numerically. As above, the
density is assumed uniform and the plasma pressure is taken as zero. The values
of a, b, and
are varied to adjust the value of the shear at the
mode rational surface (whose position also varies with a, b and
). Figure 2 shows the twist and shear profiles for the
configuration with
 ,
a = 0.5 and b = 2.0. Unlike Equilibrium 1, the
twist is a monotonically decreasing function of radius.
,
a = 0.5 and b = 2.0. Unlike Equilibrium 1, the
twist is a monotonically decreasing function of radius.
![\begin{figure}
\par\includegraphics[width=8.8cm,clip]{MS10559f2.ps}\par\end{figure}](/articles/aa/full/2001/27/aa10559/Timg82.gif) |
Figure 2:
The twist and shear profiles for Equilibrium 2 with
,
a =
0.5 and b = 2.0. |
| Open with DEXTER |
For this equilibrium we take
Lx = Ly = 5.0 and
 and
stretch the grid as for Equilibrium 1. Again we use an initial velocity perturbation
based on the linear mode to
speed up the development of the instability.
and
stretch the grid as for Equilibrium 1. Again we use an initial velocity perturbation
based on the linear mode to
speed up the development of the instability.
The non-linear evolution of the instability for Equilibrium 1 is followed using
two non-linear MHD codes. The first is Lare3d. The second is an ideal MHD
Lagrangian code described in Arber et al. (1999).
We run Lare3d for 40 Alfvén times using Equilibrium 1 as the initial equilibrium on an
813, a 1213, a 1613 and a 2513 grid. This allows us to investigate the
scaling of the current with higher resolution. For the
case we find
a growth rate of 0.11 whilst for the
 case we find a reduced growth rate of 0.09. The
case
evolves more slowly and hence has smaller currents but otherwise there seems to be no major difference between
the two cases. For the
case we find that the current starts to
build up after 5 Alfvén times at r=0.70 and is shifted outwards to r = 0.75as shown in Fig. 3. This shows that if we have current sheet
formation then it occurs near the mode rational surface (r = 0.69) as would be expected. During the non-linear evolution of the kink instability the whole loop is moved by the instability and since the location of the mode rational surface is shifted the position of the current is also shifted.
case we find a reduced growth rate of 0.09. The
case
evolves more slowly and hence has smaller currents but otherwise there seems to be no major difference between
the two cases. For the
case we find that the current starts to
build up after 5 Alfvén times at r=0.70 and is shifted outwards to r = 0.75as shown in Fig. 3. This shows that if we have current sheet
formation then it occurs near the mode rational surface (r = 0.69) as would be expected. During the non-linear evolution of the kink instability the whole loop is moved by the instability and since the location of the mode rational surface is shifted the position of the current is also shifted.
![\begin{figure}
\par\includegraphics[width=8.8cm,clip]{MS10559f3.ps}\par\end{figure}](/articles/aa/full/2001/27/aa10559/Timg85.gif) |
Figure 3:
Current build-up - plot of
showing background current and a spike of current at r = 0.75. |
| Open with DEXTER |
We also find that the growth rate of the
instability,
 ,
is in good agreement with the value predicted by the linear
results (
,
is in good agreement with the value predicted by the linear
results (
 ). As time increases the current build-up can be
observed as a helical sheet wrapped around the kinked equilibrium
current as shown in Fig. 4. Figure 5 shows a surface plot of
the current at z = 0 with the current build-up clearly much larger than the
equilibrium current profile.
). As time increases the current build-up can be
observed as a helical sheet wrapped around the kinked equilibrium
current as shown in Fig. 4. Figure 5 shows a surface plot of
the current at z = 0 with the current build-up clearly much larger than the
equilibrium current profile.
We have compared these results to those (Longbottom and Bennett, private
communication) from the Lagrangian code. We have run these Lagrangian code
simulations using Equilibrium 1 as the initial equilibrium and using the same
velocity perturbation as for the simulations using Lare3d. For the
case we find a maximum current of 50, 25 times the maximum equilibrium current. As can be seen from Fig. 5 the Lagrangian code simulations also show a large build up of current.
![\begin{figure}
\par\includegraphics[width=5.5cm,clip]{MS10559f5a.ps}\hspace*{1.3cm}%
\includegraphics[width=6cm,clip]{MS10559f5b.ps} \end{figure}](/articles/aa/full/2001/27/aa10559/Timg93.gif) |
Figure 5:
Surface plots of current at z = 0 from Lare3d (left) and the Lagrangian code (right). |
| Open with DEXTER |
For the simulations carried out using Lare3d, on the 813 grid the maximum value of the current is found to be 8.0 whilst
on the 1613 grid the maximum of the current is 15.0 agreeing well with the
expected scaling which would give
 .
Whereas for
,
is 6.0 on the 813 grid and 7.5 on the 1213grid. The scaling of
with higher resolution is shown more clearly, for
all the values of
considered, in
Table 1.
We can see that the current does scale with increased
resolution for the
.
Whereas for
,
is 6.0 on the 813 grid and 7.5 on the 1213grid. The scaling of
with higher resolution is shown more clearly, for
all the values of
considered, in
Table 1.
We can see that the current does scale with increased
resolution for the
 cases. We can therefore state that for Equilibrium 1 which
has a shear of 6.32 we do not observe saturation of the current for
.
cases. We can therefore state that for Equilibrium 1 which
has a shear of 6.32 we do not observe saturation of the current for
.
To investigate the effect of resistivity on the evolution of the instability we
carry out the simulations on a 1213 grid for 60 Alfvén times for the
case and for 80 Alfvén times for
 .
The 1213 grid gives us
reasonably high resolution without taking too much computational time. We do
not run the simulation until the current drops back below
as has been
done in other simulations (Baty 2000a). Instead the simulation is run until the
total accumulated ohmic heating levels off to an (almost) constant value,
i.e. resistive effects become negligible.
.
The 1213 grid gives us
reasonably high resolution without taking too much computational time. We do
not run the simulation until the current drops back below
as has been
done in other simulations (Baty 2000a). Instead the simulation is run until the
total accumulated ohmic heating levels off to an (almost) constant value,
i.e. resistive effects become negligible.
The resistivity has the form, given in Eq. (16)
and in this case we take
 since this is twice the equilibrium
current value and
since this is twice the equilibrium
current value and
 .
This keeps the anomalous
resistivity, the resistivity which we have added to the code to simulate the
resistivity in the plasma, small as would be expected in the solar corona but
ensures that it is larger than the numerical resistivity, inherent in the numerical scheme.
.
This keeps the anomalous
resistivity, the resistivity which we have added to the code to simulate the
resistivity in the plasma, small as would be expected in the solar corona but
ensures that it is larger than the numerical resistivity, inherent in the numerical scheme.
With resistivity included in the code, and indeed localised at current
concentrations, the code allows reconnection and diffusion of
magnetic field lines. In reality this would have occurred on a physically
realistic timescale provided the current concentration seen in the code is
sufficiently large, i.e. for the purposes of this paper the numerical
current concentration can be imagined to be a current sheet.
For
the resistivity is switched on after approximately t = 25 Alfvén times when the current exceeds the critical value. The ohmic heating then increases until t = 40 when it settles to an almost constant value. The current
has a maximum value of
 at t = 40 and then decreases, reaching
a value of 6.0 at t = 60 when we stop the simulation.
at t = 40 and then decreases, reaching
a value of 6.0 at t = 60 when we stop the simulation.
During the non-linear evolution of the instability the central column of current
is shifted outwards into the current sheet region as shown in Fig. 6 at t = 30. It is in this region that we would expect reconnection
to occur. The current drops between t = 40 and t = 55, when the
ohmic heating reaches a constant value, indicating that reconnection is taking
place. Figure 7 shows a selection of magnetic fieldlines at t = 0and the same fieldlines at t = 50, identified by their location on the lower
boundary. It can be seen that the reconnection has resulted in the fieldlines
becoming untwisted.
![\begin{figure}
\par\includegraphics[width=3.2cm,clip]{MS10559f6.eps} %
\par\end{figure}](/articles/aa/full/2001/27/aa10559/Timg100.gif) |
Figure 6:
Isosurface of |j| = 1.2 at t = 30 for the resistive
evolution. |
| Open with DEXTER |
We calculate the amount of free magnetic energy released by considering the energy in the
component of the magnetic field. We find that  of the free magnetic energy is released.
As for the ideal non-linear evolution the
case evolves more
slowly because of its lower growth rate. For this case we run the simulations
for 80 Alfvén times. The central column of current is shifted outwards into the
current concentration region as in the previous case but at a time of 40 Alfvén times. The
current exceeds the critical value at t = 35 Alfvén times and has a maximum of 8.0
at t = 62. It then drops to a value of 5.6 at t = 74. The reconnection releases 47% of the free magnetic energy. This compares favourably with the results of Arber et al. (1999) which suggested 54% and those of Baty (2000) which suggested that 57% of the free magnetic energy was released.
Therefore, we find that during the resistive evolution of the instability
reconnection occurs for both
and
.
The only effect
of taking the plasma
to be zero (a value which is clearly unphysical) is
to speed up the evolution of the instability and so reduce the computational
time.
We run the code using Equilibrium 2 as the initial equilibrium for 45 Alfvén times on
813, 1213, and 1613 grids. We choose different values for a, and b thus varying the shear of the configuration. The results are summarised
in Table 2 along with the scalings which we would expect based on the
1213 grid results. The value of
is calculated by finding the maximum of
and storing it at each timestep. The maximum of these between t = 0 and t = 45, where the simulations are stopped, is then taken to be
.
We take this maximum value rather then the value at t = 45 because once the current has reached the maximum numerical resistivity can cause it to diffuse away.
![\begin{figure}
\par\includegraphics[width=6cm,clip]{MS10559f7a.eps}\hspace*{8mm}%
\includegraphics[width=6cm,clip]{MS10559f7b.eps}\par\end{figure}](/articles/aa/full/2001/27/aa10559/Timg102.gif) |
Figure 7:
A selection of fieldlines at t = 0 (left) and at t = 50 (right). |
| Open with DEXTER |
The shears quoted are calculated at the radius where the numerical results show
the current concentration forming, namely at the mode rational surface. We
consider initial equilibria for which the shear varies between 1.67 and 9.42.
This allows us to investigate the relationship between the shear of the
loop and the formation of current sheets. Our results show no saturation of
the current for runs 1, 2, 3 and 5. In fact runs
1, 2, 3 and 5 show better than expected scaling of the current with higher
resolution implying current sheet formation. For example, consider run 3 with a
shear of 2.02 at the mode rational surface. The maximum value of
is 9.8 on the 813 grid, 14.0 on the 1213 grid and 19.0 on the
1613 grid. This compares favourably with the expected values of 9.4, 14.0,
and 18.6 respectively. However, runs 4, 6, and 7 have lower values of
than was expected and, therefore, require further investigation.
We have carried out higher resolution simulations on some of these
configurations. From the table it appears that runs 1-4 show no sign of current
saturation whereas runs 5-7 may do so. Therefore, we take one example from runs
1-4 and one from runs 5-7 and carry out the simulations on higher resolution. In
these cases we run the simulations on a 2513 grid stretched as before. For
run 7 we found
to be 24.0. This value is exactly the same as that for
the 1613 grid suggesting that the current is saturating and that we do not
observe current sheet formation. However, for run 2 the maximum current is 26.0. This is twice the value on the 1613 grid suggesting that the current
is not saturating.
For this set of equilibria the trend suggests that for higher shear the current
saturates. Lower values of shear have the scaling indicative of current sheet
formation. However for lower shear
is lower so caution is required
here as this may saturate at higher resolution.
We carry out the resistive simulations for run 2 and run 5 with .
The resistive simulations for run 5 are run until t = 60 on a 1213grid. This gives reasonable grid size and would be expected to allow enough time
for the ohmic heating to steady off to a constant value as for Equilibrium 1.
However, the
ohmic heating continues to increase throughout the simulation and in fact
increases after t = 50. The current exceeds the critical value at
about t = 25, switching on the resistivity. It then increases to a value of
13.0 at t = 40 before decreasing to a value of 10.0 at t = 50 and then
increasing again to reach a value of 14.5 at t = 58. Only 33% of the free
magnetic energy has been released by t = 60 when the simulation is stopped.
We run the simulation of the resistive evolution of the instability for run 2 on
an 813 grid. This allows us to run the simulation for longer, in this case
for 100 Alfvén transit times. The behaviour of the current and the ohmic heating
during the evolution is illustrated by Fig. 10. The resistivity is
switched on at t= 30 when the current exceeds
.
The ohmic heating
then increases steadily until t = 60 where it planes off. It takes a constant
value until t = 80 where it increases steeply and is still increasing at
t=100 where the simulation is ended. The current increases to a value of 7.0
at t=40 and then remains at that value until t = 70 when it starts
increasing again reaching a value of 15.0 at t=100. In this case only 15% of
the free magnetic energy is released.
We have no clear explanation of this behaviour at present. This will be the
subject of a separate investigation which we defer until a later date.
![\begin{figure}
\par\includegraphics[width=4cm,clip]{MS10559f8.eps} %
\end{figure}](/articles/aa/full/2001/27/aa10559/Timg104.gif) |
Figure 8:
The isosurface of the current for run 1 with the current concentration
seen as a thin thread wrapped around the central current. |
| Open with DEXTER |
![\begin{figure}
\par\includegraphics[width=3cm,clip]{MS10559f9.eps} %
\end{figure}](/articles/aa/full/2001/27/aa10559/Timg105.gif) |
Figure 9:
The isosurface of the current for run 7
showing the current concentration as a thicker helical ribbon. |
| Open with DEXTER |
Our aim in this paper has been to consider the question of current sheet
formation during the non-linear evolution of the m=1 kink instability. In
particular, we have investigated the effect of shear on current sheet formation
and therefore on magnetic reconnection. To do this we have carried out numerical
simulations of the non-linear and resistive evolution of the kink instability
for two equilibria. Equilibrium 1 has a shear of 6.32 and Equilibrium 2 allows us to vary the shear.
For Equilibrium 1 we find a scaling which is indicative of current sheet formation during the non-linear evolution
of the kink instability for
.
We have carried out simulations on
four different grid resolutions and found that the current does scale with
higher resolution as would be expected for a current sheet. Furthermore the
results from the Lagrangian code confirm this. There is no sign of
saturation of the current. During the resistive evolution reconnection takes
place releasing 41% of the free magnetic energy in the
case and
47% in the more physical
case. This is in good agreement
with previous results such as those of Arber et al. (1999) who found that
 of the free energy is released.
![\begin{figure}
\par\includegraphics[width=8.8cm,clip]{MS10559f10.ps} %
\end{figure}](/articles/aa/full/2001/27/aa10559/Timg107.gif) |
Figure 10:
Plots of the current and ohmic heating during the resistive evolution of
the instability for run 2. |
| Open with DEXTER |
For Equilibrium 2 the evolution appears to be more complicated. As can be seen from Table 2 runs 1, 2, 3, and 5 seem to show scaling indicative of current sheet formation whereas runs
4, 6 and 7 indicate saturation of the current. During the resistive evolution the
ohmic heating steadies off but then increases again and is still increasing when
the simulations are stopped. Similarly the current increases to a certain value,
remains constant for some time but then increases again as shown in Fig. 10. This contrasts with Equilibrium 1
where the ohmic heating steadies off to a constant value and does not increase
again and the current peaks and then falls off. For Equilibrium 1 we find that 41% of the
free magnetic energy is released for the
case but for Equilibrium 2 only
33% of the energy is released for run 5 and just 15% for run 2.
Given these results it is worth considering the differences between Equilibrium 2 and Equilibrium 1,
for which we did not observe current saturation and the differences
between those configurations of Equilibrium 2 which do indicate
current sheet formation and those for which the current saturates. Since Equilibrium 1 has a shear of 6.32
and the shear for Equilibrium 2 varies between 1.76 to 9.42 the value of the shear of the loop
is unlikely to affect the formation of the current sheets. One obvious
difference between Equilibrium 1 and Equilibrium 2 is in the current concentrations themselves. From
Fig. 4 we can see that the current concentration developed during the
non-linear evolution of the kink instability for Equilibrium 1 is an axially wide sheet
wrapped around the kinked central column of current. This is similar to the
current sheets found by Arber et al. (1999). In contrast the current
concentrations observed for Equilibrium 2 are, as shown in Figs. 8 and 9, axially thin and thread-like. Another difference is in the twist
profiles. The second equilibrium is defined in such a way that the twist is
constant for r < a and then decreases monotonically. However this means that
for r<a the field is, in fact, the Gold-Hoyle field which does not have a mode
rational surface and so does not form current sheets (Baty 1997b). While Equilibrium 2 is
not entirely a constant twist field and does have a mode rational surface it may
be that the region of constant twist does affect the formation of current
sheets and therefore reconnection.
In conclusion,
- Our results show that Equilibrium 1 demonstrates the same
behaviour as the equilibrium discussed in Arber et al. (1999) but it has
smaller shear.
- The current does scale with higher resolution for Equilibrium 1 for
indicating current sheet formation.
- Once
resistivity is included in the simulations reconnection occurs releasing nearly
half of the free magnetic energy. This is sufficient energy to explain a compact
loop flare.
- The results from Equilibrium 2 suggest that current sheet
formation does not occur for all equilibria but does not simply depend on the
shear of the loop, as was suggested by Baty (2000).
- The shape and magnitude of the current is dependent on the
internal structure of the loop in a more complex manner than was previously
suggested.
- If the current does not saturate for an equilibrium then reconnection
will release the amount of energy required for a compact loop flare.
Acknowledgements
The authors would like to thank Aaron Longbottom and Keith Bennett for providing
the Lagrangian code simulations and for many useful discussions. The authors
would like to thank Gordon Petrie for providing the fieldline plotting
routine and Gordon Petrie and Steve Brooks for their assistance in using it. The
authors would also like to thank the anonymous referee for many useful
comments. The
simulations were carried out on the UK MHD consortium compaq cluster at the
University of St Andrews funded by JREI/SHEFC.
- Arber, T. D., Longbottom, A. W., Gerrard, C. L.,
& Milne, A. M. 2001, J. Comput. Phys., submitted
In the text
- Arber, T. D., Longbottom, A. W. & Van der Linden, R. A. M. 1999,
ApJ, 517, 990
In the text
NASA ADS
- Baty, H. 1997a, A&A, 318, 621
In the text
NASA ADS
- Baty, H. 1997b, Solar Phys., 172, 249
In the text
NASA ADS
- Baty, H. 2000a, A&A, 353, 1074
In the text
NASA ADS
- Baty, H. 2000b, A&A, 360, 345
In the text
NASA ADS
- Baty, H., & Heyvaerts, J. 1996, A&A, 308, 935
In the text
NASA ADS
- Baty, H., Einaudi, G., Lionello, R., & Velli, M. 1998, A&A, 333, 313
In the text
NASA ADS
- Bazdenkov, S., & Sato, T. 1998, ApJ, 500, 966
In the text
NASA ADS
- Bychenkov, V. Yu., Silin, V. P., & Uryupin, S. A. 1988, Phys. Rep., 164, 119
- Caramana, E. J., Shashkov, M. J., & Whalen, P. P. 1998, J. Comput. Phys.,
144, 70
- Evans, C. R., & Hawley, J. F. 1988, ApJ, 332, 659
In the text
NASA ADS
- Goedbloed, J. P. 1983, Rijnhuizen Rep., 83, 145
In the text
- Gold, T., & Hoyle, F. 1960, MNRAS, 120, 89
NASA ADS
- Hood, A. W. 1986, Solar Phys., 105, 307
In the text
NASA ADS
- Lionello, R., Velli, M., Einaudi, G., & Mikic, Z. 1998, ApJ, 494, 840
In the text
NASA ADS
- Priest, E. R., & Forbes, T. 2000, Magnetic Reconnection: MHD
theory and applications, CUP
- Stone, J. M., & Norman, M. L. 1992, ApJS, 80, 753
In the text
NASA ADS
- Stone, J. M., & Norman, M. L. 1992, ApJS, 80, 791
NASA ADS
- Van Der Linden, R. A. M., Hood, A. W., & Goedbloed, J. P. 1995, Solar Phys., 154, 69
- Van Leer, B. 1997, J. Comput. Phys., 135, 229
In the text
- Velli, M., Einaudi, G., & Hood, A. W. 1990, ApJ, 350,
419
In the text
NASA ADS
- Wilkins, M. L. 1980, J. Comput. Phys., 36, 281
NASA ADS
Copyright ESO 2001
![\begin{figure}
\par\includegraphics[width=8.8cm,clip]{MS10559f1.ps}\par\par\end{figure}](/articles/aa/full/2001/27/aa10559/img68.gif)
![\begin{figure}
\par\includegraphics[width=8.8cm,clip]{MS10559f2.ps}\par\end{figure}](/articles/aa/full/2001/27/aa10559/img82.gif)
![\begin{figure}
\par\includegraphics[width=8.8cm,clip]{MS10559f3.ps}\par\end{figure}](/articles/aa/full/2001/27/aa10559/img85.gif)
![\begin{figure}
\par\includegraphics[width=5.5cm,clip]{MS10559f5a.ps}\hspace*{1.3cm}%
\includegraphics[width=6cm,clip]{MS10559f5b.ps} \end{figure}](/articles/aa/full/2001/27/aa10559/img93.gif)
![\begin{figure}
\par\includegraphics[width=6cm,clip]{MS10559f7a.eps}\hspace*{8mm}%
\includegraphics[width=6cm,clip]{MS10559f7b.eps}\par\end{figure}](/articles/aa/full/2001/27/aa10559/img102.gif)
![\begin{figure}
\par\includegraphics[width=8.8cm,clip]{MS10559f10.ps} %
\end{figure}](/articles/aa/full/2001/27/aa10559/img107.gif)