A&A 373, 394-401 (2001)
DOI: 10.1051/0004-6361:20010545
N. Kanekar 1 - T. Ghosh 2 - J. N Chengalur1
1 - National Centre for Radio Astrophysics, Post Bag 3, Ganeshkhind, Pune 411 007, India
2 -
NAIC, Arecibo Observatory, HC 3 Box 53995, Arecibo, PR00612, USA
Received 23 February 2001 / Accepted 6 April 2001
Abstract
We present sensitive Giant Metrewave Radio Telescope (GMRT) and
high-resolution Arecibo HI 21-cm observations of the damped
Lyman-![]() absorber (DLA) at z=0.2212 towards OI 363 (
B2 0738+313).
The GMRT and Arecibo spectra are in excellent agreement and yield a spin
temperature
absorber (DLA) at z=0.2212 towards OI 363 (
B2 0738+313).
The GMRT and Arecibo spectra are in excellent agreement and yield a spin
temperature
![]() K, consistent with earlier lower sensitivity
observations of the system. This value of
K, consistent with earlier lower sensitivity
observations of the system. This value of ![]() is far higher than spin
temperatures measured for the Milky Way and local spirals but is similar to
is far higher than spin
temperatures measured for the Milky Way and local spirals but is similar to ![]() values obtained in the majority of damped absorbers (
values obtained in the majority of damped absorbers (
![]() K).
The high velocity resolution of the Arecibo spectra enables us to obtain
estimates of physical conditions in the absorbing clouds by fitting
multiple Gaussians to the absorption profile. The spectra are well fit by a
three-component model with two narrow and one wide components, with
temperatures
K).
The high velocity resolution of the Arecibo spectra enables us to obtain
estimates of physical conditions in the absorbing clouds by fitting
multiple Gaussians to the absorption profile. The spectra are well fit by a
three-component model with two narrow and one wide components, with
temperatures
![]() K,
K,
![]() K
and
K
and
![]() K, respectively. The last of these is in excellent
agreement with the expected temperatures for the WNM (
5000 - 8000 K). Further, the
mere fact that components are seen with lower temperatures than the
estimated
K, respectively. The last of these is in excellent
agreement with the expected temperatures for the WNM (
5000 - 8000 K). Further, the
mere fact that components are seen with lower temperatures than the
estimated ![]() implies that the absorber must have a multi-phase medium.
We use the measured 21-cm optical depth and the above estimates of the kinetic
temperature to obtain the HI column density in the various components.
The total column density in the narrow components is found to be
implies that the absorber must have a multi-phase medium.
We use the measured 21-cm optical depth and the above estimates of the kinetic
temperature to obtain the HI column density in the various components.
The total column density in the narrow components is found to be
![]() cm-2, while that in the
wide component is
cm-2, while that in the
wide component is
![]() cm-2. Thus,
the WNM contains at least 75% of the total HI in the
z = 0.2212 DLA, unlike
our Galaxy, in which the CNM and WNM have equitable contributions.
As conjectured earlier (Chengalur & Kanekar 2000), this accounts for the
difference in the
spin temperatures of the
z = 0.2212 system and local spirals, suggesting that the
DLA is probably a dwarf or LSB type galaxy; this is also in agreement
with optical studies (Turnshek et al. 2001). Finally, the total column density in
the DLA is found to be
cm-2. Thus,
the WNM contains at least 75% of the total HI in the
z = 0.2212 DLA, unlike
our Galaxy, in which the CNM and WNM have equitable contributions.
As conjectured earlier (Chengalur & Kanekar 2000), this accounts for the
difference in the
spin temperatures of the
z = 0.2212 system and local spirals, suggesting that the
DLA is probably a dwarf or LSB type galaxy; this is also in agreement
with optical studies (Turnshek et al. 2001). Finally, the total column density in
the DLA is found to be
![]() cm-2, which agrees
within the errors with the value of
cm-2, which agrees
within the errors with the value of
![]() cm-2,
obtained from the Lyman-
cm-2,
obtained from the Lyman-![]() profile (Rao & Turnshek 1998). This reinforces
our identification of the wide and narrow components as the WNM and CNM respectively.
profile (Rao & Turnshek 1998). This reinforces
our identification of the wide and narrow components as the WNM and CNM respectively.
Key words: galaxies: evolution: -
galaxies: formation: -
galaxies: ISM -
cosmology: observations -
radio lines: galaxies
Extragalactic gas clouds which lie along the line of sight
to a distant quasar give rise to absorption lines in the quasar spectrum.
For clouds with neutral hydrogen column density
![]() cm-2, the width of the absorption line corresponding to the
Lyman-
cm-2, the width of the absorption line corresponding to the
Lyman-![]() transition is very large because the optical depth is
substantial even in the Lorenzian wings of the line profile. Essentially,
at these column densities, the shape of the absorption profile is
determined not by the Doppler motions of the atoms in the cloud, but
by the natural profile of the line. These high column density systems
(called damped Lyman-
transition is very large because the optical depth is
substantial even in the Lorenzian wings of the line profile. Essentially,
at these column densities, the shape of the absorption profile is
determined not by the Doppler motions of the atoms in the cloud, but
by the natural profile of the line. These high column density systems
(called damped Lyman-![]() absorbers, or DLAs) are rare - the
probability of finding a
DLA in a random search towards a high redshift quasar is
absorbers, or DLAs) are rare - the
probability of finding a
DLA in a random search towards a high redshift quasar is ![]() 0.25 per unit
redshift interval (Storrie-Lombardi & Wolfe 2000). Nonetheless, DLAs contain the bulk of
the observed neutral gas at high redshift (
0.25 per unit
redshift interval (Storrie-Lombardi & Wolfe 2000). Nonetheless, DLAs contain the bulk of
the observed neutral gas at high redshift (![]() )
and are hence logical
candidates for the precursors of today's galaxies.
)
and are hence logical
candidates for the precursors of today's galaxies.
Since quasars are essentially point-like objects in the optical
and UV wavebands, their absorption spectra in these bands contain
information only on the gas illuminated by the narrow pencil beam
of continuum emission from the quasar. It is largely for this reason that
the typical transverse size, luminosity and mass of DLAs remain controversial
despite almost two decades of systematic study. Damped systems at high redshift
have traditionally been assumed to be disk galaxies (e.g. Wolfe 1988).
Some support for this hypothesis is provided by high spectral
resolution optical studies of the absorption profiles of low ionization metals
in the absorbers. These metals have ionization potentials lower than that of
HI, as well as unsaturated line profiles; these profiles thus trace
the kinematics of the neutral gas in the DLA (Lanzetta & Bowen 1992). Prochaska
& Wolfe (1997, 1998; but see Ledoux et al. 1998) used a large sample
of DLAs to argue that the metal line profiles were consistent with those
arising from rapidly rotating massive disks. However, it was later shown that
such profiles could also be generated in a variety of DLA models, ranging from
merging sub-galactic blobs (Haehnelt et al. 1998), to randomly moving clouds
in a spherical halo (McDonald & Miralda-Escude 1999). At low redshifts, Hubble Space Telescope
(HST) and ground-based imaging and spectroscopy can be used to carry out detailed
studies of the galaxies responsible for the damped absorption. These
observations indicate that DLAs are associated with a wide variety of galaxy
types and are not exclusively (or even predominantly) spiral galaxies (Le Brun et al. 1997; Rao & Turnshek 1998; Turnshek et al. 2000). In this paper, we will discuss HI 21-cm observations
of the DLA at z=0.2212 toward the radio-loud quasar OI 363 (
B2 0738+313); this
absorber has been identified by recent studies as a dwarf,
or possibly LSB-type, galaxy, with luminosity
![]() (Turnshek et al. 2001; Cohen 2001).
(Turnshek et al. 2001; Cohen 2001).
HI 21-cm absorption was first detected in the DLA at z=0.2212 by Lane et al. (1998),
using the Westerbork Synthesis Radio Telescope (WSRT); these observations,
however, only marginally resolved the line. A higher sensitivity, higher resolution
spectrum using the Giant Metrewave Radio Telescope (GMRT) was presented by Chengalur
& Kanekar (1999). This 21-cm profile showed a single, narrow component with
FWHM ![]() km s-1 and was used to estimate the spin temperature
of the absorbing gas. This was found to be quite high,
km s-1 and was used to estimate the spin temperature
of the absorbing gas. This was found to be quite high,
![]() K.
In the Galaxy, gas with a temperature of
K.
In the Galaxy, gas with a temperature of ![]() 1000 K is unstable. In standard
models of the galactic interstellar medium (ISM) (Wolfire et al. 1995; Kulkarni & Heiles 1988),
neutral hydrogen exists in only two stable phases, a cold phase at
1000 K is unstable. In standard
models of the galactic interstellar medium (ISM) (Wolfire et al. 1995; Kulkarni & Heiles 1988),
neutral hydrogen exists in only two stable phases, a cold phase at ![]() 80 K
and a warm phase at
80 K
and a warm phase at ![]() 8000 K. For a multi-phase medium, however, the measured
spin temperature is the column
density weighted harmonic mean of the temperatures of the different phases.
It was hence proposed that the high values of
8000 K. For a multi-phase medium, however, the measured
spin temperature is the column
density weighted harmonic mean of the temperatures of the different phases.
It was hence proposed that the high values of ![]() estimated for this and other DLAs
were due to a substantial fraction of their neutral gas being in the warm phase
(Chengalur & Kanekar 2000; Kanekar & Chengalur 2001).
estimated for this and other DLAs
were due to a substantial fraction of their neutral gas being in the warm phase
(Chengalur & Kanekar 2000; Kanekar & Chengalur 2001).
Here, we present high-resolution Arecibo HI 21-cm observations of the z=0.2212 absorber, supplemented by a deep GMRT 21-cm observation of the system. These observations enable us to directly determine the kinetic temperature of the absorbing gas and thus, to distinguish between the warm and cold phases. We find, as conjectured previously, that the bulk of the gas is indeed in the warm phase, which contains at least three-fourths of the total HI along this line of sight. This is the second DLA for which it has been observationally established that a high spin temperature is due to a preponderance of gas in the warm neutral medium; Lane et al. (2000) show that this phase contains at least two-thirds of the gas in a DLA at z=0.0912 (also, coincidentally, towards OI 363).
The rest of the paper is organised as follows: the GMRT and Arecibo
observations and data analysis are described in Sect. 2.
Section 3 presents the absorption spectra; the spin temperature
of the absorber and the temperatures of the different absorbing components
are also estimated here. Finally, Sect. 4 discusses our results
both in the context of observations of the
z = 0.2212 DLA at other wavelengths,
and with respect to their general implications for the nature of systems which give rise
to damped Lyman-![]() absorption.
absorption.
The z = 0.2212 absorber towards OI 363 was observed on a number of occasions in February, April and August 2000, using the 305-m Arecibo radio telescope. All observations were done in total power mode, with the "L-wide'' receiver, using 9-level sampling for the auto-correlation spectrometer. Two orthogonal circular polarization channels were observed simultaneously. The first two sessions (in February and April 2000) used bandwidths of 3.125 and 6.25 MHz, centred at a heliocentric redshift of z = 0.2212, and divided into 2048 channels. This yielded velocity resolutions of 0.3935 and 0.79 km s-1 respectively.
OI 363 has substantial continuum flux density (![]() 2 Jy) at L band and the
bandpass is hence dominated by systematics due to standing wave patterns.
To improve the bandpass calibration, the observations were carried out in
a "double switched'' mode. OI 363 was observed first, followed by an
observation of blank sky. Next, a similar position-switched observation
was made for a nearby source, OI 371 (B 0742+318, flux density
2 Jy) at L band and the
bandpass is hence dominated by systematics due to standing wave patterns.
To improve the bandpass calibration, the observations were carried out in
a "double switched'' mode. OI 363 was observed first, followed by an
observation of blank sky. Next, a similar position-switched observation
was made for a nearby source, OI 371 (B 0742+318, flux density ![]() 1.4 Jy).
OI 363 and OI 371 have very similar
declinations and continuum flux densities; the observations were so timed that
the alt-az track of the feed was almost the same for all phases of the observing
cycle. Each of these phases was
1.4 Jy).
OI 363 and OI 371 have very similar
declinations and continuum flux densities; the observations were so timed that
the alt-az track of the feed was almost the same for all phases of the observing
cycle. Each of these phases was ![]() 4 min long (with 5-second data records) and this
cycle was repeated on each observing day for as long as the sources were visible from Arecibo.
All observations were carried out at night, to minimise solar effects.
The total on-source time for OI 363 was about 9 hours.
4 min long (with 5-second data records) and this
cycle was repeated on each observing day for as long as the sources were visible from Arecibo.
All observations were carried out at night, to minimise solar effects.
The total on-source time for OI 363 was about 9 hours.
A second set of observations was carried out in August 2000, with
the aim of better resolving the narrow absorption components seen in the
initial Arecibo observations. Far smaller bandwidths of 0.781 and 0.195 MHz were
hence used, again divided into 2048 channels, and with two polarizations
at each setting. This gave velocity resolutions of
![]() 0.099 and
0.099 and ![]() 0.025 km s-1 respectively. These observations
were carried out in the standard on-off position switching mode (i.e.
a single blank sky spectrum was used to calibrate the bandpass), since
the wider of the two bandwidths (0.781 MHz) was narrower in frequency
than one cycle of the standing
wave ripple (which is
0.025 km s-1 respectively. These observations
were carried out in the standard on-off position switching mode (i.e.
a single blank sky spectrum was used to calibrate the bandpass), since
the wider of the two bandwidths (0.781 MHz) was narrower in frequency
than one cycle of the standing
wave ripple (which is ![]() 1 MHz at Arecibo). Each on-off cycle was of
five minutes duration, sub-divided into 1-second records. The total
on-source time was
1 MHz at Arecibo). Each on-off cycle was of
five minutes duration, sub-divided into 1-second records. The total
on-source time was ![]() 35 min.
35 min.
The data for both sets of observations were reduced using the
Arecibo software package ANALYZ. For the February and April
observations, each four-minute spectrum was initially inspected for radio
frequency interference (RFI). If interference was seen, the individual
5-s records of the four-minute run were passed through a standard
RFI excision program, and all records with strong (
![]() )
features
were removed. Each four-minute spectrum was also inspected for the
presence of standing waves. It was found that the fluctuations on each
such position-switched spectrum were indeed dominated by standing waves
across the bandpass. However, when an OI 363 spectrum was divided
by the corresponding spectrum of OI 371 using the formula,
)
features
were removed. Each four-minute spectrum was also inspected for the
presence of standing waves. It was found that the fluctuations on each
such position-switched spectrum were indeed dominated by standing waves
across the bandpass. However, when an OI 363 spectrum was divided
by the corresponding spectrum of OI 371 using the formula,
![\begin{displaymath}{\rm Spectrum} = \left[ \frac{ {\rm On - Off}}{{\rm Off}} \ri...
... \frac{ {\rm On - Off}}{{\rm Off} } \right]_{{\rm OI~371}} \;
\end{displaymath}](/articles/aa/full/2001/26/aah2726/img22.gif) |
(1) |
The basic data editing for the August spectrum was carried out
in a similar manner. Here, however, the individual five-minute spectra
were obtained by the formula
![\begin{displaymath}{\rm Spectrum} = { \left[ \frac{ {\rm On - Off}}{{\rm Off}} \right]_{{\rm OI~363}} } .
\end{displaymath}](/articles/aa/full/2001/26/aah2726/img23.gif) |
(2) |
For all data sets, the above procedure was carried out separately for the two polarizations. Individual four- and five-minute spectra were averaged together (using the appropriate weights) to produce the final spectrum for each bandwidth. A linear baseline was then fitted to these spectra (excluding the location of the line) and subtracted. Finally, the spectra were divided by the mean continuum flux density to convert them into optical depth (since the line is optically thin, a simple division by the continuum level suffices to convert from flux density into optical depth).
GMRT observations of the
z = 0.2212 absorber were carried out on
19 October, 2000. The standard 30-station FX correlator, which gives
a fixed number of 128 channels over a bandwidth which can be varied between
64 kHz and 16 MHz, was used as the backend. A bandwidth of 1 MHz was used
for the observations, yielding a spectral resolution of ![]() 2.0 km s-1.
3C147 and 3C286 were used to calibrate the absolute flux density scale and system bandpass;
no phase calibrator was used since OI 363 is itself unresolved by the GMRT.
The total on-source time was around four and a half hours, with sixteen
antennas present.
2.0 km s-1.
3C147 and 3C286 were used to calibrate the absolute flux density scale and system bandpass;
no phase calibrator was used since OI 363 is itself unresolved by the GMRT.
The total on-source time was around four and a half hours, with sixteen
antennas present.
The data were analysed in AIPS using standard procedures. The analysis
was fairly straightforward since there is negligible extended emission
in the OI 363 field. Continuum emission was subtracted by fitting a
linear baseline to the U-V visibilities, using the AIPS task UVLIN.
The continuum subtracted data were then mapped in all frequency channels and a spectrum
extracted at the quasar location from the resulting three-dimensional
data cube. Spectra were also extracted at other locations in the cube to
ensure that the data were not corrupted by interference. A spectrum was
also obtained by simply vector averaging the U-V visibilities together,
using the AIPS task POSSM. Since the two methods are essentially equivalent
for the present case of a point source at the telescope phase centre, we
use the POSSM spectrum in the discussion below. The RMS noise on this spectrum
is ![]() 2.8 mJy, while the flux density of OI 363 was measured to be 2.25 Jy.
Our experience with the GMRT indicates that the flux density calibration is reliable to
2.8 mJy, while the flux density of OI 363 was measured to be 2.25 Jy.
Our experience with the GMRT indicates that the flux density calibration is reliable to
![]() 15%, in this observing mode.
15%, in this observing mode.
The spectra are shown in Figs. 1 and 2.
Figure 1a presents the final Arecibo 3.125-MHz (![]() 0.395 km s-1 resolution)
spectrum in open squares. This has been smoothed to a resolution of
0.395 km s-1 resolution)
spectrum in open squares. This has been smoothed to a resolution of
![]() 2 km s-1 to compare it to the GMRT spectrum, shown here as a thin solid line.
The agreement between the two is excellent. The central narrow absorption component
can be seen to be slightly asymmetric in both spectra. Further, in addition to the
deep narrow component, the 21-cm spectrum also has a shallow broad component, seen
in both the Arecibo and the GMRT spectra. This component can be more clearly seen in the
zoomed-in plot of Fig. 1b, where the two spectra
have again been superposed; again, the solid line is the GMRT spectrum,
while the open squares are the points on the Arecibo
3.125-MHz spectrum.
Figure 1c shows the Arecibo 3.125-MHz spectrum at the original
resolution of
2 km s-1 to compare it to the GMRT spectrum, shown here as a thin solid line.
The agreement between the two is excellent. The central narrow absorption component
can be seen to be slightly asymmetric in both spectra. Further, in addition to the
deep narrow component, the 21-cm spectrum also has a shallow broad component, seen
in both the Arecibo and the GMRT spectra. This component can be more clearly seen in the
zoomed-in plot of Fig. 1b, where the two spectra
have again been superposed; again, the solid line is the GMRT spectrum,
while the open squares are the points on the Arecibo
3.125-MHz spectrum.
Figure 1c shows the Arecibo 3.125-MHz spectrum at the original
resolution of ![]() 0.4 km s-1 (open squares); the thin solid line is the multi-Gaussian
fit to the spectrum which will be discussed later. This spectrum has an RMS
noise of
0.4 km s-1 (open squares); the thin solid line is the multi-Gaussian
fit to the spectrum which will be discussed later. This spectrum has an RMS
noise of ![]() 0.001 in optical depth per
0.001 in optical depth per ![]() 0.4 km s-1 channel (i.e.
0.4 km s-1 channel (i.e. ![]() 2 mJy).
The deepest absorption occurs at a heliocentric frequency of 1163.075 MHz, i.e. at
a heliocentric redshift of
2 mJy).
The deepest absorption occurs at a heliocentric frequency of 1163.075 MHz, i.e. at
a heliocentric redshift of
![]() .
.
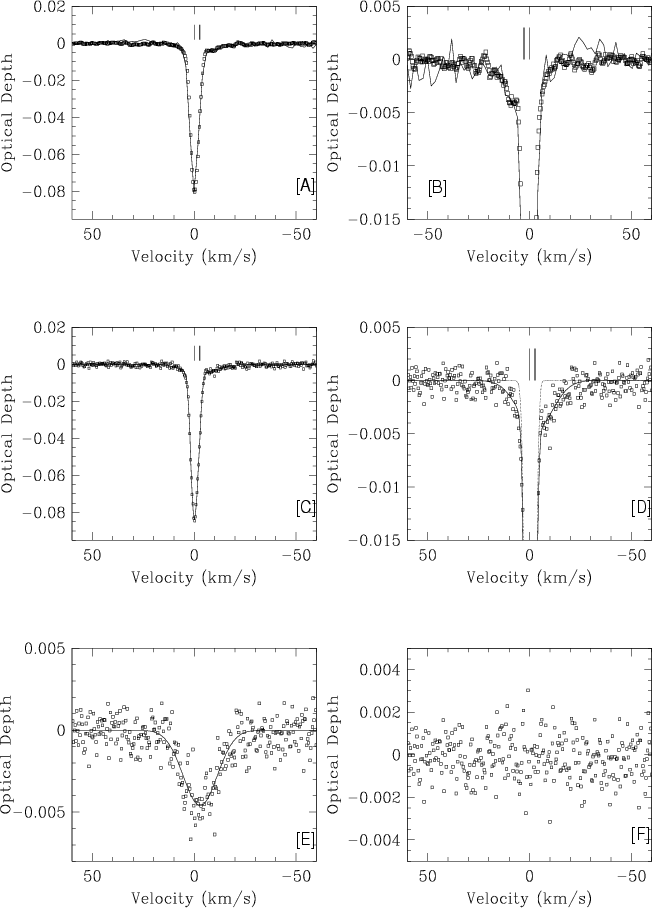 |
Figure 1:
The 21-cm absorption spectra of the z=0.2212 absorber towards OI 363.
a) A comparison of the Arecibo 0.4-km s-1 resolution spectrum (open
squares) with the GMRT 2.0-km s-1 resolution spectrum (shown as a thin solid
line). The Arecibo spectrum has been smoothed to a resolution of |
| Open with DEXTER | |
For optically thin absorption by a homogenous HI cloud, the 21-cm
optical depth ![]() is related to the column density
is related to the column density
![]() and spin temperature
and spin temperature ![]() by
by
In the Galaxy, the neutral ISM has no stable phase with a temperature
of ![]() 1000 K (although recent Arecibo observations indicate that a
significant fraction of neutral gas may be in the unstable phase with
500 K
1000 K (although recent Arecibo observations indicate that a
significant fraction of neutral gas may be in the unstable phase with
500 K
![]() K; Heiles & Troland 2000; Heiles 2001). Instead, there exists
a cold phase (the Cold Neutral Medium - CNM) with a temperature of
K; Heiles & Troland 2000; Heiles 2001). Instead, there exists
a cold phase (the Cold Neutral Medium - CNM) with a temperature of ![]() 80 K and
a warm phase (the Warm Neutral Medium - WNM) with a temperature of
80 K and
a warm phase (the Warm Neutral Medium - WNM) with a temperature of ![]() 8000 K. For each
individual phase, the spin temperature is essentially the same as the kinetic
temperature of the gas. However, the measured spin temperature
for a multi-phase absorber is the column density weighted harmonic mean
of the temperatures of the different phases (provided that the optical depth
of the gas in each phase is small; see e.g. Kulkarni & Heiles 1988).
The high spin temperature of the z=0.2212 DLA suggests that the bulk of
its neutral gas is in the warm phase, if it has a multi-phase ISM similar
to that of the Galaxy.
8000 K. For each
individual phase, the spin temperature is essentially the same as the kinetic
temperature of the gas. However, the measured spin temperature
for a multi-phase absorber is the column density weighted harmonic mean
of the temperatures of the different phases (provided that the optical depth
of the gas in each phase is small; see e.g. Kulkarni & Heiles 1988).
The high spin temperature of the z=0.2212 DLA suggests that the bulk of
its neutral gas is in the warm phase, if it has a multi-phase ISM similar
to that of the Galaxy.
The high resolution and sensitivity of the Arecibo observations allow us to
resolve the HI absorption profile into its individual components. As the measured optical depths are much
smaller than unity, this can be
used to obtain information on the temperatures of the different phases
of neutral hydrogen in the absorber. Optically thin absorption lines have Gaussian shapes if the
absorbing gas has a thermal distribution.
The kinetic temperature ![]() of the
gas is then related to the velocity width of the absorption profile by
of the
gas is then related to the velocity width of the absorption profile by
Since the narrow component seen in the Arecibo and GMRT spectra
is asymmetric and there is additional broad weak absorption, we attempted
to simultaneously fit three Gaussians to the absorption profile. The 3.125-MHz
Arecibo spectrum was again used for this purpose. (Attempts were also made to
fit only two Gaussians to the spectrum but, as expected, this was found to leave
large residuals.) The three component fit to the 3.125-MHz spectrum decomposes
the central feature into two components, the first with a velocity width
(FWHM)
![]() km s-1 and peak optical depth
km s-1 and peak optical depth
![]() ,
and the second with
,
and the second with
![]() km s-1 and
km s-1 and
![]() .
The third, wide component has an FWHM of
.
The third, wide component has an FWHM of
![]() km s-1 and a peak optical depth
km s-1 and a peak optical depth
![]() .
This best-fit model is superposed on the Arecibo 3.125-MHz spectrum in
Figs. 1c and d; here, the fit is shown as a solid line, while
the open squares indicate the original spectrum. Figure 1e
shows the spectrum after subtracting the two Gaussians fit to the narrow
central component; the third, wide component is clearly visible. This spectrum
also shows the fit to the wide component (solid line), which appears quite reasonable.
Finally, Fig. 1f shows the spectrum after subtracting all
three Gaussian components. The residuals are seen to lie within the noise.
.
This best-fit model is superposed on the Arecibo 3.125-MHz spectrum in
Figs. 1c and d; here, the fit is shown as a solid line, while
the open squares indicate the original spectrum. Figure 1e
shows the spectrum after subtracting the two Gaussians fit to the narrow
central component; the third, wide component is clearly visible. This spectrum
also shows the fit to the wide component (solid line), which appears quite reasonable.
Finally, Fig. 1f shows the spectrum after subtracting all
three Gaussian components. The residuals are seen to lie within the noise.
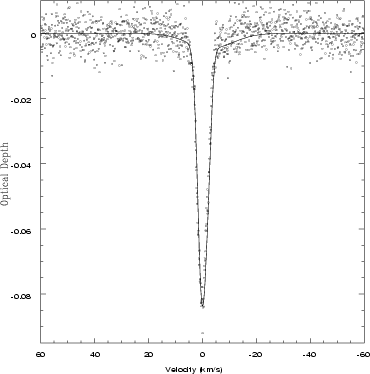 |
Figure 2:
High resolution ( |
| Open with DEXTER | |
| Component | 1 | 2 | 3 | |
| Optical depth | AO Low |
|
|
|
| GMRT |
|
|||
| AO High |
|
|
||
| FWHM (km s-1) | AO Low |
|
|
|
| GMRT |
|
|||
| AO High |
|
|
||
|
|
|
|
||
|
|
|
|
|
|
| Redshift (
|
0.221250 | 0.221240 | 0.221239 | |
The 0.781-MHz bandwidth Arecibo spectrum (shown in Fig. 2) has far lower sensitivity than the 3.125-MHz spectrum (owing to a much shorter integration time). It is consequently not very sensitive to the wide component. An independent check of the fit to the narrow components can however be made by fitting solely to these components, while keeping the parameters of the wide component fixed at the values determined from the 3.125-MHz spectrum. The parameters obtained from this fit agree (within the errors) with those listed above for the 3.125-MHz spectrum although there is a suggestion that the secondary narrow component may be even narrower than determined from the latter. Similarly, because of its relatively poor resolution, the GMRT spectrum is not particularly sensitive to the decomposition of the narrow component. However, the fit to the wide component (as obtained after keeping the parameters of the narrow components fixed to the values obtained from the 3.125-MHz Arecibo spectrum) is in excellent agreement with that obtained independently from the Arecibo data. Table 1 summarises the parameters of the fits to the different spectra.
Equation (4) can now be used to obtain the kinetic temperatures
of the individual Gaussian components, using the velocity widths listed in
Table 1. This yields
![]() K and
K and
![]() K, for the two narrow components, and
K, for the two narrow components, and
![]() K, for the broad component. Clearly, the measured
spin temperature
K, for the broad component. Clearly, the measured
spin temperature
![]() K is quite different from the
physical temperatures of the absorbing clouds. The kinetic temperatures of
the first two components are larger than those of cold clouds in the
Milky Way (Braun & Walterbos 1992), while the temperature of the third (
K is quite different from the
physical temperatures of the absorbing clouds. The kinetic temperatures of
the first two components are larger than those of cold clouds in the
Milky Way (Braun & Walterbos 1992), while the temperature of the third (
![]() K)
is in excellent agreement with estimates of the temperature of the WNM
(
K)
is in excellent agreement with estimates of the temperature of the WNM
(![]() 5000-8000 K; Kulkarni & Heiles 1988; Carilli et al. 1998). Note
that recent Arecibo observations of the WNM in the Milky Way have found
some evidence for lower temperatures than the above, with
5000-8000 K; Kulkarni & Heiles 1988; Carilli et al. 1998). Note
that recent Arecibo observations of the WNM in the Milky Way have found
some evidence for lower temperatures than the above, with
![]() K
(Heiles & Troland 2000; Heiles 2001), although these results are still in preliminary
form.
K
(Heiles & Troland 2000; Heiles 2001), although these results are still in preliminary
form.
These estimates of the kinetic temperature can be used in
Eq. (3) to obtain the HI column densities of the
different components. This yields
![]() cm-2
and
cm-2
and
![]() cm-2 for the two narrow components,
and
cm-2 for the two narrow components,
and
![]() cm-2 for the wide component.
The total column density in all three components is
cm-2 for the wide component.
The total column density in all three components is
![]() cm-2,
larger than (but, given the errors, still in agreement with) the value of
cm-2,
larger than (but, given the errors, still in agreement with) the value of
![]() cm-2 obtained from the Lyman-
cm-2 obtained from the Lyman-![]() line (Rao & Turnshek 1998).
Given that the 21-cm
line (Rao & Turnshek 1998).
Given that the 21-cm
![]() measurements are, strictly speaking, upper
limits, since there may be non-thermal contributions to the line width, the agreement
between the column densities obtained from the 21-cm profile and the Lyman-
measurements are, strictly speaking, upper
limits, since there may be non-thermal contributions to the line width, the agreement
between the column densities obtained from the 21-cm profile and the Lyman-![]() profile is quite good. Thus, the 21-cm profile of this absorber agrees fairly
well with what would be expected from an absorber with a multi-phase medium
much like that of the Galaxy (at least, in terms of the temperatures of the two
phases).
profile is quite good. Thus, the 21-cm profile of this absorber agrees fairly
well with what would be expected from an absorber with a multi-phase medium
much like that of the Galaxy (at least, in terms of the temperatures of the two
phases).
It should be noted that non-thermal motions of a given magnitude will make
a larger difference to narrow lines than to wide lines. It is therefore likely that
the column density in the narrow components (which we identify with the CNM)
are more severely over-estimated. The total contribution of the CNM to the
HI column density is
![]() cm-2, i.e.
at most 24% of the total column density obtained from the damped Lyman-
cm-2, i.e.
at most 24% of the total column density obtained from the damped Lyman-![]() line (Rao & Turnshek 1998).
Of course, it is possible that the wide component also has a low kinetic temperature
and that its large width is primarily due to non-thermal motions of the absorbing gas.
For example, this could be due to the blending of a number of narrow CNM lines of low optical
depth, rather than due to absorption by the WNM. Even in such a situation, however,
the total contribution of such clouds to the HI column density would be very low,
leaving unaccounted a substantial fraction of the column density, which must lie
in a still hotter component. For example, if we assume that the hypothetical blended
cold clouds have
kinetic temperatures
line (Rao & Turnshek 1998).
Of course, it is possible that the wide component also has a low kinetic temperature
and that its large width is primarily due to non-thermal motions of the absorbing gas.
For example, this could be due to the blending of a number of narrow CNM lines of low optical
depth, rather than due to absorption by the WNM. Even in such a situation, however,
the total contribution of such clouds to the HI column density would be very low,
leaving unaccounted a substantial fraction of the column density, which must lie
in a still hotter component. For example, if we assume that the hypothetical blended
cold clouds have
kinetic temperatures
![]() K, then the total HI column density in the wide
component is negligible,
K, then the total HI column density in the wide
component is negligible,
![]() cm-2. The bulk of the gas seen in
the Lyman-
cm-2. The bulk of the gas seen in
the Lyman-![]() profile would hence still be required to be in a phase whose
temperature is sufficiently large to make the 21-cm optical depth lower than our
detection threshold. Thus, regardless of whether or not the wide component is
identified with the WNM, one requires
profile would hence still be required to be in a phase whose
temperature is sufficiently large to make the 21-cm optical depth lower than our
detection threshold. Thus, regardless of whether or not the wide component is
identified with the WNM, one requires ![]() 76% (or possibly, even more) of the HI
to be contained in the WNM. Indeed, the mere fact that we observe components
in the absorption profile whose kinetic temperatures are smaller than the average
spin temperature of the gas means that the gas must have multiple phases, including
a warm phase. Given the relatively good agreement between the damped Lyman-
76% (or possibly, even more) of the HI
to be contained in the WNM. Indeed, the mere fact that we observe components
in the absorption profile whose kinetic temperatures are smaller than the average
spin temperature of the gas means that the gas must have multiple phases, including
a warm phase. Given the relatively good agreement between the damped Lyman-![]() and 21-cm
HI column densities and the reasonable value of the derived kinetic temperature
of the wide component, we consider it highly likely that the wide component is indeed
gas in the WNM phase. Note that in calculating the fraction of gas in the WNM phase
we have assumed that the damped Lyman-
and 21-cm
HI column densities and the reasonable value of the derived kinetic temperature
of the wide component, we consider it highly likely that the wide component is indeed
gas in the WNM phase. Note that in calculating the fraction of gas in the WNM phase
we have assumed that the damped Lyman-![]()
![]() measurement is the best estimate of the
total neutral-hydrogen column density.
measurement is the best estimate of the
total neutral-hydrogen column density.
As discussed in the previous section, the 21-cm absorption profile of the
z=0.2212 DLA is in excellent agreement with that expected were the
absorption to arise in a multi-phase medium similar to that of the Milky Way.
However, unlike the Galaxy, where the CNM and WNM both make equitable
contributions to the total HI column density (Kulkarni & Heiles 1988), ![]() 75%
of the neutral hydrogen along this line of sight through the DLA must be in the
warm phase, i.e. with temperature
75%
of the neutral hydrogen along this line of sight through the DLA must be in the
warm phase, i.e. with temperature ![]() 8000 K, in order to account for its high estimated
spin temperature.
8000 K, in order to account for its high estimated
spin temperature.
The average spin temperature for the
z = 0.2212 absorber of ![]() 900 K is
far higher than the typical spin temperatures of
100 - 200 K found in the Galaxy
and nearby spirals (Braun & Walterbos 1992; Braun 1997). High spin temperatures of similar
magnitude were earlier obtained by Carilli et al. (1996) in DLAs at high redshift. It
was suggested there that the high
900 K is
far higher than the typical spin temperatures of
100 - 200 K found in the Galaxy
and nearby spirals (Braun & Walterbos 1992; Braun 1997). High spin temperatures of similar
magnitude were earlier obtained by Carilli et al. (1996) in DLAs at high redshift. It
was suggested there that the high ![]() values at high z might be explained by
evolutionary effects. Since then, however, there has been a substantial increase
in the number of DLAs with 21-cm observations
(Lane et al. 1998; Chengalur & Kanekar 1999; Chengalur & Kanekar 2000; Kanekar & Chengalur 2001) and, as Chengalur
& Kanekar (2000) point out, high spin temperatures appear to be typical for
DLAs at all redshifts. So far, the only DLAs which show low
values at high z might be explained by
evolutionary effects. Since then, however, there has been a substantial increase
in the number of DLAs with 21-cm observations
(Lane et al. 1998; Chengalur & Kanekar 1999; Chengalur & Kanekar 2000; Kanekar & Chengalur 2001) and, as Chengalur
& Kanekar (2000) point out, high spin temperatures appear to be typical for
DLAs at all redshifts. So far, the only DLAs which show low ![]() values are those known to be associated with the disks of spiral galaxies. Chengalur
& Kanekar (2000) (see also Kanekar & Chengalur 2001) suggested that the high-
values are those known to be associated with the disks of spiral galaxies. Chengalur
& Kanekar (2000) (see also Kanekar & Chengalur 2001) suggested that the high-![]() DLAs were likely to be associated with dwarf or LSB-type galaxies, where a
combination of low central pressures, low dust content and low metallicities result
in a smaller fraction for the CNM. Our conclusion that
DLAs were likely to be associated with dwarf or LSB-type galaxies, where a
combination of low central pressures, low dust content and low metallicities result
in a smaller fraction for the CNM. Our conclusion that ![]() 75% of the gas along
the line of sight through the
z = 0.2212 DLA is in the WNM phase is in good
agreement with the observations of Young et al. (2000), who find that nearby dwarf
galaxies have
75% of the gas along
the line of sight through the
z = 0.2212 DLA is in the WNM phase is in good
agreement with the observations of Young et al. (2000), who find that nearby dwarf
galaxies have ![]() 80% of their neutral gas in the WNM phase.
80% of their neutral gas in the WNM phase.
Apart from possible selection effects, the association of DLAs with dwarf galaxies is somewhat surprising, both because of the existing paradigm of DLAs being associated with massive rotating disks (Prochaska & Wolfe 1997; Prochaska & Wolfe 1998), and the expectation (based on a census of the HI content of z=0 optically catalogued galaxies by Rao & Briggs 1993) that the bulk of the neutral HI at low redshifts is in large spiral galaxies. However, blind searches for HI emission at low redshift (i.e. unbiased by the presence of a catalogued galaxy; Schneider et al. 1998; Rosenberg & Schneider 2000) also indicate that there could be substantial amounts of HI in optically faint galaxies, although these results are still controversial (e.g. see Zwaan et al. 1997, for an opposing point of view).
In this context, it is of interest that the three lowest redshift
DLAs known have all been (tentatively) identified as dwarf (or LSB) galaxies
(Bowen et al. 2001; Turnshek et al. 2001; Cohen 2001) (where, following
Turnshek et al. 2001, we only consider systems to be DLAs if they meet the
"classical'' selection criterion for a DLA, i.e. for which an observed
Lyman-![]() profile yields an HI column density
profile yields an HI column density
![]() cm-2).
In the case of the current absorber, Le Brun et al. (1997) suggested that a galaxy
at an impact parameter of
cm-2).
In the case of the current absorber, Le Brun et al. (1997) suggested that a galaxy
at an impact parameter of ![]() 6'' from OI 363 was likely to be the DLA host.
The spectrum of this galaxy (Cohen 2001) confirms that it is indeed at the
correct redshift to produce the damped absorption. Turnshek et al. (2001) present
both detailed multi-wavelength photometry and optical spectroscopy of this system,
and find that its colours are consistent with a dwarf (
6'' from OI 363 was likely to be the DLA host.
The spectrum of this galaxy (Cohen 2001) confirms that it is indeed at the
correct redshift to produce the damped absorption. Turnshek et al. (2001) present
both detailed multi-wavelength photometry and optical spectroscopy of this system,
and find that its colours are consistent with a dwarf (
![]() )
early-type
galaxy. The radial profile, however, indicates the presence of both a bulge and a disk.
Hence, these authors suggest that this galaxy could be the equivalent of the dwarf spirals
seen at low redshifts (Schombert et al. 1995) and/or might have evolved from the faint blue
galaxies seen at higher redshifts. It should also be noted that the impact parameter
(
)
early-type
galaxy. The radial profile, however, indicates the presence of both a bulge and a disk.
Hence, these authors suggest that this galaxy could be the equivalent of the dwarf spirals
seen at low redshifts (Schombert et al. 1995) and/or might have evolved from the faint blue
galaxies seen at higher redshifts. It should also be noted that the impact parameter
(![]() 18) kpc is somewhat large for a dwarf galaxy and it is thus also possible that
the absorption arises in an even fainter companion galaxy.
18) kpc is somewhat large for a dwarf galaxy and it is thus also possible that
the absorption arises in an even fainter companion galaxy.
The present detection of the WNM in the z=0.2212 absorber towards OI 363
is the second case of evidence for a multi-phase medium in an extragalactic
system. Lane et al. (2000) found that the z=0.0912 absorber towards the
same quasar also has a multi-phase medium, with at most ![]() one-third of
the gas in the CNM phase. Interestingly, this DLA is also likely to be associated with
a dwarf galaxy; Turnshek et al. (2001) place an upper limit of
one-third of
the gas in the CNM phase. Interestingly, this DLA is also likely to be associated with
a dwarf galaxy; Turnshek et al. (2001) place an upper limit of ![]() 0.1 L* on
its K band luminosity. It is possible that such systems dominate current samples
of DLAs because the obscuration for lines of sight passing through gas with both
high metallicity and high dust content might well be sufficient to make
medium resolution spectroscopy of the background quasar extremely difficult
(Fall & Pei 1993).
As conjectured earlier, the high observed spin temperatures of DLAs thus seem
to be a consequence of their having a higher fraction of the WNM than is found
for the Galaxy. The fact that the two lowest redshift known DLAs have high
0.1 L* on
its K band luminosity. It is possible that such systems dominate current samples
of DLAs because the obscuration for lines of sight passing through gas with both
high metallicity and high dust content might well be sufficient to make
medium resolution spectroscopy of the background quasar extremely difficult
(Fall & Pei 1993).
As conjectured earlier, the high observed spin temperatures of DLAs thus seem
to be a consequence of their having a higher fraction of the WNM than is found
for the Galaxy. The fact that the two lowest redshift known DLAs have high ![]() means that this cannot be due to evolutionary effects. The possibility that it
is due to a selection effect (i.e. a bias against highly obscured lines of sight)
cannot, however, be ruled out. Such a bias can only be properly quantified by
searches for DLAs against bright radio sources, regardless of their optical
magnitude. Several such searches are currently under way (see e.g. Ellison 2000)
and an observational determination of the importance of dust obscuration should
be available in the near future.
means that this cannot be due to evolutionary effects. The possibility that it
is due to a selection effect (i.e. a bias against highly obscured lines of sight)
cannot, however, be ruled out. Such a bias can only be properly quantified by
searches for DLAs against bright radio sources, regardless of their optical
magnitude. Several such searches are currently under way (see e.g. Ellison 2000)
and an observational determination of the importance of dust obscuration should
be available in the near future.
Acknowledgements
We are grateful to Phil Perillat and Chris Salter for their help with observations and data reduction and to Chris for detailed comments and suggestions on an earlier draft of this paper. We also thank Frank Briggs for illuminating discussions on the "double-switched'' mode of observation. The NAIC is operated by Cornell University under a cooperative agreement with the NSF. The GMRT observations presented in this paper would not have been possible without the many years of dedicated effort put in by the GMRT staff to build the telescope.