A&A 373, 12-23 (2001)
DOI: 10.1051/0004-6361:20010500
F. D. Barazza1 - B. Binggeli1 - P. Prugniel2
1 - Astronomisches Institut, Universität Basel, Venusstrasse 7,
4102 Binningen, Switzerland
2 -
Observatoire de Lyon, 64561 St. Genis-Laval Cedex, France
Received 2 October 2000 / Accepted 14 March 2001
Abstract
CCD photometry in the Cousins B, V and R bands of 19 northern field dwarf
galaxies is presented. For each galaxy, and for each colour,
we determined
total magnitude, effective radius and effective surface brightness,
and, by fitting an exponential to the surface brightness profile, central
surface brightness and exponential scale length. Surface brightness and colour
profiles are shown. One of the observed galaxies (UGC 2689) is probably a
background S0 galaxy and belongs to the cluster Abell 426.
All others, with one possible exception (Kar49),
are typical late-type field
dwarf galaxies (mostly magellanic irregulars) lying
in the distance range 5-10 Mpc. The sample has a median
absolute magnitude
MB = -14.9 and a median colour
(B-V)
= 0.52.
The present late-type dwarfs have higher surface brightness in
the mean than cluster late-type dwarfs, confirming a trend found
in our previous work. However, there is no evidence for a
photometric difference between field and group late-type dwarfs.
This paper is part of a long-term programme to study the environmental
differences in the photometric structure of dwarf galaxies.
Key words: galaxies: general - galaxies: fundamental parameters - galaxies: photometry - galaxies: irregular - galaxies: structure
Dwarf galaxies are believed to hold a key to the understanding of the structure and evolution of galaxies in general. A prerequisite for useful knowledge of dwarf galaxies is a thorough study of their systematic properties. Owing to the general low surface brightness of dwarf galaxies, it is most natural to pursue such a study in the "local'' volume, out to a distance of ca. 10 Mpc. Approximately 300 galaxies are presently known to lie in this volume (Schmidt & Boller 1992; Karachentsev et al. 1999); most of these are clustered in a number of well-known groups of galaxies, including the Local Group (LG).
In a series of papers (Bremnes et al. 1998; Bremnes et al. 1999; Bremnes et al. 2000), hereafter Papers I, III, and IV, B and R photometry of 61 dwarf galaxies in the northern M81 and M101 groups, and the CVnI cloud was presented. These data were used, together with data for another ca. 60 local dwarfs taken from the literature, to carry out a preliminary analysis of the photometric differences among dwarf galaxies in different environments, in particular by comparing these local, low-density environment dwarfs (lying in groups and clouds) with a sample of high-density environment dwarfs (lying in the nearby Virgo and Fornax clusters of galaxies). At a given total magnitude, dwarf galaxies of any given type (elliptical or irregular) appear to have significantly higher surface brightness in the local volume than in clusters, clearly indicating a difference in the evolutionary history between non-cluster and cluster dwarfs (Bremnes 2001, Paper V). This is probably the first statistical evidence for an environmental difference in the photometric structure among dwarfs of a given type. Note that this is more than just a dependence of the mixture (relative abundance) of the dwarf types with the environment (local galaxy density), which was known before (Binggeli et al. 1987, 1990).
Continuing this series of papers, we here present photometric data for 19 field (non-group) dwarf galaxies in the northern sky in the Cousins B, V and R bands. The basic motivation is simply to enlarge the sample of nearby dwarfs with known photometry in order to provide a more complete data set for comparative dwarf studies in the future. A particular goal is to confirm and refine the interesting trends found by Bremnes (2001) with more and better data. The present paper is a modest contribution to this goal; there are still up to 100 nearby dwarf candidates left to image. On the other hand, most dwarfs in the local volume presently available, as in Bremnes (2001), are group members. With the present imaging of 19 field dwarfs (or, rather, 18, as one turned out to be a likely background galaxy) we essentially double the number of field (non-group) dwarfs. This will therefore allow us to do a first, crude comparison between group and field dwarfs. A more detailed statistical analysis of the present data, together with those from our previous and future photometry of nearby dwarf galaxies, is left to a future paper of this series.
One of the difficulties when working with field galaxies is that individual distances are required for any meaningful photometry. Thanks to the enormous efforts of Karachentsev and colleagues, rough individual distances, mostly based on the magnitudes of the brightest resolved blue stars in a star forming galaxy, are known for most field dwarf galaxies (e.g., Karachentsev et al. 1999, and references therein).
In the following section we describe the sample and the imaging of the selected dwarf objects. The description of the reduction procedure follows in Sect. 3. In Sect. 4 we present the surface brightness profiles and the derived model-free parameters (total magnitude, effective radius and effective surface brightness); the best-fitting exponential model parameters (extrapolated central surface brightness and exponential scale length); the B-V colour profiles and gradients; and finally an assessment of the photometric accuracy. Notes on the individual galaxies observed are given in Sect. 5. In Sect. 6 we compare our present field dwarf data with that from previous work. Finally, our conclusions are given in Sect. 7.
| No. | Ident. 1 | Ident. 2 | RA | Dec | Type |
|
Dist. | MB | |
| 1. | UGC 288 | PGC 1777 | 00 29 03.60 | +43 25 54.0 | Im | 15.31 | 188 | 6.7 | -13.82 |
| 2. | UGC 685 | PGC 3974 | 01 07 22.40 | +16 41 02.0 | Im/BCD | 13.97 | 157 | 6.0 | -14.92 |
| 3. | UGC 1281 | PGC 6699 | 01 49 31.39 | +32 35 19.5 | Sd | 12.83: | 156 | 5.4 | -15.83: |
| 4. | NGC 1156 | UGC 2455 | 02 59 42.61 | +25 14 17.1 | IBm | 11.78 | 375 | 7.8 | -17.68 |
| 5. | UGC 2684 | PGC 12514 | 03 20 23.71 | +17 17 45.1 | Im | 15.93 | 350 | 6.5 | -13.13 |
| 6. | UGC 2689 | PGC 12585 | 03 21 27.67 | +40 48 06.1 | S0 | 14.75 | |||
| 7. | UGC 2716 | PGC 12719 | 03 24 07.60 | +17 45 10.0 | Sm | 14.05 | 379 | 6.7 | -15.08 |
| 8. | UGC 2905 | PGC 14149 | 03 57 00.14 | +16 31 20.8 | Im | 14.41 | 292 | 5.8 | -14.41 |
| 9. | UGC 3303 | PGC 17250 | 05 24 59.50 | +04 30 18.0 | Sd: | 13.39 | 522 | 7.2 | -15.90 |
| 10. | PGC 17716 | Orion Dw. | 05 45 01.63 | +05 03 41.2 | SBd: | 12.24 | 366 | 6.4 | -16.79 |
| 11. | A0554+07 | 05 57 33.5 | +07 28 57 | Im | 16.45: | 411 | 5.5 | -12.25: | |
| 12. | UGC 3476 | PGC 19162 | 06 30 29.22 | +33 18 07.2 | Im (pec) | 14.96 | 469 | 7.0 | -14.26 |
| 13. | UGC 3600 | PGC 19871 | 06 55 40.00 | +39 05 42.8 | Im | 15.79 | 412 | 7.3 | -13.53 |
| 14. | Kar 49 | 07 07 30.00 | +71 52 47 | dE: | 18.25: | ||||
| 15. | NGC 2337 | UGC 3711 | 07 10 13.49 | +44 27 24.2 | IBm/BCD | 13.10 | 436 | 7.9 | -16.39 |
| 16. | Kar 50 | PGC 22060 | 07 52 47.40 | +61 23 23.0 | Im | 17.88: | |||
| 17. | UGC 4115 | PGC 22277 | 07 57 01.80 | +14 23 27.0 | Im | 15.11 | 338 | 5.3 | -13.51 |
| 18. | NGC 2537 | UGC 4274 | 08 13 14.57 | +45 59 28.2 | Sm/BCD | 12.59 | 447 | 6.9 | -16.60 |
| 19. | DDO 64 | UGC 5272 | 09 50 22.40 | +31 29 16.0 | Im | 15.31 | 520 | 7.1 | -13.95 |
| 20. | DDO 97 | UGC 6782 | 11 48 57.24 | +23 50 16.4 | Im | 15.08 | 525 | 14.0 | -15.65 |
The basis of the chosen sample is the catalogue of nearby galaxies by Schmidt
& Boller (1992), which lists all galaxies with radial velocities ![]() 500kms-1
referred to the center of the LG, corresponding roughly to a
distance limit of 10 Mpc. We selected 19 field dwarf candidates in the
northern sky, i.e galaxies
which could not be assigned to a group or a cloud of galaxies, and for which no
reliable photometry was available (at least at the time of selection).
A list of the objects selected and observed along with some basic data is
given in Table 1. The columns of Table 1 are as follows:
500kms-1
referred to the center of the LG, corresponding roughly to a
distance limit of 10 Mpc. We selected 19 field dwarf candidates in the
northern sky, i.e galaxies
which could not be assigned to a group or a cloud of galaxies, and for which no
reliable photometry was available (at least at the time of selection).
A list of the objects selected and observed along with some basic data is
given in Table 1. The columns of Table 1 are as follows:
Columns (2) and (3): identification of the observed galaxy;
Columns (4) and (5): their 2000.0 epoch coordinates (from NED);
Column (6): morphological type in the classification system of Sandage & Binggeli (1984);
Column (7): total B band magnitude, corrected for galactic extinction (from this paper);
Columns (8) and (9): heliocentric radial velocity in kms-1(from the NED) and distance in Mpc (from Karachentsev et al. 1999);
Column (10): absolute B band magnitude, based on the data given in Cols. (7) and (9).
The observed dwarfs are spread out over almost half of the northern sky. As the table shows, velocities and distance estimates are available for most of the selected objects. The distances from Karachentsev et al. (1999), based either on the Hubble flow velocity or the luminosity of the brightest resolved blue stars, have to be regarded as estimates only. DDO97 with an estimated distance of 14 Mpc would formally fall off the sample limiting distance of 10 Mpc, but because of the basic distance uncertainty just mentioned we have chosen to keep this galaxy in our sample. Otherwise the distances are in the range 5.3 < d < 7.9, which is beyond the well-known groups of M 81 and M 101. Accordingly, our sample dwarfs are relatively bright, with a median absolute magnitude MB = -14.9. Kar49 and Kar50, though without known distance, are morphologically (by their very low surface brightness) very likely nearby dwarfs. One galaxy in the sample, UGC 2689, is probably not nearby but is likely a S0 member galaxy of the Perseus cluster of galaxies (Abell 426) - despite a velocity of 277 kms-1 listed in the NED, which we deem wrong (see Sect. 5, UGC 2689). The photometric data of this galaxy are presented here nonetheless.
With the possible exception of Kar49 (which might be a dwarf elliptical), and disregarding UGC 2689, the sample galaxies are all late-type dwarfs, which is of course expected for the low-density field. Mostly, they are typical irregulars classified Im, but there are also some intriguing objects included, like NGC 2537 (classified as Sm/BCD), that seem to undergo a burst of star formation. A CCD gallery of our sample galaxies is shown in Fig. 1.
The CCD imaging was carried out between November 7, 1999 and January 8,
2000 on the
1.2-m telescope of the Observatoire de Haute Provence (OHP).
We used the No. 2
Tektronix
![]() CCD camera. For 12 (7) galaxies the frames are 40 (10)
minutes B and 20 (5) minutes V and R exposures. The field of view is
CCD camera. For 12 (7) galaxies the frames are 40 (10)
minutes B and 20 (5) minutes V and R exposures. The field of view is
![]() with a resolution of
with a resolution of
![]() per pixel.
The gain was set to 3.5e- per ADU, and the CCD was read out in the fast
mode, with a readout noise of 8.5e-. Seeing was between
per pixel.
The gain was set to 3.5e- per ADU, and the CCD was read out in the fast
mode, with a readout noise of 8.5e-. Seeing was between
![]() and
and
![]() .
.
![\begin{figure}
\par\includegraphics[width=15.3cm,clip]{10318f1.ps}\end{figure}](/articles/aa/full/2001/25/aa10318/img14.gif) |
Figure 1:
B-band CCD images. Image size:
|
| Open with DEXTER | |
![\begin{figure}\par\includegraphics[width=15.3cm,clip]{10318f2.ps}
\end{figure}](/articles/aa/full/2001/25/aa10318/img15.gif) |
Figure 1: continued. |
| Open with DEXTER | |
The photometric procedures are based on ESO's MIDAS package and follow the prescription of PaperIV, as detailed in the following. The images were bias-substracted and then flat-fielded by combining several dome flats. The background was determined by fitting a tilted plane to average intensities of frame areas unaffected by bright stars or the object itself. The fits were checked for correctness by applying the same procedure to the already background-substracted frame. The deviation from zero of the resulting plane was compared to the mean intensity of the substracted background. Remaining background gradients of up to 0.5% can be regarded as small enough for our purposes; we found values between 0.05 and 0.3%.
| No. | Galaxy | AB |
|
|
|
|
|
|
B-V | B-R | |||
| 1. | UGC 288 | 15.31 | 0.33 | 14.68 | 14.28 | 6.12 |
4.13 |
4.31 |
21.24 | 19.76 | 19.45 | 0.63 | 1.03 |
| 2. | UGC 685 | 13.97 | 0.25 | 13.79 | 13.25 | 21.44 | 23.25 | 24.88 | 22.63 | 22.62 | 22.23 | 0.18 | 0.72 |
| 3. | UGC 1281 | 12.83: | 0.20 | 11.73: | 11.28: | 26.99: | 27.95: | 28.30: | 21.99: | 20.96: | 20.54: | 1.10: | 1.55: |
| 4. | NGC 1156 | 11.78 | 0.96 | 11.31 | 10.91 | 31.58 | 34.28 | 35.48 | 21.28 | 20.98 | 20.66 | 0.47 | 0.87 |
| 5. | UGC 2684 | 15.93 | 0.61 | 15.31: | 15.21 | 18.07 | 17.92: | 19.19 | 24.21 | 23.58: | 23.62 | 0.62 | 0.72 |
| 6. | UGC 2689 | 14.75 | 0.64 | 13.73 | 13.12 | 8.26 |
8.03 |
7.64 |
21.33 | 20.25 | 19.53 | 1.02 | 1.63 |
| 7. | UGC 2716 | 14.05 | 0.59 | 13.57 | 13.13 | 22.81 | 26.29 | 28.26 | 22.84 | 22.67 | 22.38 | 0.48 | 0.92 |
| 8. | UGC 2905 | 14.41 | 1.35 | 14.29 | 13.97 | 12.13 | 13.21 | 13.04 | 21.83 | 21.89 | 21.55 | 0.12 | 0.44 |
| 9. | UGC 3303 | 13.39 | 0.56 | 12.68 | 12.15 | 49.49 | 49.02 | 46.80 | 23.86 | 23.13 | 22.50 | 0.71 | 1.24 |
| 10. | PGC 17716 | 12.24 | 3.17 | 12.17 | 11.86 | 51.08 | 43.94 | 42.66 | 22.78 | 22.38 | 22.01 | 0.07 | 0.38 |
| 11. | A0554+07 | 16.45: | 2.56 | 16.27: | 15.90: | 12.38: | 13.61: | 9.23: |
23.91: | 23.94: | 22.73: | 0.18: | 0.55: |
| 12. | UGC 3476 | 14.96 | 1.02 | 14.45 | 14.02 | 11.48 | 12.58 | 13.86 | 22.26 | 21.95 | 21.73 | 0.51 | 0.94 |
| 13. | UGC 3600 | 15.79 | 0.39 | 15.27 | 14.79 | 16.24 | 15.86 | 16.95 | 23.84 | 23.27 | 22.93 | 0.52 | 1.00 |
| 14. | Kar 49 | 18.25: | 0.35 | 17.50: | 17.10: | 13.46: | 1309: | 11.80: | 25.89: | 25.08: | 24.46: | 0.75: | 1.15: |
| 15. | NGC 2337 | 13.10 | 0.38 | 12.52 | 12.12 | 19.27 | 21.57 | 21.68 | 21.52 | 21.19 | 20.80 | 0.58 | 0.98 |
| 16. | Kar 50 | 17.88: | 0.23 | 17.64: | 17.54: | 11.12: | 11.94: | 13.34: | 25.11: | 25.02: | 25.16: | 0.24: | 0.34: |
| 17. | UGC 4115 | 15.11 | 0.12 | 23.29 | 23.94 | ||||||||
| 18. | NGC 2537 | 12.59 | 0.23 | 11.92 | 11.43 | 21.56 | 21.79 | 23.08 | 21.23 | 20.61 | 20.25 | 0.67 | 1.16 |
| 19. | DDO 64 | 15.31 | 0.09 | 15.02 | 14.31 | 21.75 | 20.87 | 21.41 | 24.00 | 23.62 | 22.96 | 0.29 | 1.00 |
| 20. | DDO 97 | 15.08 | 0.12 | 14.52 | 14.20 | 43.09 | 39.91 | 34.88 | 25.25 | 24.52 | 23.91 | 0.56 | 0.88 |
The calibration was done by imaging photometrically well known galaxies like
M 81, NGC 1275 etc. Data from the literature (Hypercat![]() ) were used to fit the
measured
growth curve (cumulative intensity profile) of these galaxies to
a set of integrated magnitudes at
different apertures.
) were used to fit the
measured
growth curve (cumulative intensity profile) of these galaxies to
a set of integrated magnitudes at
different apertures.
For each galaxy the center, as well as the ellipticity and position angle of
the major axis, were determined at the isophotal
level of ![]()
![]() by means of the ellipse fitting routine FIT/ELL3.
These parameters were then used
to obtain a growth curve (integrated light profile) by integrating the
galaxy light in elliptical apertures of fixed center, ellipticity,
and position angle
of the major axis, but with increasing aperture.
Keeping the center and shape parameters fixed
along the integration is essential for the type of irregular galaxies we
are dealing with here. If the center were left free by fitting ellipses
to a series of isophotes, as is often done in the surface photometry of
galaxies, the center would likely shift around by large amounts,
and any mean radial surface brightness profile constructed from these ellipse
fits would be physically meaningless.
Fixing the center and shape of the
ellipse for integration at a faint outer isophote ensures that these
reference parameters are closely related to the underlying older, less
"noisy''
stellar population and therefore also to the mass distribution
of the galaxy.
by means of the ellipse fitting routine FIT/ELL3.
These parameters were then used
to obtain a growth curve (integrated light profile) by integrating the
galaxy light in elliptical apertures of fixed center, ellipticity,
and position angle
of the major axis, but with increasing aperture.
Keeping the center and shape parameters fixed
along the integration is essential for the type of irregular galaxies we
are dealing with here. If the center were left free by fitting ellipses
to a series of isophotes, as is often done in the surface photometry of
galaxies, the center would likely shift around by large amounts,
and any mean radial surface brightness profile constructed from these ellipse
fits would be physically meaningless.
Fixing the center and shape of the
ellipse for integration at a faint outer isophote ensures that these
reference parameters are closely related to the underlying older, less
"noisy''
stellar population and therefore also to the mass distribution
of the galaxy.
The drawback of this procedure is that for most irregulars the approximate center of mass thus determined does not coincide with the center of light, i.e. with the brightest spot. One has only to look at an image of the Large Magellanic Cloud to see that the brightest HII region (30 Doradus in this case) in a dwarf irregular galaxy is typically lying off-center. In a mean profile which refers to the center of mass (as determined at a faint outer isophote) this would show up in a relatively flat central light profile, or even a light decrement in the central part (which is clearly the case in some of our profiles, see Fig. 2). But even so, we think this is the only way a mean profile is physically meaningful. In practise, e.g. when fitting an exponential, one would of course simply disregard the inner part of the profile.
Before doing the galaxy photometry, the frames were cleaned from disturbing foreground stars or background galaxies. This is of course also a basic problem of the photometry of irregulars. Depending on the resolution, a HII region might appear starlike and hence - erroneously - be erased. It is therefore mandatory that "disturbing'' discrete objects affecting the galaxy light are only removed when it is absolutely obvious that they do not belong to the galaxy. Differences in total magnitude, when comparing the results of different photometric studies, are sometimes due simply to a difference in the cleaning procedure (see Sect. 4.4).
![\begin{figure}
\par\includegraphics[width=16cm,clip]{10318f3.ps}\end{figure}](/articles/aa/full/2001/25/aa10318/img26.gif) |
Figure 2: Radial surface brightness profiles of the observed dwarf galaxies in B (bottom solid lines), V (middle solid lines) and R (upper solid lines) except for UGC 4115 (only B). The dashed lines represent the exponential fits, as described in Sect. 4.2. The fitting region is marked by the longer tickmarks on the upper axis. |
| Open with DEXTER | |
| No. | Galaxy |
|
|
|
|
|
|
|
|
|
| 1. | UGC 288 | 22.98 | 22.27 | 21.80 | 9.11 |
9.07 |
8.96 |
0.87 | 0.80 | 0.76 |
| 2. | UGC 685 | 21.96 | 21.64 | 21.13 | 13.90 | 13.91 | 14.29 | 0.27 | 0.13 | 0.10 |
| 3. | UGC 1281 | 20.90 | 19.91 | 19.52 | 17.17 | 17.93 | 18.37 | -0.10 | -0.09 | -0.08 |
| 4. | NGC 1156 | 20.31 | 19.71 | 19.59 | 19.19 | 19.17 | 21.23 | 0.11 | -0.01 | 0.04 |
| 5. | UGC 2684 | 23.30 | 22.67 | 22.73 | 12.10 | 12.29 | 13.57 | -0.04 | -0.09 | -0.14 |
| 6. | UGC 2689 | 21.87 | 20.71 | 20.24 | 8.41 |
7.75 |
8.23 |
0.50 | 0.53 | 0.54 |
| 7. | UGC 2716 | 23.24 | 22.84 | 22.41 | 22.10 | 24.37 | 24.77 | 0.47 | 0.33 | 0.31 |
| 8. | UGC 2905 | 21.30 | 21.28 | 20.55 | 7.84 |
8.43 |
7.55 |
0.42 | 0.36 | 0.19 |
| 9. | UGC 3303 | 23.07 | 22.17 | 21.66 | 38.45 | 33.45 | 33.64 | -0.24 | -0.13 | -0.12 |
| 10. | PGC 17716 | 21.90 | 21.43 | 21.05 | 36.82 | 29.69 | 29.18 | -0.17 | -0.10 | -0.13 |
| 11. | A0554+07 | 23.46 | 22.89 | 21.25 | 9.37 |
8.11 |
4.77 |
0.15 | -0.92 | -0.04 |
| 12. | UGC 3476 | 21.54 | 21.34 | 21.16 | 7.29 |
8.42 |
9.56 |
0.27 | 0.26 | 0.24 |
| 13. | UGC 3600 | 22.88 | 22.34 | 21.97 | 10.22 | 10.36 | 10.64 | 0.04 | -0.01 | 0.04 |
| 14. | Kar 49 | 25.10 | 24.51 | 23.75 | 10.39 | 13.91 | 9.50 |
-0.23 | -0.71 | -0.24 |
| 15. | NGC 2337 | 21.59 | 20.78 | 20.64 | 16.47 | 15.52 | 17.40 | 0.39 | 0.30 | 0.32 |
| 16. | Kar 50 | 23.20 | 23.09 | 23.36 | 5.17 |
5.30 |
6.04 |
-0.25 | -0.17 | -0.08 |
| 17. | UGC 4115 | 22.66 | 12.71 | 0.03 | ||||||
| 18. | NGC 2537 | 22.10 | 21.21 | 20.75 | 20.28 | 19.80 | 20.70 | 0.97 | 0.81 | 0.74 |
| 19. | DDO 64 | 22.56 | 22.10 | 21.49 | 11.54 | 10.73 | 11.20 | -0.06 | -0.07 | -0.07 |
| 20. | DDO 97 | 24.33 | 23.82 | 23.29 | 26.03 | 26.80 | 24.52 | 0.17 | 0.16 | 0.14 |
![\begin{figure}
\par\includegraphics[width=16cm,clip]{10318f4.ps}\end{figure}](/articles/aa/full/2001/25/aa10318/img36.gif) |
Figure 3: Radial B-R color profiles. The dashed lines represent the exponential fits, as described in Sect. 4.2. |
| Open with DEXTER | |
Integrating the light of the galaxy from the
center to the outskirts the growth curve approches an asymptotic value. This
total intensity, ![]() ,
is related to the total apparent magnitude,
,
is related to the total apparent magnitude, ![]() ,
through:
,
through:
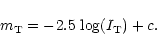 |
(1) |
The model-free effective radius can be read at half of the total growth curve
intensity. As the integration has been done with elliptical apertures, this
radius refers to an equivalent radius,
![]() ,
where a and b are the
major and minor axis of the galaxy, respectively. Together with the total
apparent magnitude this yields the effective surface brightness by:
,
where a and b are the
major and minor axis of the galaxy, respectively. Together with the total
apparent magnitude this yields the effective surface brightness by:
![\begin{displaymath}\langle\mu\rangle_{\rm eff}\,[{\rm mag}/\ifmmode\hbox{\rlap{$...
...$ }]=M+5\,\log(r_{\rm eff}[\hbox{$^{\prime\prime}$ }])
+1.995.
\end{displaymath}](/articles/aa/full/2001/25/aa10318/img41.gif) |
(2) |
Column (2): name of the galaxy;
Column (3): total apparent magnitude in the B band;
Column (4): galactic absorption in B using the extinction maps of Schlegel et al. (1998);
Columns (5) and (6): total apparent magnitude in the V and R band, respectively;
Columns (7), (8) and (9): effective radius in B, V and R, respectively, in arcseconds;
Columns (10), (11) and (12): effective surface brightnesses in B, Vand R, respectively, in mag/
![]() ;
;
Column (13): total B-V colour index;
Column (14): total B-R colour index.
Doubtful values due to low-quality observations (frames hampered with
reflected light or with a bright background due to moon light)
are flagged with a colon. For the error assessment (see Sect. 4.4) these cases
have not been taken into account.
Surface brightness profiles were obtained by differentiating the growth curves
with respect to equivalent radius. The resulting profiles, with a resolution,
or bin size of 2
![]() ,
are shown in Fig. 2. The profiles are traced down to the level where the uncertainties owing to
the fluctuations in the sky level on the profile become dominant, which is at
,
are shown in Fig. 2. The profiles are traced down to the level where the uncertainties owing to
the fluctuations in the sky level on the profile become dominant, which is at
![]()
![]() in B,
in B, ![]()
![]() in
V, and
in
V, and ![]()
![]() in R.
in R.
Radial intensity profiles can be fitted by different models. The exponential
model (De Vaucouleurs 1959; Binggeli & Cameron 1993) works very well for
dwarf elliptical galaxies, because of their steady decrease of brightness from
the center to the outer parts. Owing to their shape and, if present, bright
star forming regions, the brightness of irregular galaxies is not so uniform,
but parts of almost all intensity profiles of the irregulars considered here
exhibit an exponential behaviour. The exponential intensity profile can be
written as
 |
(3) |
 |
(4) |
Using a standard least squares fitting procedure, we determined a best-fitting exponential within that part of the galaxy profile, usually in a medium radius range, that is looking reasonably straight (exponential). This fitting range was defined for each galaxy individually (but is the same for each colour band). However, some noisy profiles (e.g. PGC 17716, A0554+07, DDO 64) were hard to fit and the definition of the fitting region was not obvious. In these cases we used rather large radius ranges for the fits to compensate for the fluctuations. The best-fitting exponential parameters are listed in Table 3. The best-fitting exponential profiles are plotted as dashed lines along with the observed profiles in Fig. 2, where also the fitting range is marked by ticks along the upper axis.
The deviation of the observed profile from a pure exponential law is expressed
by the difference ![]() between the total magnitude of an exponential
intensity law given by
between the total magnitude of an exponential
intensity law given by
 |
(5) |
The columns of Table 3 are as follows (again all values being corrected for galactic extinction based on Schlegel et al. 1998):
Column (2): name of the galaxy;
Columns (3), (4) and (5): extrapolated central surface brightness
according to equation (4) in
![]() ,
,
![]() ,
and
,
and
![]() ,
respectively;
,
respectively;
Columns (6), (7) and (8): exponential scale length in
arcsecs
![]() ,
in B, V, and R, respectively;
,
in B, V, and R, respectively;
Columns (9), (10) and (11): difference between the total magnitude as derived from the exponential model and the true total magnitude in B, Vand R, respectively.
As expected from a sample of late-type galaxies, the median integrated
colour, with
(B-V) = 0.52, is rather blue.
However, the scattering is considerable (see Table 2).
Four galaxies (UGC 685, UGC 2905, PGC
17716 and A0554+07) appear extremly blue (
![]() ).
While UGC685 might indeed be a blue dwarf compact (BCD, see Fig. 1),
the blue colour of the others is probably not real:
all three galaxies lie close to the zone of avoidance and have therefore
high corrections
for galactic extinction (
).
While UGC685 might indeed be a blue dwarf compact (BCD, see Fig. 1),
the blue colour of the others is probably not real:
all three galaxies lie close to the zone of avoidance and have therefore
high corrections
for galactic extinction (
![]() ,
see Table 2).
Any slight uncertainty in the correction with respect to colour will produce
a large error in the "true'' colour index.
On the other hand, there are two very red galaxies: UGC 1281 with
(B-V) = 1.10, and UGC 2689 with
(B-V) = 1.02. UGC 1281 is seen perfectly
edge-on, and so its red colour is clearly caused by internal dust
absorption, while UGC 2689 is a probable background S0 (see notes on
individual galaxies) and therefore quite plausibly red.
,
see Table 2).
Any slight uncertainty in the correction with respect to colour will produce
a large error in the "true'' colour index.
On the other hand, there are two very red galaxies: UGC 1281 with
(B-V) = 1.10, and UGC 2689 with
(B-V) = 1.02. UGC 1281 is seen perfectly
edge-on, and so its red colour is clearly caused by internal dust
absorption, while UGC 2689 is a probable background S0 (see notes on
individual galaxies) and therefore quite plausibly red.
B-R colour profiles, along with the differences of the B and R exponential fits, are shown in Fig. 3. Most colour profiles, where the noise is small enough to allow any significant gradient to be seen, follow the trend of an increasing B-R with increasing galactocentric radius, i.e. a blueing inwards. This is the stellar population gradient known and expected for dwarf irregulars: regions of active or recent star formation, and therefore of blue colour, are concentrated to the inner part of the galaxies. There are two notable, and plausible, exceptions showing the inverse trend, i.e. a reddening inwards (see Fig. 3): UGC 2689, the suspected background S0, and UGC 3303, a large spiral in the zone of avoidance.
![\begin{figure}
{
\includegraphics[width=5.2cm,clip]{10318f5.ps}\hspace*{4mm}
\includegraphics[width=5.2cm,clip]{10318f6.ps} }
\end{figure}](/articles/aa/full/2001/25/aa10318/img58.gif) |
Figure 4: Comparison of our data with data from the RC3: our published data vs. RC3 (left panel); data from our "uncleaned'' frames vs. RC3 (right panel). |
| Open with DEXTER | |
The photometric zero point determination represents the greatest source of
error on the global parameters in this work. Other uncertainties, stemming
from the flat-fielding and background subtraction etc., were mentioned
in Sect. 3.
Instead of trying to assess the overall error from all these single error
sources, which seems impossible anyway, it is easier and more reliable to
compare our results with data from the literature.
Ten galaxies of our sample can be compared to RC3 data (Third reference
catalogue of bright galaxies, deVaucouleurs et al. 1991). Figure 4 shows the result of this comparison for total magnitudes (where this time
no correction for galactic extinction was applied). A first plain
comparison of our magnitudes with RC3 magnitudes is disappointing:
deVaucouleurs et al.'s magnitudes are systematically brighter by up to one
magnitude (as evidenced in the left panel of Fig. 4). However, if we take
the magnitudes derived from our uncleaned images and compare them
with RC3, the agreement is quite satisfactory, with a standard deviation in
magnitude of only
![]() mag (shown in the right panel
of Fig. 4). This likely means that the RC3 magnitudes, at least for these
galaxies, are based on images that were not cleaned from disturbing foreground
stars. In fact, they are based on aperture photometry where
the contamination by stars is unavoidable and inherently large for faint
and diffuse dwarf galaxies.
mag (shown in the right panel
of Fig. 4). This likely means that the RC3 magnitudes, at least for these
galaxies, are based on images that were not cleaned from disturbing foreground
stars. In fact, they are based on aperture photometry where
the contamination by stars is unavoidable and inherently large for faint
and diffuse dwarf galaxies.
If we distribute the contribution to the above-mentioned ![]() evenly between our photometry and deVaucouleurs et al.'s, had they
properly accounted for foreground contamination, we arrive at a global
(one sigma) uncertainty of
evenly between our photometry and deVaucouleurs et al.'s, had they
properly accounted for foreground contamination, we arrive at a global
(one sigma) uncertainty of
![]() (for us and them), applying also
to surface brightness. This is indeed the typical photometric accuracy achieved
in our previous papers.
(for us and them), applying also
to surface brightness. This is indeed the typical photometric accuracy achieved
in our previous papers.
Previous photometry for a number of our dwarfs is provided also by some
other studies based on CCD imaging, notably by Makarova et al. (1998).
A comparison
with our ![]() and B-V values often shows large differences. However, since
no details on how the photometry was done is given in that and other papers,
we cannot judge the reliability of the comparison. More details
are given in the notes on individual galaxies below.
and B-V values often shows large differences. However, since
no details on how the photometry was done is given in that and other papers,
we cannot judge the reliability of the comparison. More details
are given in the notes on individual galaxies below.
As far as the typical uncertainty of the model parameters is concerned, given the amount of subjective judgement in choosing the fitting range etc., this is impossible to assess without comparison with independent data from the literature.
UGC 288: The bright object near the center of the galaxy is very likely
a foreground star, but the possibility of a nucleus cannot be ruled out,
as the R-band brightness profile shows that the object
is exactly at the center of the R-band isophotes of the outer parts.
Therefore the object was not removed from the image.
UGC 685: This is a well-studied dwarf galaxy. Optical imaging
has previously been carried out by Makarova et al. (1998) and Hopp (1999),
where deep, high-resolution pictures are shown, and more recently by
Jansen et al. (2000) and vanZee (2000).
Makarova et al. (1998) and Hopp (1999) give a ![]() (uncorrected for
galactic absorption) of 14.44 and 14.55, respectively, while
Jansen et al. (2000) and vanZee (2000) both give 14.20, which is in
excellent agreement with our value of 14.22 (Table 2). However, our very
blue colour of
B-V = 0.24 (again uncorrected)
is in strong disagreement with vanZee (2000) who gives
B-V = 0.52,
while, on the
other hand, our
B-R = 0.83 does agree with Jansen's (2000)
B-R = 0.84and Hopp's (1999)
B-R = 0.86. The B-R colour profile (Fig. 3) shows
that the inner part of the galaxy, where several bright star forming
regions are situated (Fig. 1), is indeed very blue, with
(uncorrected for
galactic absorption) of 14.44 and 14.55, respectively, while
Jansen et al. (2000) and vanZee (2000) both give 14.20, which is in
excellent agreement with our value of 14.22 (Table 2). However, our very
blue colour of
B-V = 0.24 (again uncorrected)
is in strong disagreement with vanZee (2000) who gives
B-V = 0.52,
while, on the
other hand, our
B-R = 0.83 does agree with Jansen's (2000)
B-R = 0.84and Hopp's (1999)
B-R = 0.86. The B-R colour profile (Fig. 3) shows
that the inner part of the galaxy, where several bright star forming
regions are situated (Fig. 1), is indeed very blue, with
![]() .
Morphology and colour made us
reclassify this galaxy as Im/BCD, following Sandage & Binggeli (1984).
.
Morphology and colour made us
reclassify this galaxy as Im/BCD, following Sandage & Binggeli (1984).
UGC 1281: Edge-on disk galaxy without any sign of a bulge.
The bright, small elliptical object just to the left is the background
galaxy VI Zw051. A better image is shown in Makarova et al. (1998).
Independent photometry is provided by
Makarova et al. (1998) and van Zee (2000). Our photometry,
which is deemed uncertain by the colons in Tables 2 and 3, does not agree
well with either of these studies. Our total blue magnitude
(
![]() ,
uncorrected for galactic absorption) is significantly
brighter than the values of 13.26 and 13.61 given, respectively, by
Makarova et al. (1998) and van Zee (2000). There is a similar disagreement in
the colours. However, the galaxy does appear fairly red, which is likely
caused by the internal dust absorption of the highly inclined disk.
,
uncorrected for galactic absorption) is significantly
brighter than the values of 13.26 and 13.61 given, respectively, by
Makarova et al. (1998) and van Zee (2000). There is a similar disagreement in
the colours. However, the galaxy does appear fairly red, which is likely
caused by the internal dust absorption of the highly inclined disk.
NGC 1156: The galaxy has many star forming regions. The brightest
structure resembles a bar (therefore the classification of a IBm) and shows
even rudiments of spiral arms. There are very many detailed studies of this
galaxy (on its HII regions, CO content etc.), but none provide
independent surface photometry, other than that given in the RC3.
UGC 2684: Very small and faint galaxy with a peculiar shape.
Independent imaging provided by van Zee et al. (1997) whose
![]() and
B-V = 0.49 values are only in fair agreement with ours
of
and
B-V = 0.49 values are only in fair agreement with ours
of
![]() and
B-V = 0.77:
(uncorrected for galactic extinction).
and
B-V = 0.77:
(uncorrected for galactic extinction).
UGC 2689: In the NED this galaxy is listed with a heliocentric velocity
of
![]() kms-1, which would make it a nearby dwarf.
However, in a study
of the Perseus cluster of galaxies (Abell 426) by Brunzendorf et al. (1999),
UGC2689 appears as a member of that cluster. There is indeed much
in favour of the latter view. First, the morphological appearance of
this galaxy is certainly S0-like. If the object were nearby, the
small size and high surface brightness of its bulge would be unprecedented
among dwarf galaxies (there is a class of "dwarf'' S0 galaxies, but these
are not simply scaled-down versions of giant S0s, as they exhibit the
low surface
brightness typical of dwarf ellipticals, see Sandage & Binggeli 1984).
Furthermore, the galaxy is quite red (
kms-1, which would make it a nearby dwarf.
However, in a study
of the Perseus cluster of galaxies (Abell 426) by Brunzendorf et al. (1999),
UGC2689 appears as a member of that cluster. There is indeed much
in favour of the latter view. First, the morphological appearance of
this galaxy is certainly S0-like. If the object were nearby, the
small size and high surface brightness of its bulge would be unprecedented
among dwarf galaxies (there is a class of "dwarf'' S0 galaxies, but these
are not simply scaled-down versions of giant S0s, as they exhibit the
low surface
brightness typical of dwarf ellipticals, see Sandage & Binggeli 1984).
Furthermore, the galaxy is quite red (
![]() 1) and
shows a slight reddening inwards in the colour profile (see Fig. 3),
which is well in accord
with it being a normal giant S0 galaxy. It seems more likely, then, that
the velocity listed is erroneous and that we deal with a background galaxy
here.
1) and
shows a slight reddening inwards in the colour profile (see Fig. 3),
which is well in accord
with it being a normal giant S0 galaxy. It seems more likely, then, that
the velocity listed is erroneous and that we deal with a background galaxy
here.
UGC 2716: The star-forming region of high surface brightness is
clearly off-centered with respect to the "underlying'', more extended
low-surface-brightness part of the galaxy.
UGC 2905: Peculiar shape. The galaxy appears in the catalogue of the
Pisces-Perseus Supercluster (Giovanelli et al. 1993) where indeed a
heliocentric velocity of
![]() kms-1 is reported.
Unlike UGC2689,
this is a "well-behaved'' dwarf galaxy (in terms of morphology and colour)
that happens to be projected into the sky area of a background cluster.
kms-1 is reported.
Unlike UGC2689,
this is a "well-behaved'' dwarf galaxy (in terms of morphology and colour)
that happens to be projected into the sky area of a background cluster.
UGC 3303: Large disk galaxy behind a sprinkle of foreground stars, all
of which had to be cleaned away for the photometry. Unfortunately, a very
bright star lies close to the center of the galaxy. For a better image see
Makarova et al. (1998).
There are clear signs of spiral arms and some structure in the central area
(a nucleus?). The negative colour gradient (inward reddening, Fig. 3) is
in accord with the spiral (disk) nature of the galaxy.
PGC 17716: This object, an intrinsically fairly large and bright disk
galaxy, also named "Orion'', is lying deep in the zone
of avoidance and
suffers a huge galactic absorption of
AB = 3.17. The apparently extreme
blue colour (
B-V = 0.07) is probably influenced by the strong correction for
galactic extinction.
A deep, high-resolution image is shown in Karachentsev & Musella (1996),
who also
carried out the first optical study of this galaxy. Their ![]() estimate
of 15.7 is in good accord with our value of 15.41 (uncorrected for galactic
extinction). According to Karachentsev & Musella (1996), this galaxy,
together with UGC 3303 and A0554+07, may belong to a loose galaxy group
(the "Orion group'') that is still largely hidden in the zone of avoidance.
estimate
of 15.7 is in good accord with our value of 15.41 (uncorrected for galactic
extinction). According to Karachentsev & Musella (1996), this galaxy,
together with UGC 3303 and A0554+07, may belong to a loose galaxy group
(the "Orion group'') that is still largely hidden in the zone of avoidance.
A0554+07: Very faint and highly obscured galaxy (
AB = 2.56).
Superior image shown in Karachentsev & Musella (1996). Associated with
PGC 17716; see note on that galaxy.
UGC 3476: Very peculiar shape. Excellent image shown in
Makarova & Karachentsev (1998). Very steep colour gradient (see Fig. 3).
UGC 3600: Flat brightness profile and almost no colour gradient.
The galaxy looks very smooth, almost dE-like, even on the deep image provided
by Makarova & Karachentsev (1998).
Kar 49: Faintest galaxy in the sample; could
be a dwarf elliptical.
NGC 2337: Bright galaxy with several knotty star-forming regions, of
BCD morphology.
Very deep image shown in Makarova & Karachentsev (1998), whose ![]() of
13.10 is mildly discordant with ours (13.48, uncorrected for galactic
extinction).
of
13.10 is mildly discordant with ours (13.48, uncorrected for galactic
extinction).
Kar 50: Blue galaxy with spherical shape and almost constant surface
brightness.
UGC 4115: Smooth brightness profile (only B available). Bright
foreground star was erased.
NGC 2537: Very bright star-forming regions which seem to form
a partial ring. BCD morphology.
DDO 64: Well studied dwarf galaxy. Deep, high-resolution pictures
shown in Hopp & Schulte-Ladbeck (1995) and Makarova & Karachentsev (1998).
Our uncorrected
![]() for this galaxy is strongly discordant
with Makarova & Karachentsev's (1998) value of 14.45, while there is perfect
agreement on B-V at 0.30. The reason for the discrepancy in
for this galaxy is strongly discordant
with Makarova & Karachentsev's (1998) value of 14.45, while there is perfect
agreement on B-V at 0.30. The reason for the discrepancy in ![]() is unclear.
We note, however, that part of the problem may be due to the erroneous
inclusion of two bright foreground stars (see image) in the total magnitude
by Makarova & Karachentsev (1998). The value listed in the RC3,
which is
based upon aperture photometry where all foreground stars are included
automatically, is too bright (14.41) as well (cf. Sect. 4.4).
is unclear.
We note, however, that part of the problem may be due to the erroneous
inclusion of two bright foreground stars (see image) in the total magnitude
by Makarova & Karachentsev (1998). The value listed in the RC3,
which is
based upon aperture photometry where all foreground stars are included
automatically, is too bright (14.41) as well (cf. Sect. 4.4).
DDO 97: Higher B-R in the central area (see Fig. 3) where also
a small star-like object is visible (nucleus?). The outer parts show some
signs of spiral arms. Otherwise of smooth, almost dE-like appearance.
For a deeper image see Makarova et al. (1998). Fair agreement between
our photometry and that of Makarova et al. (1998):
![]() versus 15.39
and B-V = 0.59 versus 0.67 (not corrected for galactic extinction),
respectively. Makarova et al. (1998) estimate a distance of 14 Mpc, which,
if true, would place the galaxy in the outskirts of the Virgo cluster.
versus 15.39
and B-V = 0.59 versus 0.67 (not corrected for galactic extinction),
respectively. Makarova et al. (1998) estimate a distance of 14 Mpc, which,
if true, would place the galaxy in the outskirts of the Virgo cluster.
In this section we briefly discuss how our present field dwarf objects compare with those from our previous work. In the following we use the term "irregular'' as synonymous to "late-type dwarf'', subsuming the true irregulars of types Im and BCD, as well as Sm and Sd galaxies.
![\begin{figure}
\par\includegraphics[width=7.1cm,clip]{10318f7.ps}\end{figure}](/articles/aa/full/2001/25/aa10318/img70.gif) |
Figure 5:
Extrapolated central surface brightness, |
| Open with DEXTER | |
In Bremnes (2001) it is shown that the photometric parameters of dwarf
galaxies significantly depend on the environment. In particular, dwarf
galaxies in galaxy groups and the field, of either the elliptical or late
type, tend to have higher surface brightness, of up to one
magnitude, than their counterparts in clusters of galaxies.
In Fig. 5, which is taken from Bremnes (2001), we illustrate this effect
with late-type ("irregular'')
dwarfs and add the field irregulars from the present
paper. Shown is the relation between the central surface brightness from an
exponential fit to the blue surface brightness profile, ![]() ,
and the
absolute blue magnitude, MB, for a sample of cluster irregulars (small
dots) and a sample of group and field irregulars as coded in the figure
with different symbols. Bremnes (2001) has included 16 field
galaxies that lie outside of any group (shown as filled squares).
Our own field dwarfs are added as filled circles, where we have discarded the
dwarf elliptical Kar49 and the S0 galaxy UGC2689, leaving us with 17
objects.
,
and the
absolute blue magnitude, MB, for a sample of cluster irregulars (small
dots) and a sample of group and field irregulars as coded in the figure
with different symbols. Bremnes (2001) has included 16 field
galaxies that lie outside of any group (shown as filled squares).
Our own field dwarfs are added as filled circles, where we have discarded the
dwarf elliptical Kar49 and the S0 galaxy UGC2689, leaving us with 17
objects.
The two lines shown in the figure are of the form
| (6) |
Within the data set of Bremnes (2001) the 16 field irregulars (filled squares)
show a tendency to have even higher central surface brightness values in the
mean than the group irregulars. For Bremnes' field irregulars alone one would
get
![]() ,
i.e.
,
i.e.
![]() as compared to the group + field
sample. Although not statistically significant, given the small number
of field objects, such a trend of ever higher surface brightness for dwarf
irregulars in ever lower density environments (from clusters to groups to the
field) would certainly agree with the general interpretation of the effect
by Bremnes (2001), viz. that a higher-density environment could have
slightly enhanced the mean star formation rate over the past, which would lead
to a lower star formation activity (surface brightness) at present.
However, this more subtle trend from groups to the field is not confirmed
by the present data. It is already apparent from Fig. 5 that our 17 field
irregulars (filled circles), even if we neglect DDO97, have lower
surface brightness in the mean than Bremnes' 16
field irregulars (filled squares).
Fitting Eq. (6) to our irregulars would give b = 29.82 (29.68 without
DDO97), which is even closer to the cluster line than the total group + field
sample of Bremnes (2001). But again the number is to small for statistical
significance. All field irregulars taken together would give b = 29.42,
or
as compared to the group + field
sample. Although not statistically significant, given the small number
of field objects, such a trend of ever higher surface brightness for dwarf
irregulars in ever lower density environments (from clusters to groups to the
field) would certainly agree with the general interpretation of the effect
by Bremnes (2001), viz. that a higher-density environment could have
slightly enhanced the mean star formation rate over the past, which would lead
to a lower star formation activity (surface brightness) at present.
However, this more subtle trend from groups to the field is not confirmed
by the present data. It is already apparent from Fig. 5 that our 17 field
irregulars (filled circles), even if we neglect DDO97, have lower
surface brightness in the mean than Bremnes' 16
field irregulars (filled squares).
Fitting Eq. (6) to our irregulars would give b = 29.82 (29.68 without
DDO97), which is even closer to the cluster line than the total group + field
sample of Bremnes (2001). But again the number is to small for statistical
significance. All field irregulars taken together would give b = 29.42,
or
![]() as compared to the cluster sample, while Bremnes' (2001)
group + field sample gave
as compared to the cluster sample, while Bremnes' (2001)
group + field sample gave
![]() .
.
In summary, we find no evidence for a systematic photometric difference between field and group dwarf irregulars, while there is strengthened evidence for such a difference between non-cluster and cluster dwarf irregulars.
We have carried out CCD photometry in the B, V, and R bands of 19
nearby field (non-group member) dwarf candidate galaxies as part of a
long-term effort to establish a
complete data base of
photometric (structural) parameters for all dwarf galaxies lying within
a distance of 10 Mpc. One of the selected candidates, UGC2689, upon
closer inspection, turned out to be a likely background giant S0 galaxy.
With one further exception, the possible dwarf elliptical Kar49,
all imaged objects are typical late-type dwarf galaxies, mostly of the
Im (magellanic) class, that dominate the galaxy population outside of clusters
and rich groups of galaxies. Some of the dwarfs are obviously
in a state of high star formation activity judged from their BCD morphology.
Others are apparently faint because they are highly obscured
by galactic dust extinction, being fairly luminous intrinsically (up to
![]() ).
).
We provide surface brightness and colour profiles, global photometric parameters (total magnitudes, total colour indices, effective radii, effective surface brightnesses), as well as best-fitting exponential parameters (exponential scale lengths and central surface brightnesses) for all 19 galaxies.
The sample was not chosen to be homogeneous for a study in its own right, but simply to further enlarge the sample of nearby (closer than 10 Mpc) dwarf galaxies with known photometry, to be analysed comprehensively later on. Nonetheless, by comparing the photometric properties of our 17 field "irregulars'' with those of all late-type dwarfs determined in our previous work, and preliminarily analysed in Bremnes (2001), we find the same trend, namely that dwarf irregulars outside of clusters have higher surface brightness in the mean than cluster irregulars. However, there is no significant difference between the photometric properties of group members and true field dwarf irregulars. It seems that only a dense cluster environment can significantly alter the star formation history of an irregular.
To the 120 nearby (within 10 Mpc) dwarfs with known photometry we have added another ca. 20. There are still up to 100 nearby dwarf candidates, in both the southern and northern hemisphere, which remain to be imaged. In our future papers of this series we plan to provide the photometry of the remaining nearby dwarf objects and then, based on a more complete data base, carry out a final analysis of the systematic photometric properties of dwarf galaxies with respect to environmental differences.
Acknowledgements
F. D. B. and B. B. are grateful to the Swiss National Science Foundation for financial support. We thank the night assistants at OHP who supervised some of the observations in service observing. This research has made use of the NASA/IPAC Extragalactic Database (NED) which is operated by the Jet Propultion Laboratory, California Institute of Technology, under contract with the National Aeronautics and Space Administration, as well as NASA's Astrophysical Data System Abstract Service.