![[*]](/icons/foot_motif.gif) - C. Tappert 1,2
- C. Tappert 1,2
A&A 372, 563-565 (2001)
DOI: 10.1051/0004-6361:20010526
R. E. Mennickent 1,
- C. Tappert 1,2
1 - Dpto. de Fisica, Facultad de Ciencias Fisicas y Matematicas,
Universidad de Concepcion, Casilla 160-C, Concepcion, Chile
2 - Dipartimento di Astronomia, Universita di
Padova, Vicolo dell'Osservatorio 2, 35122 Padova, Italy
Received 12 March 2001 / Accepted 4 April 2001
Abstract
We present a time-resolved study of the Balmer emission lines of
RZ Leo. From the analysis of the radial velocities we
find an orbital period of 0.07651(26) d.
Key words: stars: individual: RZ Leonis - stars: novae, cataclysmic variables - stars: fundamental parameters - stars: evolution - binaries: general
 d,
was also reported during early stages of the superoutburst
and thus possibly represents the orbital period of the binary.
In this paper we present time resolved spectra of RZ Leo. From the study of the
radial velocities of the H
d,
was also reported during early stages of the superoutburst
and thus possibly represents the orbital period of the binary.
In this paper we present time resolved spectra of RZ Leo. From the study of the
radial velocities of the H emission line we found a
spectroscopic period of
emission line we found a
spectroscopic period of
 = 0.07651(26) d.
We furthermore investigate the variation of the quiescent emission line
profile, and find evidence for a prominent emission component from the
hot spot region.
= 0.07651(26) d.
We furthermore investigate the variation of the quiescent emission line
profile, and find evidence for a prominent emission component from the
hot spot region.
A total of 46 spectra with individual exposure times of 10 min were obtained during two observing runs at La Silla and Las Campanas observatories. The observing schedule and instrumental setup are shown in Table 1. All CCD frames were processed in the standard way, using IRAF (distributed by the National Optical Astronomy Observatories). One-dimensional spectra were extracted, sky-subtracted and wavelength calibrated.
| Date (UT) | HJD start |
 |
setup/resolution |
| 10/02/95 | 2449758.7706 | 14 | A/6 Å |
| 11/02/95 | 2449759.7276 | 15 | A/6 Å |
| 21/03/95 | 2449797.7109 | 7 | B/4.5 Å |
| 23/03/95 | 2449799.7113 | 10 | B/4.5 Å |
| Line |
 |
 |
FWZI | FWHM |
| H |
-130 | 600 | 4300 | 2130 |
H |
-14 | 1150 | 3600 | 2610 |
| He I5875 | -34 | 1250 | 3475 | 2170 |
The system was found in quiescence. The spectrum presented
here is characterized by double emission lines of H,
He I5875 and H
(Fig. 1). In Table 2 we give mean
spectroscopic parameters for the main emission lines: equivalent widths,
half-peak separation
,
full width at half maximum FWHMand full width at zero intensity FWZI.
Radial velocities
were measured using a single Gaussian fit to the line profile. These values
were analysed using both the Scargle and the AOV algorithm (Scargle 1982;
Schwarzenberg-Czerny 1989; resp.) implemented in MIDAS. The results in
Fig. 2 show several possible
frequencies with similar power around a peak frequency of about 13
cycles/d. In order to discriminate between the possible frequencies and
derive the true period, we fitted the data with a sine function
corresponding to the peak frequency. Then a Monte Carlo simulation was
applied in such a way that to each data point a random value from an
interval consisting of  the sigma of the sine fit was added. The
resulting data set was again analysed with the Scargle algorithm, and the
highest peak was registered. After a thousand repetitions, the average
value within a small interval (0.2 cycles/d, determined by visual
inspection of the periodogram) around the more recurrent period and its
sigma were taken as the resulting period and its error, respectively. The
histogram in Fig. 3 shows the resulting distribution for a bin size of
0.01 cycles/d.
The derived period was
the sigma of the sine fit was added. The
resulting data set was again analysed with the Scargle algorithm, and the
highest peak was registered. After a thousand repetitions, the average
value within a small interval (0.2 cycles/d, determined by visual
inspection of the periodogram) around the more recurrent period and its
sigma were taken as the resulting period and its error, respectively. The
histogram in Fig. 3 shows the resulting distribution for a bin size of
0.01 cycles/d.
The derived period was

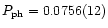
which is in excellent agreement with the photometric value
 =
0.0756(12) d found by Mennickent et al. (1999).
This value places RZ Leo in the midst of the SU UMa period distribution,
and near the location of the well-known systems Z Cha and
SU UMa. From the sine fit to the radial velocity data set
(Fig. 4), we furthermore obtain a semi-amplitude
=
0.0756(12) d found by Mennickent et al. (1999).
This value places RZ Leo in the midst of the SU UMa period distribution,
and near the location of the well-known systems Z Cha and
SU UMa. From the sine fit to the radial velocity data set
(Fig. 4), we furthermore obtain a semi-amplitude
 kms-1 and a time HJD
 corresponding to
the superior conjunction of the emitting source (positive to negative
crossing of the radial velocity curve). Note that these values were
derived by measuring the whole line profile, and therefore cannot be
identified a priori with the corresponding parameters of the white dwarf.
corresponding to
the superior conjunction of the emitting source (positive to negative
crossing of the radial velocity curve). Note that these values were
derived by measuring the whole line profile, and therefore cannot be
identified a priori with the corresponding parameters of the white dwarf.
The February data set also includes accompanying photometric measurements in the V passband. A nearby comparison star was placed in the slit at the same time as the variable, and differential slit-magnitudes were extracted from the spectra counts. A few V images taken during the night permitted us to roughly calibrate these magnitudes using nearby comparison stars whose standard magnitudes were taken from Mennickent et al. (1999). We estimate that the zero point for the V magnitudes so obtained is accurate to at least 0.1 mag. Results are discussed in the next section.
![\begin{figure}
\par\includegraphics[width=8cm,clip]{ms1259f1.eps} \end{figure}](/articles/aa/full/2001/23/aa1259/img13.gif) |
Figure 1: Averaged emission lines during February 1995. |
| Open with DEXTER | |
![\begin{figure}
\par\includegraphics[angle=270,width=8cm,clip]{ms1259f2.ps} \end{figure}](/articles/aa/full/2001/23/aa1259/img14.gif) |
Figure 2: Scargle (top) and AOV (bottom) periodogram of the radial velocity data. The arrows indicate the frequency corresponding to the derived period. |
| Open with DEXTER | |
![\begin{figure}
\par\includegraphics[angle=270,width=8cm,clip]{ms1259f3.ps} \end{figure}](/articles/aa/full/2001/23/aa1259/img15.gif) |
Figure 3: Histogram of the maximum-peak frequency. |
| Open with DEXTER | |
Within the errors, the derived spectroscopic period corresponds well to the
photometric period in quiescence, and thus very likely is the orbital period of
the binary. A similar period was also detected photometrically during the early
stages of the superoutburst. This supports the current understanding of the
formation of "early superhumps'', which still resemble the orbital period,
and which later evolve into "full superhumps'' as the accretion disc is
deformed and starts to precess. Considering the superhump period of
0.07857(22) d (Ishioka et al. 2000) we find a period excess between the
superhump period
 and the orbital period
 of
of

![\begin{figure}
\par\includegraphics[angle=0,width=8cm,clip]{ms1259f4.eps} \end{figure}](/articles/aa/full/2001/23/aa1259/img19.gif) |
Figure 4:
The H
emission line radial velocity versus the
orbital phase and the best sine fit. |
| Open with DEXTER | |
![\begin{figure}
\par\includegraphics[angle=90,width=8cm,clip]{sampleha.eps} \end{figure}](/articles/aa/full/2001/23/aa1259/img20.gif) |
Figure 5:
Selected H
profiles and their HJD
(minus 2449700) showing V/Rvariations. A vertical spacing of 3 units have been applied to the
profiles. |
| Open with DEXTER | |
As in other well known dwarf novae, variations in the relative strength of the violet and red peak intensity are observed (Fig. 5). These V/R variations could be attributed to the changing aspects of a hotspot in the disk-stream interacting region. This hotspot seems to be also the origin for the variations of the continuum and line strength observed in Fig. 6. The fact that the photometric maximum corresponds to the equivalent width maximum indicates that the hotspot is the source of both continuum and line extra emission. In addition, the displacement of the maximum phase at different epochs is notable. This could indicate displacements of the hotspot in the binary frame of rest, which was also suggested by Mennickent et al.(1999) to explain the long-term photometric variations. The position of the hotspot is that expected for the stream-disk interacting region in February, but not in March. Anomalous hotspot positions have been also observed by the method of Doppler Tomography and they are not yet fully understood (Szkody 1992).
![\begin{figure}
\par\includegraphics[angle=0,width=8cm,clip]{ms1259f5.eps} \end{figure}](/articles/aa/full/2001/23/aa1259/img21.gif) |
Figure 6:
The V magnitude for the first night of February (upper
panel). The H
emission line equivalent
widths for February (middle panel) and March
(below panel). A small shift was applied to the equivalent width of
February to correct for different nightly mean.
Note the non-coherent nature of the equivalent width oscillations. |
| Open with DEXTER | |
Acknowledgements
This work was supported by Grant Fondecyt 1000324 and DI 99.11.28-1.