A&A 372, 346-356 (2001)
DOI: 10.1051/0004-6361:20010393
P. Natoli1 - G. de Gasperis1 - C. Gheller2 - N. Vittorio1
1 - Dipartimento di Fisica, Università di Roma "Tor Vergata'', via della Ricerca Scientifica 1,
00133 Roma, Italy
2 - Cineca, Via Magnanelli 6/3, 40033 Caselecchio di Reno (BO), Italy
Received 16 January 2001 / Accepted 9 March 2001
Abstract
We present a parallel implementation of a map-making algorithm
for CMB anisotropy experiments which is both fast and efficient.
We show for the first time
a Maximum Likelihood, minimum variance map obtained by
processing the entire data stream expected from the PLANCK Surveyor,
under the assumption of a symmetric beam profile.
Here we restrict ourselves to the case of the 30 GHz channel of the
PLANCK Low Frequency Instrument. The extension to PLANCK higher
frequency channels is straightforward.
If the satellite pointing periodicity is good
enough to average data that belong to the same sky circle,
then the code runs very efficiently on workstations.
The serial version of our code
also runs on very competitive time-scales
the map-making pipeline for current and forthcoming
balloon borne experiments.
Key words: cosmic microwave background anisotropies - methods: data analysis
Making CMB maps out of balloon
(e.g. QMAP, de Oliveira-Costa et al. ;
MAXIMA-1, Hanany et al. ; BOOMERanG, de Bernardis et al. )
or space borne (MAP![]() and the PLANCK
Surveyor
and the PLANCK
Surveyor![]() )
experiments is
an important step of the standard data analysis pipeline.
It allows for: a major lossless compression of
the raw data with a minimum number of assumptions; checks on
systematics; tests for and/or estimation of foreground contamination; etc.
Map-making is also important when simulating a CMB experiment.
It allows to: look for
possible systematics; optimize the focal plane design and/or the experiment scanning strategy; etc. It is then highly desirable to develop tools able to attack the map-making problem also for
forthcoming, high-resolution CMB space experiments.
)
experiments is
an important step of the standard data analysis pipeline.
It allows for: a major lossless compression of
the raw data with a minimum number of assumptions; checks on
systematics; tests for and/or estimation of foreground contamination; etc.
Map-making is also important when simulating a CMB experiment.
It allows to: look for
possible systematics; optimize the focal plane design and/or the experiment scanning strategy; etc. It is then highly desirable to develop tools able to attack the map-making problem also for
forthcoming, high-resolution CMB space experiments.
Map-making a la COBE (see e.g. Lineweaver ) can be extended to the
differential, high resolution MAP experiment
(Wright et al. ). Moreover Wright () has
discussed how to perform map-making in the case of one-horned experiments significantly affected
by
1/f noise, which introduces spurious correlations in the data time stream (see e.g. Janssen et al. ). To our knowledge this algorithm has not yet been implemented for the PLANCK Surveyor
mission. To date, maps for PLANCK have only been produced by means of destriping algorithms
(Delabrouille et al. ; Maino
et al. ). We remind that PLANCK spins at 1 rpm, has a boresight angle of ![]() and
observes the same circle of the sky for 1 hour (every hour the spin axis is moved, say along the
ecliptic, by 2.5'). The destriping algorithms implemented for PLANCK assume that, after averaging
data taken along a given circle (i.e. in one hour), the residual noise along the circle is well
approximated by white noise plus an offset. These offsets are determined by minimizing the set of all
possible differences between the antenna temperatures of the same sky pixel
observed in two different
scan circles. This method rests on a number of assumptions, the stronger being that the knee
frequency of the 1/f noise is smaller than or at most comparable to the spin frequency.
Wright's method does not suffer this limitation because it assumes to
know the statistical properties of the noise, directly derived from the data themselves (see e.g. Ferreira & Jaffe ; Prunet et al. ).
and
observes the same circle of the sky for 1 hour (every hour the spin axis is moved, say along the
ecliptic, by 2.5'). The destriping algorithms implemented for PLANCK assume that, after averaging
data taken along a given circle (i.e. in one hour), the residual noise along the circle is well
approximated by white noise plus an offset. These offsets are determined by minimizing the set of all
possible differences between the antenna temperatures of the same sky pixel
observed in two different
scan circles. This method rests on a number of assumptions, the stronger being that the knee
frequency of the 1/f noise is smaller than or at most comparable to the spin frequency.
Wright's method does not suffer this limitation because it assumes to
know the statistical properties of the noise, directly derived from the data themselves (see e.g. Ferreira & Jaffe ; Prunet et al. ).
The purpose of this paper is to present the first implementation of Wright's method to the PLANCK Surveyor, for the moment assuming a symmetric beam profile. In fact, we want to show, to our knowledge for the first time, the analysis of the entire time stream (14 months) of PLANCK simulated data to produce Maximum Likelihood, minimum variance CMB maps (we stress that maps obtained from destriping algorithms are not necessarily minimum variance). The parallel, Message Passing Interface (hereafter MPI) implementation of the algorithm has been tested on a SGI Origin 2000 (hereafter O2K) and runs on time scales that might render Monte Carlo simulations feasible. This opens up the possibility of evaluating the CMB angular power spectrum via Monte Carlo techniques (Wandelt et al. ) rather than by maximizing a Likelihood (see e.g. Bond et al. ) or by directly evaluating the map angular correlation function (Szapudi et al. 1999). We want to stress that our implementation does not assume any exact periodicity of sky pointing within single circle observation (i.e. no average on the circle is performed, as instead required by destriping algorithms). If, on the contrary, it turns out that pointing periodicity is a good assumption (i.e. average on circles is performed) then the same code runs very efficiently on medium sized workstations (e.g. Pentium based PCs), again in quite short time scales.
Although this paper might seem rather technical, we think that it can be of interest to a large community of CMB data analysts, involved either in the PLANCK collaboration or in the forthcoming, new generation balloon experiments.
The plan of this paper is as follows. In Sects. 2 and 3 we will briefly discuss the method and its implementation. In Sect. 4 we will show tests and benchmarks of our implemented software. In Sect. 5 we will apply our tools to PLANCK and BOOMERanG simulated data. Finally, in Sect. 6 we will briefly review our conclusions.
Let us for completeness outline
here the map-making algorithm and its assumptions. The primary output of
a CMB experiment are the
Time Ordered Data (TOD), ![]() ,
which consist of
,
which consist of
![]() sky observations made
with a given scanning strategy and at a given sampling rate (three
points per FWHM, say). A map,
sky observations made
with a given scanning strategy and at a given sampling rate (three
points per FWHM, say). A map,
![]() ,
can be thought as a vector containing
,
can be thought as a vector containing
![]() temperature values, associated
with sky pixels of dimension
temperature values, associated
with sky pixels of dimension
![]() FWHM/3.
Following Wright () we assume that the TOD depend linearly on
the map:
FWHM/3.
Following Wright () we assume that the TOD depend linearly on
the map:
Many methods have been
proposed to estimate ![]() in Eq. (1) (for a review
see, e.g. Tegmark ).
Since the problem is linear in
in Eq. (1) (for a review
see, e.g. Tegmark ).
Since the problem is linear in ![]() ,
the use of a Generalized
Least Squares (GLS) method appears well suited. This involves the
minimization of the quantity
,
the use of a Generalized
Least Squares (GLS) method appears well suited. This involves the
minimization of the quantity
The
statistical properties of detector noise are, as usual, described by a
multivariate Gaussian distribution. This fact has two consequences.
The first one is rather obvious: if
the noise distribution is Gaussian,
![]() is indeed the
ML estimator. In
fact, in the Gaussian case, the Likelihood of the data time stream given
the (true) map is
is indeed the
ML estimator. In
fact, in the Gaussian case, the Likelihood of the data time stream given
the (true) map is
The method outlined in Sect. 2 has the advantage of being
simple,
linear and, hence, computationally appealing for PLANCK.
In this section we discuss our implementation
of the map-making algorithm to the 30 GHz channel of the PLANCK Low
Frequency Instrument (LFI),
with a nominal resolution ![]() 30' FWHM. This implies
30' FWHM. This implies
![]() (14 months of
observation,
i.e. about two sky coverages) and
(14 months of
observation,
i.e. about two sky coverages) and
![]() .
Note,
however, that the
implementation we present here is rather general since the algorithm
does not take specific
advantage of the details of PLANCK's scanning strategy and instrumental
performances. In fact, we
want to stress that our implementation of Wright's algorithm is, in
principle, well suited for any
one-horned, balloon- or space-borne CMB experiment.
.
Note,
however, that the
implementation we present here is rather general since the algorithm
does not take specific
advantage of the details of PLANCK's scanning strategy and instrumental
performances. In fact, we
want to stress that our implementation of Wright's algorithm is, in
principle, well suited for any
one-horned, balloon- or space-borne CMB experiment.
The problem of evaluating the noise properties directly from the TOD is
a bit far from the main
point we want to make here: the possibility, given N,
to analyze the entire PLANCK simulated
data set to produce a ML, minimum variance map. In any
case, we will show in
Sect. 5 that for the PLANCK case,
to zeroth order, we can
estimate the signal by projecting the TOD onto the sky. This implies
applying
![]() (summing the TOD into a map),
(summing the TOD into a map),
![]() (dividing the pixel values by
the number of hits) and
(dividing the pixel values by
the number of hits) and ![]() (unrolling a map into a time stream) to
(unrolling a map into a time stream) to ![]() .
The noise estimator,
.
The noise estimator,
![]() ,
can then be written as follows:
,
can then be written as follows:
It is customary to assume that the statistical properties of detector
noise do not change over the mission life time.
The formal way to state
this property is to write the elements of the noise covariance
matrix as follows:
 |
(7) |
 |
(9) |
In what follows we do not need to explicitly use
![]() ,
although we
have in principle all the relevant information to do so. In fact, the
first row of
,
although we
have in principle all the relevant information to do so. In fact, the
first row of
![]() ,
usually called a noise filter in the literature, can be computed by
taking a DFT of
,
usually called a noise filter in the literature, can be computed by
taking a DFT of
![]() ,
the
noise inverse spectral density. Then, by exploiting the circularity of
,
the
noise inverse spectral density. Then, by exploiting the circularity of
![]() we could in principle reconstruct the whole matrix.
Needless to say, handling a
we could in principle reconstruct the whole matrix.
Needless to say, handling a
![]() matrix is, for the PLANCK case,
unconceivable even for the 30 GHz case.
matrix is, for the PLANCK case,
unconceivable even for the 30 GHz case.
Fortunately, under the assumption of circularity the application of the
noise inverse covariance
matrix to the TOD is simply a convolution,
Asking how long a noise filter
should be is a very important question. In fact, from the one hand, it
is
desirable to convolve the TOD with a filter properly sampled in
![]() points (something already numerically feasible even for
a
PLANCK-like TOD).
On the other hand, Eq. (11) works for real data in the
limit
points (something already numerically feasible even for
a
PLANCK-like TOD).
On the other hand, Eq. (11) works for real data in the
limit
![]() (so that
(so that
![]() can be considered circulant).
Also note that an obvious bound on
can be considered circulant).
Also note that an obvious bound on
![]() comes from the
instrument:
it is difficult to imagine that the PLANCK detectors
will remain "coherent'' for the
whole mission life-time.
A further benefit in having
comes from the
instrument:
it is difficult to imagine that the PLANCK detectors
will remain "coherent'' for the
whole mission life-time.
A further benefit in having
![]() is the
possibility of performing a piecewise convolution in
Eq. (11).
In any case, in Sect. 5
we will show the sensitivity of our results to
is the
possibility of performing a piecewise convolution in
Eq. (11).
In any case, in Sect. 5
we will show the sensitivity of our results to
![]() .
.
Evaluating
![]() requires solving Eq. (3), that for
convenience we rewrite as
requires solving Eq. (3), that for
convenience we rewrite as
A CG algorithm does not need to explicitly
invert
![]() .
We want to stress that
earlier methods implemented to solve the map-making problem for
balloon-borne experiments
(Borrill ) require the inversion of the same matrix, surely an
unpleasant task when considering
large maps. Such implementations usually rely on the fact that
.
We want to stress that
earlier methods implemented to solve the map-making problem for
balloon-borne experiments
(Borrill ) require the inversion of the same matrix, surely an
unpleasant task when considering
large maps. Such implementations usually rely on the fact that
![]() is
(analytically speaking) positive definite and, as such, a
candidate to be Cholesky decomposed in
is
(analytically speaking) positive definite and, as such, a
candidate to be Cholesky decomposed in
![]() operations. This fact makes
the procedure prohibitively
expensive - even for present day supercomputers - when
operations. This fact makes
the procedure prohibitively
expensive - even for present day supercomputers - when
![]() becomes large (
becomes large (
![]() 105). Also,
105). Also,
![]() may not be exactly positive definite due to small inaccuracies when
estimating the noise correlation properties, making Cholesky
decomposition critical. Note that using an iterative solver could
potentially reduce the above operation count by a factor
may not be exactly positive definite due to small inaccuracies when
estimating the noise correlation properties, making Cholesky
decomposition critical. Note that using an iterative solver could
potentially reduce the above operation count by a factor
![]() .
However, storage requirement for
.
However, storage requirement for
![]() would still be
would still be
![]() ,
prohibitive for PLANCK.
,
prohibitive for PLANCK.
To conclude this Section, let us stress that the map we obtain,
![]() ,
has the correct noise covariance matrix,
,
has the correct noise covariance matrix,
![]() ,
even if we never evaluate nor store it directly.
,
even if we never evaluate nor store it directly.
As stated above, the working assumption that validates
Eq. (11)
is that
![]() .
Since the number of PE,
.
Since the number of PE,
![]() ,
is
at most
,
is
at most
![]() the previous condition is even fulfilled for
the
single PE. Thus, each PE performs the convolution of
Eq. (11)
by executing its own serial FFT as discussed in
Sect. 3.4.
This is more efficient than spreading
over the PE's an intrinsically parallel FFT, the advantage being that
we limit inter-processor communications. However, as a drawback, each PE
has to handle a partial map of size
the previous condition is even fulfilled for
the
single PE. Thus, each PE performs the convolution of
Eq. (11)
by executing its own serial FFT as discussed in
Sect. 3.4.
This is more efficient than spreading
over the PE's an intrinsically parallel FFT, the advantage being that
we limit inter-processor communications. However, as a drawback, each PE
has to handle a partial map of size
![]() and
cross talk
among PE's is necessary to merge
and
cross talk
among PE's is necessary to merge
![]() of these maps at the
end
of each CG iteration. Note that
increasing the number of processors
of these maps at the
end
of each CG iteration. Note that
increasing the number of processors
![]() while keeping
while keeping
![]() constant may
result in the operation count being dominated by this merging (see
however
Sect. 4.2 below).
constant may
result in the operation count being dominated by this merging (see
however
Sect. 4.2 below).
Part of the l.h.s. of Eq. (12) can be thought as
the application of the
![]() operator (the same acting on
operator (the same acting on ![]() on the rhs)
to
on the rhs)
to
![]() ,
the data stream obtained by unrolling
the
temptative solution produced by the CG at
the kth step. While the application of
,
the data stream obtained by unrolling
the
temptative solution produced by the CG at
the kth step. While the application of
![]() to
to
![]() is done just once, the application of the same operator to
is done just once, the application of the same operator to
![]() must be done for every iteration of the
CG algorithm.
Therefore, speed of execution becomes critical.
must be done for every iteration of the
CG algorithm.
Therefore, speed of execution becomes critical.
If we use a radix-2 Fast Fourier Transform (FFT) to perform a piecewise
convolution of the TOD, the operation count is expected
![]() .
The lion share of CPU time is taken by
the (real) DFT transform. The use of an efficient FFT library greatly
speeds up
the calculation.
We used the publicly available FFTW library (Frigo & Johnson ).
This code has
the nice property of tailoring itself to the architecture over which is
executed, therefore greatly
enhancing cross-platform efficiency. In Fig. 1 (upper
panel)
we plot CPU time per CG iteration,
.
The lion share of CPU time is taken by
the (real) DFT transform. The use of an efficient FFT library greatly
speeds up
the calculation.
We used the publicly available FFTW library (Frigo & Johnson ).
This code has
the nice property of tailoring itself to the architecture over which is
executed, therefore greatly
enhancing cross-platform efficiency. In Fig. 1 (upper
panel)
we plot CPU time per CG iteration, ![]() ,
versus
,
versus
![]() .
The behavior shown in the figure is due to the non constant
efficiency attained by the FFTW library when performing transforms of
different lengths.
FFT routines are usually more efficient when processing power-of-two
transforms and FFTW is no exception.
Thus, we fix
.
The behavior shown in the figure is due to the non constant
efficiency attained by the FFTW library when performing transforms of
different lengths.
FFT routines are usually more efficient when processing power-of-two
transforms and FFTW is no exception.
Thus, we fix
![]() to a power of two.
The application of
to a power of two.
The application of ![]() (
(
![]() )
to a map (TOD) is expected to scale linearly with
)
to a map (TOD) is expected to scale linearly with
![]() .
In Fig. 1 (middle panel) we give
.
In Fig. 1 (middle panel) we give ![]() as a
function of
as a
function of
![]() for a given map size
(
for a given map size
(
![]() ,
as expected by choosing
,
as expected by choosing
![]() in the HEALPix
pixelization (Górski et al. 1999))
and the PLANCK baseline scanning strategy.
The scaling with
in the HEALPix
pixelization (Górski et al. 1999))
and the PLANCK baseline scanning strategy.
The scaling with
![]() is indeed linear:
is indeed linear:
![]() ms.
ms.
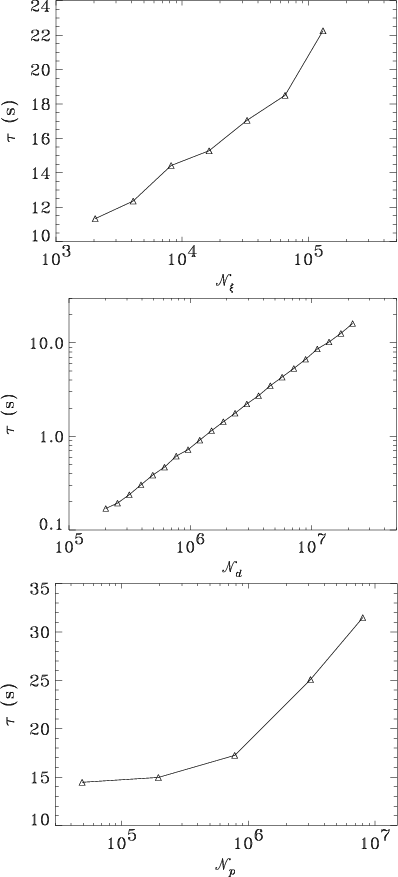 |
Figure 1:
The wall-clock time |
| Open with DEXTER | |
All the scalings given in Fig. 1 have been obtained from a single processor job using a 500 MHz Pentium III CPU.
A natural criterion to stop the CG solver is to require
that the fractional difference
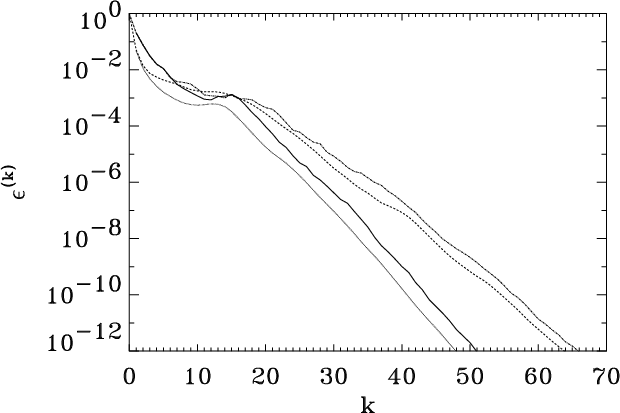 |
Figure 2:
Solver precision as a function of the CG iteration step.
Solid and dotted curves refer to the
parallel code running on the full
|
| Open with DEXTER | |
To test the CG convergence efficiency we plot
in Fig. 2
![]() for two datasets of different
length:
for two datasets of different
length:
![]() (corresponding to
(corresponding to
![]() 60)
and
60)
and
![]() (corresponding to
(corresponding to
![]() ).
Both
datasets have been benchmarked for the cases of "signal-only'' and
"noise-only'' TOD. In the latter case, the noise properties
are kept independent of the TOD length to facilitate comparisons.
Note that, after a
few steps, the precision
).
Both
datasets have been benchmarked for the cases of "signal-only'' and
"noise-only'' TOD. In the latter case, the noise properties
are kept independent of the TOD length to facilitate comparisons.
Note that, after a
few steps, the precision
![]() decreases exponentially and
drops to the 10-6 level in
a few tens of iterations. Although always exponential, the
rate of convergence of the CG solver depends on the TOD length.
This is a consequence of having kept fixed
decreases exponentially and
drops to the 10-6 level in
a few tens of iterations. Although always exponential, the
rate of convergence of the CG solver depends on the TOD length.
This is a consequence of having kept fixed
![]() and
and
![]() while increasing
while increasing
![]() .
In fact, the number of elements of
.
In fact, the number of elements of
![]() connected
by the noise filter is lower for a longer TOD, a fact that
makes this matrix more efficiently preconditioned by its diagonal
part.
To quote a single number, the algorithm converges, to 10-6precision,
in about 90 min (
connected
by the noise filter is lower for a longer TOD, a fact that
makes this matrix more efficiently preconditioned by its diagonal
part.
To quote a single number, the algorithm converges, to 10-6precision,
in about 90 min (
![]() )
to produce a map out
of the entire (not averaged over circles) 14 months time stream,
expected from the PLANCK Surveyor @ 30 GHz.
)
to produce a map out
of the entire (not averaged over circles) 14 months time stream,
expected from the PLANCK Surveyor @ 30 GHz.
Of course, solver precision and accuracy (that is, "distance'' from the true solution) are not the same thing. In other words, being confident that the algorithm converges quickly is only half the story. We also want it to converge to the exact solution. This is a rather important issue because we would not like the algorithm to kill modes in the map. Discussion of this point is deferred until the next Section.
In order for the code to run a noise filter,
![]() ,
is needed. First note that for this noiseless case the
filter should, in principle, be irrelevant: as stated above,
the GLS solution trivially gives back the "true'' map
independently of
,
is needed. First note that for this noiseless case the
filter should, in principle, be irrelevant: as stated above,
the GLS solution trivially gives back the "true'' map
independently of
![]() .
We must keep in mind, however, that we only consider
.
We must keep in mind, however, that we only consider
![]() elements of the filter. In Fourier space this translates into estimating
the noise inverse spectral density precisely at
elements of the filter. In Fourier space this translates into estimating
the noise inverse spectral density precisely at
![]() frequencies,
the lowest,
frequencies,
the lowest,
![]() say, being
say, being
![]() times smaller
than the sampling frequency.
One obvious limitation on
times smaller
than the sampling frequency.
One obvious limitation on
![]() is that it must be
fixed accordingly,
so that the Fourier representation of
is that it must be
fixed accordingly,
so that the Fourier representation of
![]() well comprises
the spin frequency.
The amplitude of modes with
well comprises
the spin frequency.
The amplitude of modes with
![]() ,
if any, is not recovered
unless the corresponding frequencies are considered in the analysis.
However, there are
two reasons why one should not worry about this effect: first, and more
importantly, it is small and becomes utterly negligible for
,
if any, is not recovered
unless the corresponding frequencies are considered in the analysis.
However, there are
two reasons why one should not worry about this effect: first, and more
importantly, it is small and becomes utterly negligible for
![]() a few. Furthermore, as
previously stated, this contribution is likely to get lost in any
case since it falls in a region of the time Fourier spectrum
strongly dominated by the noise
and/or, more realistically, suppressed by hardware-induced decoherence
(e.g. instrumental high passing).
We show (for the typical case
a few. Furthermore, as
previously stated, this contribution is likely to get lost in any
case since it falls in a region of the time Fourier spectrum
strongly dominated by the noise
and/or, more realistically, suppressed by hardware-induced decoherence
(e.g. instrumental high passing).
We show (for the typical case
![]() )
the angular power spectra of the CMB only
input and output maps together with their difference (lower panel of
Fig. 3). It is clear that our map-making
code recovers, as expected, the input power
spectrum to an impressively high
precision over the whole range of explored multipoles (although with
a somewhat coarser accuarcy at low
)
the angular power spectra of the CMB only
input and output maps together with their difference (lower panel of
Fig. 3). It is clear that our map-making
code recovers, as expected, the input power
spectrum to an impressively high
precision over the whole range of explored multipoles (although with
a somewhat coarser accuarcy at low ![]() 's).
The same happens when considering the case of CMB plus foregrounds
(see Fig. 4, upper panel): the level of the residuals between the
input and output map is remarkably low, underlying the
high accuracy of our code in recovering the input signal even in the
presence of sharp features (see Fig. 4, lower panel).
's).
The same happens when considering the case of CMB plus foregrounds
(see Fig. 4, upper panel): the level of the residuals between the
input and output map is remarkably low, underlying the
high accuracy of our code in recovering the input signal even in the
presence of sharp features (see Fig. 4, lower panel).
As shown above, the code also recovers to very high precision
even the broadest features in the map, i.e. the ones corresponding
to low ![]() 's. We want to stress that the CG solver converges to
the corresponding modes in a very reasonable number of iterations
(
's. We want to stress that the CG solver converges to
the corresponding modes in a very reasonable number of iterations
(
![]() 50, see Fig. 2). Other map-making codes,
implementing different solving algorithms, seem not to share
this property (Prunet et al. ) requiring more sophisticated methods
to speed up the convergence of low multipoles and/or a change
of variable to solve for the featureless noise-only map (see Doré et al. ).
50, see Fig. 2). Other map-making codes,
implementing different solving algorithms, seem not to share
this property (Prunet et al. ) requiring more sophisticated methods
to speed up the convergence of low multipoles and/or a change
of variable to solve for the featureless noise-only map (see Doré et al. ).
![\begin{figure}
\par\resizebox{8.8cm}{!}{\includegraphics[angle=-270]{h2645f05.ep...
...par\resizebox{8.8cm}{!}{\includegraphics[angle=0]{h2645f06.eps}}\par\end{figure}](/articles/aa/full/2001/22/aah2645/img134.gif) |
Figure 3: Upper panel: map-making output on "signal-only'' TOD (CMB); lower panel: angular power spectrum of the input map (dark blue line), together with the spectrum of the map given in upper panel. The two are virtually indistinguishable. The light blue line below shows the spectrum of the difference map. |
| Open with DEXTER | |
![\begin{figure}
\par\resizebox{8.8cm}{!}{\includegraphics[angle=-270]{h2645f07.eps}}\par\resizebox{8.8cm}{!}{\includegraphics[angle=-270]{h2645f08.eps}}\end{figure}](/articles/aa/full/2001/22/aah2645/img135.gif) |
Figure 4: Upper panel: map-making output on "signal-only'' TOD (CMB and main foregrounds). Lower panel: Difference between the above and input maps. |
| Open with DEXTER | |
A final comment before concluding this Section. As mentioned at the end
of Sect. 4.3, precision and accuracy are not the same thing.
We want to be sure that the CG algorithm converges to the
"true'' solution. So, from a given "signal-only''
TOD we generate different maps by changing the
solver precision.
For each of these maps we evaluate the
maximum difference in pixel value between them and the input map. The results are shown in Fig. 5 where we plot this
maximum difference, normalized to
the ![]() norm of the input map, as a function
of the required solver precision
norm of the input map, as a function
of the required solver precision ![]() .
There are two regimes separated by
.
There are two regimes separated by
![]() :
the map accuracy decreases when
:
the map accuracy decreases when ![]() gets larger and
saturates when
gets larger and
saturates when ![]() gets smaller.
So,
gets smaller.
So,
![]() is just about the right
number to have a good compromise between speed of
convergence and accuracy. In any case, any residual map error
smaller than
is just about the right
number to have a good compromise between speed of
convergence and accuracy. In any case, any residual map error
smaller than ![]()
![]() is acceptable in most applications, given the
PLANCK sensitivity goal.
is acceptable in most applications, given the
PLANCK sensitivity goal.
In the opposite limiting case of a "noise-only''
TOD (i.e.
![]() ),
the map-making solution (cf. Eqs. (3) and
(4)) gives
),
the map-making solution (cf. Eqs. (3) and
(4)) gives
![]() .
The efficiency of a map-making
code can be tested, in this case, by examining the
quality of the map obtained,
a natural figure of merit being the variance of the reconstructed
map or - better - its angular power spectrum.
.
The efficiency of a map-making
code can be tested, in this case, by examining the
quality of the map obtained,
a natural figure of merit being the variance of the reconstructed
map or - better - its angular power spectrum.
We generate a noise time stream assuming the following form
for the noise spectral density:
Figure 6 shows
the map obtained by just averaging different
observations of the same pixel (upper panel),
the ML solution (middle panel) and the angular
power spectra of the two (lower panel).
It is clear from the middle panel of this figure that
the map-making algorithm strongly suppresses the stripes due to
1/f noise, very visible in the upper panel.
This is confirmed by the angular power spectrum of the ML
map (see lower panel of Fig. 6) which is basically
flat (as expected in the case of white and isotropic noise) for
![]() .
The increasing power at
.
The increasing power at
![]() is due to two effects:
residuals
of spurious correlations in the noise and nonuniform sky
coverage due to the PLANCK scanning strategy.
In spite of that, the overall level of
instrumental noise has been considerably lowered by the map-making
algorithm.
is due to two effects:
residuals
of spurious correlations in the noise and nonuniform sky
coverage due to the PLANCK scanning strategy.
In spite of that, the overall level of
instrumental noise has been considerably lowered by the map-making
algorithm.
![\begin{figure}
\par\resizebox{8.8cm}{!}{\includegraphics[angle=0]{h2645f09.eps}}\end{figure}](/articles/aa/full/2001/22/aah2645/img148.gif) |
Figure 5:
Maximum deviation between input and output maps in the
"signal-only'' case, as a function of the solver precision.
Here
|
| Open with DEXTER | |
![\begin{figure}
\par\resizebox{8.6cm}{!}{\includegraphics[angle=-270]{h2645f10.ep...
...s}}\par\resizebox{8.6cm}{!}{\includegraphics[angle=0]{h2645f12.eps}}\end{figure}](/articles/aa/full/2001/22/aah2645/img149.gif) |
Figure 6: Upper panel: coadded map made out of a "noise-only'' TOD. Note the stripes. Middle panel: map-making solution on "noise-only'' TOD. Lower panel: angular power spectrum of the maps given above (black and blue curves, respectively). |
| Open with DEXTER | |
The noise filter or, equivalently, the inverse of the
noise spectral density, has been evaluated as
explained in Sect. 3.1.
In order to assess how good
![]() is as a noise estimator,
we use the same "noise-only'' TOD to produce two maps:
the first, by using the "true'' theoretical noise spectral
density (cf. Eq. (15)); the second,
by using the noise spectral density
estimated with
is as a noise estimator,
we use the same "noise-only'' TOD to produce two maps:
the first, by using the "true'' theoretical noise spectral
density (cf. Eq. (15)); the second,
by using the noise spectral density
estimated with
![]() .
In both cases
.
In both cases
![]() as for the map in Fig. 6.
In Fig. 7
we show, as a function of
as for the map in Fig. 6.
In Fig. 7
we show, as a function of ![]() ,
the
percentage difference between the spectra
derived from the two maps.
So, although not optimized to the
specific case of the PLANCK Surveyor, the noise
estimator
,
the
percentage difference between the spectra
derived from the two maps.
So, although not optimized to the
specific case of the PLANCK Surveyor, the noise
estimator
![]() reproduces to
quite a good extent the in-flight noise properties.
In any case,
as also shown in Fig. 7, the uncertainties
introduced in the estimate of the noise angular power spectrum are
less than those due to cosmic variance.
reproduces to
quite a good extent the in-flight noise properties.
In any case,
as also shown in Fig. 7, the uncertainties
introduced in the estimate of the noise angular power spectrum are
less than those due to cosmic variance.
As already discussed in the previous sections,
the length of the noise filter is an important issue to
carefully address.
One should expect that in the "noise-only'' case
the dependence on
![]() could be stronger because of the 1/f tail in the noise
power spectrum. To address this issue in detail and to
show the sensitivity of our results to
could be stronger because of the 1/f tail in the noise
power spectrum. To address this issue in detail and to
show the sensitivity of our results to
![]() ,
the following scheme is employed:
we generate the "true'', fully correlated
noise time stream, accordingly to Eq. (15).
Then, we do map-making using a noise filter with
,
the following scheme is employed:
we generate the "true'', fully correlated
noise time stream, accordingly to Eq. (15).
Then, we do map-making using a noise filter with
![]() ,
and
evaluate the rms of this map,
,
and
evaluate the rms of this map,
![]()
![]() .
Then, we generate a set of maps out of the same
fully correlated noise time stream,
but imposing a noise filter length,
.
Then, we generate a set of maps out of the same
fully correlated noise time stream,
but imposing a noise filter length,
![]() ,
shorter and shorter w.r.t.
,
shorter and shorter w.r.t.
![]() .
In Fig. 8 we
plot the fractional variation of the map rms w.r.t.
.
In Fig. 8 we
plot the fractional variation of the map rms w.r.t.
![]() as a function of
as a function of
![]() .
It is clear from the figure that, for the PLANCK Surveyor, we can
lower
.
It is clear from the figure that, for the PLANCK Surveyor, we can
lower
![]() by a factor of
by a factor of ![]() thousand
w.r.t.
thousand
w.r.t.
![]() and change the final rms
of the map by much less
than one percent. This shows that increasing
and change the final rms
of the map by much less
than one percent. This shows that increasing
![]() above a given threshold does not induce any significant
difference. This result holds even if
we consider knee frequencies significantly
higher than
above a given threshold does not induce any significant
difference. This result holds even if
we consider knee frequencies significantly
higher than
![]() Hz:
in Fig. 8 we also plot the effect of having
Hz:
in Fig. 8 we also plot the effect of having
![]() Hz and
Hz and
![]() Hz,
surely two very pessimistic assumptions in the
PLANCK context.
Hz,
surely two very pessimistic assumptions in the
PLANCK context.
| |
Figure 7:
Percentual difference, as a function of |
| Open with DEXTER | |
| |
Figure 8:
Shown is the percentual difference between the rms of
a "noise-only'' map obtained with a filter of length
|
| Open with DEXTER | |
| |
Figure 9:
Shown is the percentual difference between noise-only |
| Open with DEXTER | |
![\begin{figure}
\par\includegraphics[angle=90,width=8.8cm,clip]{h2645f16.eps}\par\includegraphics[angle=90,width=8.8cm,clip]{h2645f17.eps}\end{figure}](/articles/aa/full/2001/22/aah2645/img158.gif) |
Figure 10:
Upper panel: map-making output on the simulated BOOMERanG
TOD (signal plus noise). Lower panel: residual noise map obtained
subtracting the input map from the one shown above. The
maps have
|
| Open with DEXTER | |
In principle, the noise properties
of the PLANCK detectors, as described by Eq. (15),
suggest the existence of spurious correlations in
the TOD over the whole mission
life-time. In practice,
the error introduced by neglecting them is negligible,
at least when the rms is used as a figure of
merit. To stress this point even further, we evaluate the angular
power spectrum from two maps
generated with the same input (i.e. the same TOD), but using
noise filters of different lengths.
Again, we plot the percentual difference between the spectrum obtained
with
![]() and the spectra obtained with
noise filters shorter by a factor of 64 and 1024, respectively.
Figure 9 shows that this
difference is below
and the spectra obtained with
noise filters shorter by a factor of 64 and 1024, respectively.
Figure 9 shows that this
difference is below ![]() 1%
for
1%
for
![]() ,
well under cosmic
variance in the region of interest
for recovering the cosmological parameters.
,
well under cosmic
variance in the region of interest
for recovering the cosmological parameters.
To conclude this section let us note that
the algorithm discussed here is
intrinsically linear (cf. Eq. (1)) since
the map estimator can be written as the "true''
map plus a noise term:
As already mentioned, our code does not take any advantage from the specific PLANCK scanning strategy. It is then straightforwardly applicable to other one-horned experiments, such as BOOMERanG (de Bernardis et al. ). Here we do not want to enter in any data analysis issue. Rather, we want to show the flexibility and the efficiency of our code to process data coming from an experiment completely different from PLANCK.
As far as the signal is concerned, we simulate a theoretical input map9
pixelized at 1/3 of the BOOMERanG FWHM (![]() 10
10![]() @ 150 GHz)
and properly smeared.
Knowing its scanning strategy, we extract a typical
BOOMERanG "signal-only'' time
stream. As far as the noise is concerned, we generate a
"noise-only'' time stream with the noise properties described in
Eq. (15) and choosing
@ 150 GHz)
and properly smeared.
Knowing its scanning strategy, we extract a typical
BOOMERanG "signal-only'' time
stream. As far as the noise is concerned, we generate a
"noise-only'' time stream with the noise properties described in
Eq. (15) and choosing
![]() and
and
![]() Hz.
In what follows we consider a noise filter of length
Hz.
In what follows we consider a noise filter of length
![]() .
.
On the very same line of the previous subsections, we
compare the theoretical input map with
![]() ,
which is
reconstructed at a
level of accuracy of 10-5 when the CG solver precision
is chosen to be 10-6. The length
of the noise filter does not affect, even in this case, the
final results.
,
which is
reconstructed at a
level of accuracy of 10-5 when the CG solver precision
is chosen to be 10-6. The length
of the noise filter does not affect, even in this case, the
final results.
In the above tests we only consider the 1 degree per second (d.p.s.)
section of the BOOMERanG scan. However, in order to
facilitate comparisons with PLANCK,
we truncated the BOOMERanG simulated TOD at the
length of
![]() 60. Not surprisingly, our code runs the BOOMERanG
map-making in
60. Not surprisingly, our code runs the BOOMERanG
map-making in ![]() 15 min on a 500 MHz Pentium III workstation, while
the whole 1 d.p.s. BOOMERanG
scan is processed on the same machine in about 20 min.
15 min on a 500 MHz Pentium III workstation, while
the whole 1 d.p.s. BOOMERanG
scan is processed on the same machine in about 20 min.
Given these time scales, a parallel machine does not seem necessary for the analysis of a single channel. However, a parallel environment becomes quite appealing if one performs a combined analysis of more than one receiver. Also, having a parallel implementation may be important to perform extensive Monte Carlo simulations of the experiment. Specific applications of this code to BOOMERanG will be discussed elsewhere.
The purpose of this work was to present a parallel implementation of a map-making algorithm for CMB experiments. In particular, we have shown for the first time Maximum Likelihood, minimum variance maps obtained by processing the entire data stream expected from the PLANCK Surveyor, i.e. a TOD covering the full mission life span (14 months). Here we restrict ourselves to the simple case of the PLANCK/LFI 30 GHz channel. However, the extension of our implemented software to other, higher frequency, channels is straightforward. At the moment our implementation is limited to a symmetric antenna beam profile.
The code was shown to scale linearly with the number of time samples
![]() ,
logarithmically with the noise filter length and
very slowly with the number of pixels
,
logarithmically with the noise filter length and
very slowly with the number of pixels
![]() ,
the latter scaling
being mostly influenced by the choice of the preconditioner.
Furthermore, on a multiprocessor environment the code scales
nearly optimally with the number of processor elements.
,
the latter scaling
being mostly influenced by the choice of the preconditioner.
Furthermore, on a multiprocessor environment the code scales
nearly optimally with the number of processor elements.
The code is extremely accurate and fast. We have shown that it
recovers the true, input map to a remarkably
high accuracy, over the whole range of considered multipoles.
Moreover, we run the entire
30 GHz simulated TOD in ![]() 90 min on an 8 processor job on
a O2K machine, and the BOOMERanG case in only 20 min on
a 500 MHz Pentium III workstation. On the latter machine, the PLANCK
case runs in about 15 min if we perform the average on circles.
90 min on an 8 processor job on
a O2K machine, and the BOOMERanG case in only 20 min on
a 500 MHz Pentium III workstation. On the latter machine, the PLANCK
case runs in about 15 min if we perform the average on circles.
A key problem for a successful map-making pipeline is to obtain a reliable
estimate of the noise properties directly from flight data. It is
straightforward to further iterate the GLS solution implemented here
to get more accurate estimates
of the underlying noise. Here we have explicitly
chosen not to do so. Rather, we stop to the zeroth order
solution,
![]() ,
showing that this is more than enough
for the purposes discussed here.
,
showing that this is more than enough
for the purposes discussed here.
The possibility of running map-making algorithms on reasonably short time scales opens up the possibility of evaluating the CMB angular power spectrum via Monte Carlo simulations. We will address this point in a forthcoming paper, together with the extension to non-symmetric antenna beam profile.
Acknowledgements
We are indebted with C. Burigana and D. Maino for helping us with the generation of the TOD sets. We thank A. Balbi, P. Cabella, D. Marinucci and C. di Fiore for useful suggestions and comments. We also thank P. de Bernardis and the BOOMERanG collaboration for having provided us with the BOOMERanG scan and instrumental performances. PN acknowledges fruitful discussions with J. Staren and E. L. Wright. We acknowledge use of the HEALPix package and of the FFTW library. The supercomputing resources used for this work have been provided by Cineca.
![$\displaystyle {\rm exp} \left\{ - {1 \over 2} [({\vec d}^{\rm T} -
{\vec m}^{\r...
...rm N}^{-1}({\vec d} - {\rm P} {\vec m}) + {\rm Tr}(\ln {\rm N})]
\right\} \cdot$](/articles/aa/full/2001/22/aah2645/img51.gif)
![\begin{displaymath}
%
{\tilde {\vec n}} = {\vec d} - {\rm
P} ({\rm P}^{\rm T}{\r...
...}-{\rm P} ({\rm P}^{\rm T}{\rm
P})^{-1}{\rm P}^{\rm T}]\vec{n}
\end{displaymath}](/articles/aa/full/2001/22/aah2645/img56.gif)

![\begin{displaymath}%
P(f)=A[1+(\vert f\vert/f_k)^\alpha],
\end{displaymath}](/articles/aa/full/2001/22/aah2645/img141.gif)