![[*]](/icons/foot_motif.gif)
A&A 372, 59-70 (2001)
DOI: 10.1051/0004-6361:20010487
H. M. Schmid1,
- I. Appenzeller1
- M. Camenzind1
- M. Dietrich2
- J. Heidt1
- H. Schild3
- S. Wagner1
1 - Landessternwarte Heidelberg-Königstuhl,
69117 Heidelberg, Germany
2 - Dept. of Astronomy, University of Florida,
211 Bryant Space Science Center, Gainesville, FL 32611-2055, USA
3 -
Institut für Astronomie, ETH Zentrum, 8092 Zürich, Switzerland
Received 20 December 2000 / Accepted 22 March 2001
Abstract
We present high-precision optical spectropolarimetry of the Seyfert 1
galaxy Fairall 51 (F51) taken with FORS1 at the VLT. The observed
spectrum shows unpolarized and linearly polarized components.
The AGN continuum and the broad lines show (after correction for
the Galactic interstellar polarization and the light contribution
of the F51 host galaxy) a practically identical amount of intrinsic
polarization ranging from 5% in the red to 13% in the UV.
The narrow lines are unpolarized or show only little intrinsic
polarization. The observed AGN continuum and the broad line radiation can
be explained by a combination of reddened (and attenuated) direct light
and scattered light reflected from an optically thin dust region.
Hence, within the framework of the unification scheme
of AGN, the Seyfert 1 galaxy F51 appears to be an example
of a borderline Seyfert 1/Seyfert 2 case where the nucleus is partially
obscured like for other type 1 AGN with high
intrinsic scattering polarization.
It is found that the scattering region in F51 is located
far from the BLR and the continuum source. Thanks to this special
scattering configuration, we were able to study the kinematics (line profiles)
of the broad line region from two different viewing angles,
one along the line of sight (in total light) and one via the scattering region
(in polarized light). The line profiles in polarized and total light
are found to be indistinguishable to a very high accuracy, strongly
indicating that the velocity field of the F51 BLR is essentially
spherically symmetric.
Key words: galaxies: active - galaxies: Seyfert - galaxies: individual: F 51 - polarization - scattering
Seyfert galaxies often show intrinsic optical linear polarization (Martin et al. 1983; Brindle et al. 1990a). This polarization can be produced by scattering of the emission from the nucleus, of the broad line region (BLR), or of the narrow line region (NLR) by dust particles or electrons in an asymmetric geometry. Another effect producing polarization is ("dichroic'') absorption due to aligned dust grains in the host galaxy. Furthermore, active galactic nuclei (AGN) with significant radio-emission may also emit polarized optical synchrotron radiation (e.g. Angel & Stockman 1980).
One of the major advances in the research of AGN was the finding that Seyfert 2 galaxies often show prominent Seyfert 1 characteristics (like broad emission lines) in polarized light. This indicates that at least some of the type 2 Seyfert nuclei are in fact partially obscured type 1s, a result which provided the key for the unification of Seyfert galaxies and other classes of AGN (Antonucci & Miller 1985; Miller & Goodrich 1990; Antonucci 1993; Cohen et al. 1999).
On the other hand, there exist also classical Seyfert 1 galaxies with strongly polarized BLR and continuum emission. An example is the Seyfert 1 galaxy Fairall 51, where high polarization had been noticed already by Martin et al. (1983), Thompson & Martin (1988) and Brindle (1990a, 1990b). As F51 is a radio-quiet object, synchrotron emission can be neglected as contribution to the polarization spectrum. The high polarization, therefore, indicates that a substantial fraction of the observed light is scattered by dust or free electrons in the system.
In order to investigate the origin of the polarization of F51 and the
geometry of the system we carried out spectropolarimetry with
a high signal-to-noise ratio using the VLT and FORS1.
In this paper we report the results of these observations.
A preliminary report of this work and of
observations of other Seyfert 1 galaxies is given in
Schmid et al. (2000).
| grism |  -range -range |
Res. | date | UT
 |
 |
| [Å] | [Å] | 1999 | hh:mm | min | |
| G600R | 5400-7500 | 4.2 | Aug. 21 | 00:06 | 20 |
| 00:35 | 80 | ||||
| 02:06 | 80 | ||||
| G600B | 3600-6000 | 4.7 | Aug. 22 | 01:25 | 60 |
| 02:37 | 60 | ||||
| 03:50 | 40 | ||||
| G600I | 7000-9200 | 4.2 | Aug. 22 | 04:42a | 60 |
Optical spectropolarimetry of F51 was performed during the two nights of August 21 and 22, 1999 with FORS1 at the ESO VLT Unit Telescope UT 1 (Antu). FORS1 is a multi-mode focal reducer imager and grism spectrograph equipped with a Wollaston prism and rotatable retarder plate mosaics in the parallel beam allowing linear and circular polarimetry and spectropolarimetry (Appenzeller et al. 1998).
We obtained three complete sets of polarization frames with the G600R and
the G600B grisms. An additional set with the G600I grism was taken
to extend the wavelength coverage towards the near infrared.
A log of the observations is given in Table 1.
With a slit width of 0.8'' we obtained a
(FWHM) spectral resolution of  4.5 Å (see Table 1)
corresponding to a velocity resolution of about 200 kms-1 near H
4.5 Å (see Table 1)
corresponding to a velocity resolution of about 200 kms-1 near H and
350 kms-1 around 4000 Å. The seeing for these observations
was around 0.8'' in both nights.
and
350 kms-1 around 4000 Å. The seeing for these observations
was around 0.8'' in both nights.
The linear polarization was measured in a standard way
(e.g. Tinbergen & Rutten 1997) with sets of four observations
taken at half-wave plate position angles of  ,
,
 ,
,
 ,
,
 ,
respectively.
The data were recorded with a
,
respectively.
The data were recorded with a
 CCD with a pixel scale of 0.2''/pixel in spatial and 1 Å/pixel in
spectral direction.
CCD with a pixel scale of 0.2''/pixel in spatial and 1 Å/pixel in
spectral direction.
In addition to the
Seyfert 1 galaxies we observed polarized (HD 126593,
BD+25
 727)
and unpolarized (HD 176425, BD+28
2411)
standard stars for checking and correcting the instrumental effects.
As not enough
good observations of the unpolarized standard stars
could be obtained, the telescope instrumental polarization
at the time of the observations (of the order 0.1%) could not be
determined well. Therefore, a systematic error of
727)
and unpolarized (HD 176425, BD+28
2411)
standard stars for checking and correcting the instrumental effects.
As not enough
good observations of the unpolarized standard stars
could be obtained, the telescope instrumental polarization
at the time of the observations (of the order 0.1%) could not be
determined well. Therefore, a systematic error of
 ,
,
 may be present in our polarization data.
In view of the observed
polarization effects of 5% to 12% this potential error has no
effect on our conclusions, but its presence has to be taken into
account when comparing our data to other precise polarization
measurements. The photon noise errors are generally below
may be present in our polarization data.
In view of the observed
polarization effects of 5% to 12% this potential error has no
effect on our conclusions, but its presence has to be taken into
account when comparing our data to other precise polarization
measurements. The photon noise errors are generally below
 .
Because of a reflex image from the FORS optics in our
G600B data, the wavelength region
from 4000 to 4100 Å (marked in Fig. 1) was not used in
our analysis. The reflex is known to occur for this special
Grism/Wollaston configuration.
.
Because of a reflex image from the FORS optics in our
G600B data, the wavelength region
from 4000 to 4100 Å (marked in Fig. 1) was not used in
our analysis. The reflex is known to occur for this special
Grism/Wollaston configuration.
BD+28
2411 is also a spectrophotometric standard star and
was observed with a wide slit (5'') for the calibration of
the intensity spectrum. This calibration was applied to the
F51 spectra, but no correction for the
(substantial) slit losses at the
0.8'' wide and 8'' long slit aperture was made.
Nonetheless, we obtained a very good match (better than 5%)
in the overlap region of the G600B and G600R flux spectra, indicating
that the relative energy distribution (colour calibration) for
the nuclear spectrum of F51 is accurate. The flux scale of the
G600I spectrum turned out to be about 10% lower compared to the
G600R spectrum. This can be explained by a small pointing offset.
We therefore adjusted the flux of the G600I spectrum to the G600R
scale.
5 kpc) on both sides of the nucleus
in north-south direction (West et al. 1978;
Malkan et al. 1998).
The 20''-long slit was placed along the bar and the spectrum
of the core was extracted from a 8''-wide strip.
From the remaining slit region the spectrum of the host galaxy was
obtained.
Because of the long integration time required for spectropolarimetry
we obtained as a byproduct very high S/N intensity spectra of F51
(see Fig. 1). The core spectrum of F51
shows a rather flat continuum (in  )
and the typical BLR
lines of H I, He I and Fe II
with widths of about
)
and the typical BLR
lines of H I, He I and Fe II
with widths of about
 kms-1(FWHM). In addition, the spectrum displays strong NLR emissions of
H I, [N II], [O III]
etc., and forbidden high-excitation lines such as [Fe VII] and
[Fe X]. Observed flux values (uncorrected for slit losses)
for the narrow lines,
the broad lines, and 200 Å-wide "continuum'' intervals are
given in Tables 2-4, respectively.
kms-1(FWHM). In addition, the spectrum displays strong NLR emissions of
H I, [N II], [O III]
etc., and forbidden high-excitation lines such as [Fe VII] and
[Fe X]. Observed flux values (uncorrected for slit losses)
for the narrow lines,
the broad lines, and 200 Å-wide "continuum'' intervals are
given in Tables 2-4, respectively.
 |
line |
 |
 |
 |
| [Å] | [10-15] | [%] | [ ] ] |
|
| 3780.6 | [O II] | 13.0 | <4 | |
| 3810.6 | [Fe VII] | 2.6 | ||
| 3923.5 | [Ne III] | 10.1 | <4 | |
| 3944.6 | H8 | 2.0 | ||
| 4024.4 | [Ne III] | 2.8 | ||
| 4126.8 | [S II] | 0.7 | ||
| 4160.0 | H |
1.5 | ||
| 4402.0 | H |
3.3 | ||
| 4424.9 | [O III] | 1.4 | ||
| 4751.0 | He II | 4.3 | <4 | |
| 4929.9 | H |
9.4 | <2 | |
| 5028.5 | [O III] | 38.0 |
 |
 |
| 5077.1 | [O III] | 123. |
 |
 |
| 5800.1 | [Fe VII] | 3.3 | <4 | |
| 5959.0 | He I | 1.5 | ||
| 6169.8 | [Fe VII] | 7.5 | <3 | |
| 6390b | [O I] | 3.6 | ||
| 6400b | [S III] | 0.6 | ||
| 6455b | [O I] | 1.7 | ||
| 6462b | [Fe X] | 1.3 | ||
| 6641.2 | [N II] | 10.1 | <3 | |
| 6655.7 | H |
42.1 | <1.5 | |
| 6676.9 | [N II] | 24.7 | <2 | |
| 6811.7 | [S II] | 10.1 | <2 | |
| 6826.4 | [S II] | 10.2 | <2 | |
| 7237.2 | [Ar III] | 1.6 | ||
| 7423b | [O II] | 1.3 | ||
| 7433b | [O II] | 1.1 |
| a: The [O III] line polarizations after correction for the Galactic interstellar polarization are: | |
| Open with DEXTER | |
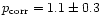 %, %,
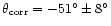 for [O III] at 5028 Å
| |
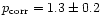 %, %,
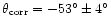 for [O III] at 5077 Å. for [O III] at 5077 Å.
| |
| b: Line center measurement affected by nearby line. | |
The observed continuum flux of our spectra is about
a factor of two lower than published spectrophotometry of
Morris & Ward (1988) and Winkler (1992). For the
narrow line flux of [O II] and [S II], the factor is even
larger (3.5).
At least part of this apparent discrepancy is due to light losses
at the 0.8'' slit used in our observation in order to
keep the spectral resolution high. The narrow low-excitation
lines [N II] and [S II] are expected to originate from
a more extended region, which explains their relative weakness in our spectra
compared to previous observations taken with much wider slits.
From the published spectral plots (Morris & Ward 1988;
Winkler 1992) we infer that the continuum flux
distribution
from 3800-9000 Å is practically flat
to an accuracy of about 15%. Our data yield the same result, confirming
our relative photometric calibration.
Nebular line analysis yields for the NLR an electron density
of
 from the [S II] doublet ratio
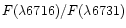 and an electron temperature of
 from the [O III] ratio
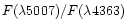 (dereddened by
EB-V=0.6,
see below).
(dereddened by
EB-V=0.6,
see below).
Stellar and interstellar absorptions from the host galaxy are clearly visible in the core spectrum for the Ca II K and Na I resonance lines and the Ca II triplet near 8600 Å. These lines can be recognized because they fall into spectral regions with not too strong nuclear emission features.
/H
and
H/H,
respectively. Alternatively, a reddening of
EB-V=0.65 is derived from the combination of
[S II] and [O II] line ratios (Allen 1979).
The accuracy of the different extinction measurements is discussed
in detail in e.g. Malkan (1983) and Tsvetanov & Yancoulova
(1989). The conclusion is that
the S II-O II-method and the H/H-ratios
seem to be the most reliable, while the H/H-ratio may
be disturbed by various effects. According to Tsvetanov & Yancoulova
(1989)
the S II-O II-value should be corrected by
about -0.08 mag to account for density inhomogeneities in the NLR.
Therefore we adopt here a value of
EB-V=0.60 for
the reddening of the NLR-spectrum.
That the nucleus of F51 is substantially reddened
was also noticed by Winkler (1997) in a study of the colours of
the variable nuclear component. He found a nuclear reddening
of
EB-V=0.58 based on the assumption that
the nuclear variations are grey and the intrinsic nuclear
colours of F51 are equal to unobscured Seyfert 1 objects
like Mrk 509 or Ark 120.
Due to the intermediate Galactic latitude
 of F51 Galactic reddening cannot be neglected.
This contribution can be estimated from
the maps of IR dust emission
(Schlegel et al. 1998/NED database),
which indicate
EB-V=0.11. Alternatively, we can use
foreground
stars as probes of the Galactic extinction towards F51.
The bright Be star
Pav, located only 38' east and 10'
north of F51 is extremely well suited to this purpose.
Already existing extinction values for
Pav are
EB-V=0.09 or 0.10 and a distance of 400 pc
(Jenkins 1978; Zorec & Briot 1991). Thus, we attribute
a reddening of
EB-V=0.10 in the F51 spectrum
to the dust in the Milky Way disk.
Comparing this value with the total reddening
derived above indicates that extinction by dust in the host
galaxy is the main cause of the reddening, while dust in the Milky Way
contributes to a lesser extent.
of F51 Galactic reddening cannot be neglected.
This contribution can be estimated from
the maps of IR dust emission
(Schlegel et al. 1998/NED database),
which indicate
EB-V=0.11. Alternatively, we can use
foreground
stars as probes of the Galactic extinction towards F51.
The bright Be star
Pav, located only 38' east and 10'
north of F51 is extremely well suited to this purpose.
Already existing extinction values for
Pav are
EB-V=0.09 or 0.10 and a distance of 400 pc
(Jenkins 1978; Zorec & Briot 1991). Thus, we attribute
a reddening of
EB-V=0.10 in the F51 spectrum
to the dust in the Milky Way disk.
Comparing this value with the total reddening
derived above indicates that extinction by dust in the host
galaxy is the main cause of the reddening, while dust in the Milky Way
contributes to a lesser extent.
![\begin{figure}
\par\includegraphics[angle=-90,width=10cm,clip]{ms10589f1.ps}
\end{figure}](/articles/aa/full/2001/22/aa10589/img64.gif) |
Figure 1:
VLT-spectropolarimetry of F51. The top panel gives the flux spectrum
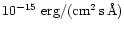
in units of
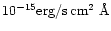 of the bright core (solid) and the scaled spectrum from
the bar of the host galaxy of the bright core (solid) and the scaled spectrum from
the bar of the host galaxy
 (dashed). The polarized flux
spectrum
(dashed). The polarized flux
spectrum
 is plotted in the second panel.
The third panel shows the relative linear polarization
and the relative polarization of the active nucleus
is plotted in the second panel.
The third panel shows the relative linear polarization
and the relative polarization of the active nucleus
 corrected for the Galactic
interstellar polarization. The spectrum from
the active nucleus
corrected for the Galactic
interstellar polarization. The spectrum from
the active nucleus
 is the top spectrum
with the narrow lines and the galaxy spectrum
subtracted.
The solid curve in the bottom panel is the measured polarization
position angle, while the dashed curve is the binned position angle intrinsic
to F51 after correction for the Galactic interstellar polarization.
The short lines from 4000 Å to 4100 Å mark the region contaminated
by the reflex described in Sect. 2.
is the top spectrum
with the narrow lines and the galaxy spectrum
subtracted.
The solid curve in the bottom panel is the measured polarization
position angle, while the dashed curve is the binned position angle intrinsic
to F51 after correction for the Galactic interstellar polarization.
The short lines from 4000 Å to 4100 Å mark the region contaminated
by the reflex described in Sect. 2. |
The solid curves in Figs. 1 and 2 represent the spectropolarimetric results obtained for F51.
The observed linear polarization
and position
angles
for the narrow lines, for the broad lines, and for continuum intervals
are listed in the Tables 2-4,
respectively.
The main results can be summarized as follows:
in the
continuum rises from
about 3% at 8500 Å to 11% at 3700 Å. This rise has been
reported by Martin et al. (1983) and
Thompson & Martin (1988)
on the basis of multi-filter polarimetry taken in April 1980.
Compared to the total flux, the colours of the polarized
flux  are significantly bluer by about
B-V=0.35 mag;
5876 lines and
the broad Fe II feature at 5200
show a higher relative
polarization
than the adjacent continuum.
The polarization of the Balmer lines H,
H,
H,
and H
shows roughly the same wavelength dependence as
the continuum, but at a level which is about 1.6 times higher;
and H
lines
are practically identical in total and polarized light (Fig. 2).
Even subtle structural features like the more extended blue
wing are in very good agreement between the total and the polarized
flux profiles;
are significantly bluer by about
B-V=0.35 mag;
5876 lines and
the broad Fe II feature at 5200
show a higher relative
polarization
than the adjacent continuum.
The polarization of the Balmer lines H,
H,
H,
and H
shows roughly the same wavelength dependence as
the continuum, but at a level which is about 1.6 times higher;
and H
lines
are practically identical in total and polarized light (Fig. 2).
Even subtle structural features like the more extended blue
wing are in very good agreement between the total and the polarized
flux profiles;
 to
to
 is visible in Fig. 1
in the position angle across the H
line profile.
This feature can be explained by a second
polarization component of
is visible in Fig. 1
in the position angle across the H
line profile.
This feature can be explained by a second
polarization component of
 in the H
line wings with a position angle of roughly
in the H
line wings with a position angle of roughly
 in the blue wing and
  in the red
wing.
This small line wing polarization component
is more than an order of magnitude smaller than the main
polarization component of
in the red
wing.
This small line wing polarization component
is more than an order of magnitude smaller than the main
polarization component of  at
at
 in
H
(Table 3) and only visible due to the very high
quality of our data;
in
H
(Table 3) and only visible due to the very high
quality of our data;
| line |
|
|
|
 |
 |
errors |
| [%] | [] |
[%] | [] |
![$[\%/^\circ]$](/articles/aa/full/2001/22/aa10589/img73.gif) |
||
| H |
16.8 | 12.0 | -42.3 | 12.0 | -44.8 | 2.4/5.7 |
| H |
44.3 | 9.2 | -39.3 | 9.1 | -42.6 | 0.7/2.2 |
| Fe II 4570 | 63.3 | 5.8 | -37.4 | 5.6 | -42.6 | 1.6/8.9 |
| H |
143. | 8.5 | -38.3 | 8.3 | -41.8 | 0.6/2.0 |
| Fe II 5200 | 44.6 | 7.1 | -37.7 | 7.3 | -42.2 | 1.1/4.4 |
| He I 5876 | 24.7 | 8.8 | -36.9 | 8.7 | -40.5 | 1.6/5.2 |
| H |
753. | 5.8 | -37.2 | 5.6 | -42.5 | 0.2/1.0 |
| O I 8446 | 24.5 | 4.8 | -40.4 | 5.3 | -45.2 | 2.0/11.3 |
| interval |
|
|
|
|
 |
 |
 |
[%] | [] |
[%] | [] |
||
| 3600-3800 | 1.56 | 10.0 | -39.9 | 1.22 | 12.7 | -42.3 |
| 3800-4000 | 1.83 | 8.7 | -39.4 | 1.42 | 11.0 | -42.3 |
| 4000-4200a | ||||||
| 4200-4400 | 1.88 | 7.2 | -39.3 | 1.40 | 9.5 | -43.0 |
| 4400-4800 | 2.13 | 6.5 | -38.7 | 1.53 | 8.8 | -43.0 |
| 4800-5200b | 2.86 | 5.3 | -38.0 | 1.78 | 8.2 | -43.5 |
| 5200-5600 | 2.08 | 5.2 | -37.7 | 1.44 | 7.3 | -43.2 |
| 5600-6000 | 2.04 | 4.7 | -36.9 | 1.38 | 6.6 | -43.3 |
| 6000-6400 | 2.03 | 4.2 | -36.7 | 1.35 | 6.1 | -43.5 |
| 6400-6800c | 4.17 | 4.6 | -37.0 | 3.27 | 5.7 | -43.1 |
| 6800-7200 | 2.07 | 3.7 | -36.0 | 1.33 | 5.4 | -43.4 |
| 7200-7600d | 1.94 | 3.2 | -35.6 | 1.22 | 5.0 | -43.7 |
| 7600-8000d | 1.76 | 2.8 | -37.0 | 1.09 | 4.5 | -46.0 |
| 8000-8400d | 1.77 | 2.9 | -35.5 | 1.10 | 4.4 | -43.9 |
| 8400-8800 | 1.88 | 2.9 | -35.4 | 1.21 | 4.3 | -43.3 |
| 8800-9100d | 1.60 | 2.6 | -34.6 | 0.98 | 4.0 | -43.1 |
| a: Affected by reflected light. | |
| Open with DEXTER | |
| b:
Includes the strong H
and [O III] emission lines. | |
|
c:
Includes the strong H
line. | |
|
d:
Includes strong telluric absorption, which are not corrected for
the
and
values. | |
and
in Tables 2-4
were calculated from the Stokes Q and U spectra according
to
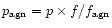
p = (Q2+U2)1/2/f, where f is identical to Stokes I,
and
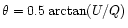 .
.
The errors for the continuum polarization listed in Table 4
are dominated
by the error introduced by the inaccurate derivation of the
instrumental polarization and are about 0.15% for p and  for
for  .
The accuracy of the
polarization of the broad lines
(Table 3) is mainly due to uncertainties in the continuum
definition. The errors
are, therefore, larger for weaker lines and the broad Fe II features.
The spectral resolution of our data is sufficiently high to correct
accurately for the narrow line emission in the flux spectrum.
The continuum level in the Q-, U-, and f-spectra was defined by a
straight line between two line free intervals on both sides of
the broad line. The polarization of the narrow [O III] lines
can be determined with high accuracy. More difficult is a
polarization measurement in the narrow H
component. A weak signal seems to be present in the Stokes Q spectrum.
But no significant measurement was possible due to
uncertainties in defining the underlying broad component
and [N II] features.
The upper limits given for the other narrow lines are
.
The accuracy of the
polarization of the broad lines
(Table 3) is mainly due to uncertainties in the continuum
definition. The errors
are, therefore, larger for weaker lines and the broad Fe II features.
The spectral resolution of our data is sufficiently high to correct
accurately for the narrow line emission in the flux spectrum.
The continuum level in the Q-, U-, and f-spectra was defined by a
straight line between two line free intervals on both sides of
the broad line. The polarization of the narrow [O III] lines
can be determined with high accuracy. More difficult is a
polarization measurement in the narrow H
component. A weak signal seems to be present in the Stokes Q spectrum.
But no significant measurement was possible due to
uncertainties in defining the underlying broad component
and [N II] features.
The upper limits given for the other narrow lines are
 -values that take into account the photon statistics for the
narrow line
and the noise level in the adjacent spectral region (continuum, broad lines).
-values that take into account the photon statistics for the
narrow line
and the noise level in the adjacent spectral region (continuum, broad lines).
![\begin{figure}
\par\includegraphics[angle=-90,width=9cm,clip]{ms10589f2.ps}
\end{figure}](/articles/aa/full/2001/22/aa10589/img79.gif) |
Figure 2:
Observed polarization of the H/[O III] and
the H-region of F51. Upper panel: Comparison of
the H
and H
broad line profiles in the flux (thin line and flux
scale) and polarized flux spectrum (thick line). The dotted line
indicates the level of zero line flux (continuum level) for both
the f and the
spectrum. For comparison purposes the
-profiles are normalized to the f-profiles for the broad lines.
The similarity between f and
shows that the structures
of the broad H
and H
components are essentially identical
in polarized and total light.
Lower panel: the observed linear polarization. |
Some information on the Galactic interstellar polarization along
the line of sight towards F51 has been obtained by simultaneous
measurements of a field star (star #6 of the F51 photometric sequence of
Hamuy & Maza (1989)) which was in slit #16 of the polarimetric
focal plane mask formed by the FORS MOS unit.
For this object
we obtained a polarization of
 ,
,
 for the
 range. According to our spectrum
this star has a spectral type of G8 in agreement with the colours
of Hamuy & Maza (1989) and an estimated Galactic reddening of
EB-V=0.10 (Sect. 3.1). Assuming that this is a G8 V dwarf
with mV=15.6 it is located at a distance of roughly 1 kpc, far enough
to probe the entire interstellar polarization in the Galactic plane.
range. According to our spectrum
this star has a spectral type of G8 in agreement with the colours
of Hamuy & Maza (1989) and an estimated Galactic reddening of
EB-V=0.10 (Sect. 3.1). Assuming that this is a G8 V dwarf
with mV=15.6 it is located at a distance of roughly 1 kpc, far enough
to probe the entire interstellar polarization in the Galactic plane.
Unfortunately, we found no really suitable nearby object in the
literature to cross-check our interstellar polarization determination.
The close (40' away) Be star
Pav is known to have a
variable intrinsic polarization (Serkowski 1970).
However, the Galactic polarization maps of Mathewson & Ford
(1970) and the corresponding
catalogues (Mathewson et al. 1978) for stellar
polarization data indicate that the interstellar polarization
in the region of F51
is rather homogeneous on relatively large scales.
Therefore, it seems likely that HD 167128, which is 7
away
from F51 still has a similar interstellar polarization.
The polarization of this star  ,
,
 agrees
well with star 6 in the F51 field and therefore provides some
independent support
(despite the large separation) that the Galactic
interstellar polarization derived from star # 6 is correct for F51.
Therefore, we correct our F51
measurements for Galactic interstellar
polarization by subtracting the relative Stokes parameters of
star # 6, assuming
a Serkowski law (Serkowski et al. 1975)
with
agrees
well with star 6 in the F51 field and therefore provides some
independent support
(despite the large separation) that the Galactic
interstellar polarization derived from star # 6 is correct for F51.
Therefore, we correct our F51
measurements for Galactic interstellar
polarization by subtracting the relative Stokes parameters of
star # 6, assuming
a Serkowski law (Serkowski et al. 1975)
with
 ,
,
 Å and
Å and
 .
.
Applying this correction to the F51 data strongly reduces
the angle rotation from blue to red. In fact, the observed
rotation from blue to red of
 in the continuum
polarization disappears to
in the continuum
polarization disappears to
 (see
(see
 in Table 4 and Fig. 1).
Such a behaviour is expected if an interstellar correction
is applied to a polarized source with one predominant polarization
angle. This can therefore be considered as further support for
the adopted Galactic interstellar polarization. The position angle
of the corrected polarization is close to
in Table 4 and Fig. 1).
Such a behaviour is expected if an interstellar correction
is applied to a polarized source with one predominant polarization
angle. This can therefore be considered as further support for
the adopted Galactic interstellar polarization. The position angle
of the corrected polarization is close to  for both the broad lines and the continuum
(Tables 3, 4). The amount of polarization p is
hardly affected by the
Galactic interstellar correction as can be seen from
and
in Table 3. Note that
for both the broad lines and the continuum
(Tables 3, 4). The amount of polarization p is
hardly affected by the
Galactic interstellar correction as can be seen from
and
in Table 3. Note that
 in Table 4 includes also a correction for the
light contamination by the host galaxy.
in Table 4 includes also a correction for the
light contamination by the host galaxy.
As pointed out in Sect. 3.2, most of the substantial reddening
of
 mag derived for the narrow-line spectrum
must be due to dust absorption in the host galaxy.
Hence we have to investigate whether dichroic dust
absorption in the host galaxy introduces another polarization
component. In view of the moderate inclination angle of
F51, the dust absorption certainly does not occur in a spiral
arm, as in the case of interstellar extinction and polarization
in the solar neighborhood. Therefore it is difficult to predict
how much polarization one should expect on the basis of the
observed reddening.
mag derived for the narrow-line spectrum
must be due to dust absorption in the host galaxy.
Hence we have to investigate whether dichroic dust
absorption in the host galaxy introduces another polarization
component. In view of the moderate inclination angle of
F51, the dust absorption certainly does not occur in a spiral
arm, as in the case of interstellar extinction and polarization
in the solar neighborhood. Therefore it is difficult to predict
how much polarization one should expect on the basis of the
observed reddening.
An upper limit for the interstellar polarization in the host galaxy
can be estimated from the polarization of the narrow emission
lines. As listed in Table 2 (and its footnote) the polarization
of the [O III] lines (corrected for the Galactic interstellar
polarization) is about 1.2% . For the other (much weaker) narrow lines
no statistically significant results could be obtained. But,
as illustrated in Figs. 1 and 2, some narrow lines (e.g. the weak
[S II] doublet) show a weak signal in polarized flux.
For all these lines the amount of polarized flux
(and the amount of polarization) is within the
error limits well compatible with the assumption that all narrow lines
(including the narrow components of the Balmer lines) show the same
intrinsic polarization as the [O III] lines.
Therefore, we cannot rule out that some of the small polarization observed in
[O III] and the other narrow lines is indeed produced by dichroic
absorption and forward scattering by aligned dust grains in the host galaxy.
![\begin{figure}
\par\includegraphics[angle=-90,width=8.8cm,clip]{ms10589f3.ps}
\end{figure}](/articles/aa/full/2001/22/aa10589/img93.gif) |
Figure 3:
Profiles of
the narrow [O III] lines in total and polarized flux.
Note the more extended blue wings in the polarized flux profile.
Both spectra are scaled and shifted such that the
continuum between the two lines is zero and the peak of the
 Å
transition at 5077 Å is equal to one. Å
transition at 5077 Å is equal to one. |
| Open with DEXTER | |
On the other hand, from Fig. 3
we see that the [O III] line profiles
differ significantly between the intensity (flux) spectrum and the polarized
flux spectrum. At least the stronger [O III]
line shows an extended blue wing in
that is not present in f.
A similar extension can be seen in the weaker [O III]
line although the signal is comparable to the noise level.
Such a line profile change cannot be produced by absorbing
or forward scattering dust. Therefore, we regard it as more likely that
interstellar polarization in the host galaxy is negligible and that
the polarization in the [O III] lines is caused by scattering of
line photons in an asymmetric scattering geometry. The fact that
the polarized line profile extends towards the blue would
further indicate that the corresponding scattering region is moving
toward the [O III] emittion gas. We strongly favour this
possibility and therefore make no correction for
interstellar polarization in the host galaxy.
We note that even if all the polarization observed in [O III] should in fact be due to host galaxy interstellar polarization, neglecting this component would have practically no effect on our analysis. This is because the [O III] polarization is much smaller than the continuum and BLR polarization and the position angles of this component is (in contrast to the Galactic interstellar component) almost identical to that of the intrinsic continuum and BLR polarization.
For the interpretation of the scattering polarization it is essential
to separate the emission from the active nucleus, the host galaxy
and the narrow line region according to
 .
The narrow lines are
well defined in our data and can be accurately separated from broad
lines and continuum. The separation of the spectra of the host galaxy
and the active nucleus
.
The narrow lines are
well defined in our data and can be accurately separated from broad
lines and continuum. The separation of the spectra of the host galaxy
and the active nucleus
 is more difficult.
An estimate of the host galaxy flux can be obtained
from the strength of the Ca II triplet absorptions
8498, 8542, 8662 Å.
Terlevich et al. (1990) studied the
strengths of the Ca II triplet
lines in the nuclear region of normal and active galaxies. They found
that the equivalent widths of the Ca II lines show only a small
spread of about  Å around a mean value of 7 Å. This result
is largely independent of the nucleus type, such as
LINER, starburst or Seyfert 2. Following their recipe, we measure
Å around a mean value of 7 Å. This result
is largely independent of the nucleus type, such as
LINER, starburst or Seyfert 2. Following their recipe, we measure
 Å for the Ca II triplet equivalent width in F51.
From this we can conclude that the host galaxy
of F51 contributes about
30% to the total spectrum in this wavelength region.
As F51 is a Seyfert 1 galaxy where peculiar line emission from
the H I Paschen series and the Ca II triplet cannot be excluded, it is difficult to make a statement about the
accuracy of this estimate.
Å for the Ca II triplet equivalent width in F51.
From this we can conclude that the host galaxy
of F51 contributes about
30% to the total spectrum in this wavelength region.
As F51 is a Seyfert 1 galaxy where peculiar line emission from
the H I Paschen series and the Ca II triplet cannot be excluded, it is difficult to make a statement about the
accuracy of this estimate.
To obtain a template which would allow correcting for the host galaxy
flux, we observed the spectrum of the bar region of
F51. This spectrum was recorded on both sides of the 8'' wide
core region. The spectrum contains the typical stellar absorptions
of galaxies, emission lines from H II regions and some
contamination from scattered light and the seeing halo of the
very strong H
emission of the F51 core. Emission lines and
the H
contamination were clipped
and the resulting spectrum smoothed. This "host galaxy spectrum''
was then normalized in order to match the expected contribution of
stellar light in the core region and subtracted from the
observed spectrum of the core.
Interestingly, we find that the resulting relative polarization
spectrum of the active nucleus
 (see below)
becomes practically
featureless, i.e. the BLR features disappear in the
-spectrum
since continuum and lines now show the same polarization.
The smoothest
(see below)
becomes practically
featureless, i.e. the BLR features disappear in the
-spectrum
since continuum and lines now show the same polarization.
The smoothest
 -spectrum
is obtained for a host galaxy contribution of 35-40% to the total
continuum near the Ca II triplet.
Such a behaviour (i.e. broad lines and continuum showing the same
polarization) is expected if the nuclear continuum and the emission of the
BLR are scattered by the same medium and have the same scattering geometry.
This would be fulfilled in cases where the distance to the main
scattering region is much larger than the size of the continuum
and broad line region.
-spectrum
is obtained for a host galaxy contribution of 35-40% to the total
continuum near the Ca II triplet.
Such a behaviour (i.e. broad lines and continuum showing the same
polarization) is expected if the nuclear continuum and the emission of the
BLR are scattered by the same medium and have the same scattering geometry.
This would be fulfilled in cases where the distance to the main
scattering region is much larger than the size of the continuum
and broad line region.
Thus, it seems warranted to improve the rough
estimate on the host galaxy contribution from the Ca. II lines using
the smoothness of the resulting polarization spectrum
.
Based on this, we adopt in the following that the
host galaxy contributes 38% of the light of the observed core spectrum
at the wavelength of the Ca II triplet. The corresponding smoothed
spectrum is plotted in Fig. 1.
The AGN spectrum
obtained by subtracting the
host galaxy is plotted in Fig. 4. The relative polarization
corrected for the interstellar polarization and the dilution by
the host galaxy and the narrow lines was derived according to
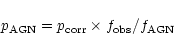 spectrum due to the intrinsic narrow line polarization.
The relative polarization spectrum
obtained with the
procedure described above is
practically featureless apart from a smooth
slope from
spectrum due to the intrinsic narrow line polarization.
The relative polarization spectrum
obtained with the
procedure described above is
practically featureless apart from a smooth
slope from
 at 3700 Å
to
at 3700 Å
to
 around 8500 Å (Table 2).
We note that this result depends on the assumed
strength and colour of the host galaxy contribution.
An error in the derivation of the host galaxy contribution by a factor of 1.3
would increase or decrease
by about  to
to  in the red and the blue respectively. Moreover, we have assumed that
the spectrum of the stellar populations in the bar and core region
of F51 have a similar spectral distribution.
This must not be true given the possibility that there could be
different stellar populations and, in particular, different dust
reddening. However, the spectral slope of the host galaxy
contribution must deviate very strongly from the adopted one to
put our result of a practically featureless polarization spectrum
into question.
in the red and the blue respectively. Moreover, we have assumed that
the spectrum of the stellar populations in the bar and core region
of F51 have a similar spectral distribution.
This must not be true given the possibility that there could be
different stellar populations and, in particular, different dust
reddening. However, the spectral slope of the host galaxy
contribution must deviate very strongly from the adopted one to
put our result of a practically featureless polarization spectrum
into question.
 is composed
of two components, the direct nuclear light
is composed
of two components, the direct nuclear light
 and the anisotropically scattered (and thus polarized)
nuclear light
and the anisotropically scattered (and thus polarized)
nuclear light
 .
The
original source for both components is the intrinsic
nuclear spectrum
.
The
original source for both components is the intrinsic
nuclear spectrum
 .
In general, due to
different aspect angles,
can be different for the direct light and the scattered light,
and
.
In general, due to
different aspect angles,
can be different for the direct light and the scattered light,
and
 and
and
 need not be identical. The intrinsic spectrum is modified by
extinction
need not be identical. The intrinsic spectrum is modified by
extinction
 and in the case
of the scattered radiation also by the function
and in the case
of the scattered radiation also by the function
 describing the properties of the scattering medium and geometry. Thus
with these assumptions the
observed flux can be written as:
describing the properties of the scattering medium and geometry. Thus
with these assumptions the
observed flux can be written as:
 and
and
 describe the relative
polarization for the direct and the scattered radiation.
Of course,
describe the relative
polarization for the direct and the scattered radiation.
Of course,  and
and  in Eq. (2) can be split up further
as in Eq. (1).
in Eq. (2) can be split up further
as in Eq. (1).
The quantities in Eqs. (1) and (2) derived from
the observations are
and
.
From these, it is normally not possible to derive the wavelength dependent
functions
,
,
 ,
,
 ,
,
 ,
,
 and
and  .
However, with some reasonable assumptions and simplifications
we can split
the AGN flux
and polarized flux spectrum
.
However, with some reasonable assumptions and simplifications
we can split
the AGN flux
and polarized flux spectrum
 into a reddened
(
into a reddened
(
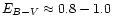 mag) direct component ,
and
a scattered component .
mag) direct component ,
and
a scattered component .
For this purpose we make the following assumptions:
 ).
This is supported by the observed broad line
profiles, which are identical in total and polarized flux;
).
This is supported by the observed broad line
profiles, which are identical in total and polarized flux;
is assumed to have
a spectral energy distribution similar to unreddened (unobscured)
Seyfert 1 nuclei. According to Winkler (1997)
the corresponding
broad-band colours for f0 are B-V =0.0 and U-B =-1.1 or a power law index of about
 in the region
3500 Å to 9000 Å, where
is defined as
in the region
3500 Å to 9000 Å, where
is defined as
 (
(
 );
);
 and
and
 we assume a standard interstellar reddening law
(e.g. Cardelli et al. 1989). Furthermore, we
assume that the extinction for both, the direct and the
scattered radiation, is at least
EB-V=0.6 mag as
measured for the narrow line region;
we assume a standard interstellar reddening law
(e.g. Cardelli et al. 1989). Furthermore, we
assume that the extinction for both, the direct and the
scattered radiation, is at least
EB-V=0.6 mag as
measured for the narrow line region;
 .
This appears justified by the fact that
normal (unobscured) Seyfert 1 nuclei show little or no
polarization. Furthermore, the absence of clear evidence
of host galaxy interstellar polarization in the narrow lines
(see Sect. 4.2.2) indicates that
the polarization introduced by dichroic absorption in the
host galaxy is small and can be neglected (the Galactic
dust polarization has already been corrected in
the
-spectrum).
This assumption simplifies Eq. (2), which
now can be written
.
This appears justified by the fact that
normal (unobscured) Seyfert 1 nuclei show little or no
polarization. Furthermore, the absence of clear evidence
of host galaxy interstellar polarization in the narrow lines
(see Sect. 4.2.2) indicates that
the polarization introduced by dichroic absorption in the
host galaxy is small and can be neglected (the Galactic
dust polarization has already been corrected in
the
-spectrum).
This assumption simplifies Eq. (2), which
now can be written
![\begin{figure}
\par\includegraphics[angle=-90,width=7cm,clip]{ms10589f4.ps}
\end{figure}](/articles/aa/full/2001/22/aa10589/img129.gif) |
Figure 4:
Decomposition of the nuclear spectrum
into
direct
and scattered
light (thin, smoothed lines)
and the corresponding
dereddened spectra f0 and
 (dashed, smoothed lines).
The model adopts a polarization of
(dashed, smoothed lines).
The model adopts a polarization of
 for the scattered
radiation, thus
for the scattered
radiation, thus
 .
The (assumed) initial spectrum with a canonical
index
is obtained with
a dereddening of
by
EB-V=0.83. Dereddening of by
EB-V=0.6 as measured for the narrow line
region yields the very bluened spectrum
expected
after optically thin dust scattering. .
The (assumed) initial spectrum with a canonical
index
is obtained with
a dereddening of
by
EB-V=0.83. Dereddening of by
EB-V=0.6 as measured for the narrow line
region yields the very bluened spectrum
expected
after optically thin dust scattering. |
| Open with DEXTER | |
 ). This is a reasonable
approximation for all cases where the scattering albedo is
roughly wavelength independent, which is the case,
e.g., if scatterings occur
predominantly by electrons or predominantly by
astrophysical dust particles (Zubko & Laor 2000).
Of these two possibilities, dust scattering appears by far
more likely since the scattering efficiency per unit mass
is so much greater for dust. The low efficiency of electron
scattering would require an unlikely large amount of mass for the
scattering region. Moreover
as noted already in Sect. 4, the polarized flux
is considerably bluer than the total flux.
Applying a reddening correction of
EB-V=-0.6 mag yields
a spectral index of
). This is a reasonable
approximation for all cases where the scattering albedo is
roughly wavelength independent, which is the case,
e.g., if scatterings occur
predominantly by electrons or predominantly by
astrophysical dust particles (Zubko & Laor 2000).
Of these two possibilities, dust scattering appears by far
more likely since the scattering efficiency per unit mass
is so much greater for dust. The low efficiency of electron
scattering would require an unlikely large amount of mass for the
scattering region. Moreover
as noted already in Sect. 4, the polarized flux
is considerably bluer than the total flux.
Applying a reddening correction of
EB-V=-0.6 mag yields
a spectral index of
 for the polarized flux. This
is significantly steeper than
as expected for the
unobscured nucleus.
We can therefore conclude that scattering is stronger for blue
light than red light. Scattering by an astrophysical mixture
of dust particles in the optical thin regime
has a wavelength dependence of
roughly
for the polarized flux. This
is significantly steeper than
as expected for the
unobscured nucleus.
We can therefore conclude that scattering is stronger for blue
light than red light. Scattering by an astrophysical mixture
of dust particles in the optical thin regime
has a wavelength dependence of
roughly
 in the optical range
(Zubko & Laor 2000). Therefore dust scattering can explain the
blue colour of the polarized spectrum
,
provided the scattering opacity is small
in the optical range
(Zubko & Laor 2000). Therefore dust scattering can explain the
blue colour of the polarized spectrum
,
provided the scattering opacity is small  .
.
![\begin{figure}
\par\includegraphics[width=8.8cm,clip]{ms10589f5.ps}
\end{figure}](/articles/aa/full/2001/22/aa10589/img134.gif) |
Figure 5:
The relative contribution
 at
at
 ,
5600 and 7900 (broken lines) and spectral index ,
5600 and 7900 (broken lines) and spectral index
 of the direct component as a function of the
adopted polarization of the
scattered light .
The observed spectral index for the nuclear spectrum
of the direct component as a function of the
adopted polarization of the
scattered light .
The observed spectral index for the nuclear spectrum
 is indicated at
the lower right.
is indicated at
the lower right. |
| Open with DEXTER | |
 for the most favourable scattering geometry and grain properties
(see e.g. Zubko & Laor 2000).
On the other hand, the observed polarization provides a
lower limit on
of 13%.
for the most favourable scattering geometry and grain properties
(see e.g. Zubko & Laor 2000).
On the other hand, the observed polarization provides a
lower limit on
of 13%.
The spectral index of the direct spectrum
depends
on the adopted amount of scattered light. In any case
is steep (i.e. red) and at least
 .
The spectral index of the total (direct and scattered) light
is
.
The spectral index of the total (direct and scattered) light
is
 and any subtraction of a blue scattering component
makes this index larger. Thus the direct component suffers a
reddening which is larger than
EB-V=0.6 mag as measured
from the narrow line region (adopting
and any subtraction of a blue scattering component
makes this index larger. Thus the direct component suffers a
reddening which is larger than
EB-V=0.6 mag as measured
from the narrow line region (adopting
 ).
For example, if we assume that the scattered light contributes
about 44% to the total nuclear light at 3950, then
the reddening of the direct light is about
EB-V=0.83 mag,
or 0.23 mag larger than the adopted reddening for the scattered
light measured for the NLR (see case
).
For example, if we assume that the scattered light contributes
about 44% to the total nuclear light at 3950, then
the reddening of the direct light is about
EB-V=0.83 mag,
or 0.23 mag larger than the adopted reddening for the scattered
light measured for the NLR (see case
 % in Table 5).
Figure 5 illustrates the dependence
of the spectral index of the direct light and the relative contribution
to the total nuclear light
(for different wavelengths)
on the adopted polarization of the scattered light .
Table 5 gives the corresponding numbers for these
quantities as well as for the resulting reddening of the direct light
and the initial nuclear flux
f05600.
The different models are defined by the relative polarization
for the scattered light ,
which fixes the amount of scattered
light via
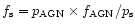 and the direct
spectrum
and the direct
spectrum
 .
The spectral index for the direct spectrum
was determined from the -fluxes at 3950 Å and 7900 Å.
Assuming an unreddened initial core spectrum with spectral index
yields the total reddening (including the extinction
in the Milky Way and in the host galaxy) for the transmitted spectrum
according to
.
The spectral index for the direct spectrum
was determined from the -fluxes at 3950 Å and 7900 Å.
Assuming an unreddened initial core spectrum with spectral index
yields the total reddening (including the extinction
in the Milky Way and in the host galaxy) for the transmitted spectrum
according to
 (using
a standard interstellar extinction law).
The initial flux at 5600 emitted by the AGN along the
line of sight
f05600 follows then from the extinction and .
This value includes an aperture correction accounting for the
light losses on the narrow slit used in our observations (see Sect. 3.1).
(using
a standard interstellar extinction law).
The initial flux at 5600 emitted by the AGN along the
line of sight
f05600 follows then from the extinction and .
This value includes an aperture correction accounting for the
light losses on the narrow slit used in our observations (see Sect. 3.1).
|
|
|
EB-V | f05600 | ||
![$[\%]$](/articles/aa/full/2001/22/aa10589/img144.gif) |
3950 | 5600 | 7900 | mag | 10-15 | |
| 40 | 0.73 | 0.83 | 0.89 | 2.01 | 0.76 | 19.0* |
| 30 | 0.64 | 0.77 | 0.85 | 2.14 | 0.79 | 19.6* |
| 25 | 0.56 | 0.73 | 0.82 | 2.26 | 0.83 | 20.3* |
| 20 | 0.46 | 0.66 | 0.79 | 2.49 | 0.89 | 22.0* |
| 15 | 0.28 | 0.54 | 0.71 | 3.06 | 1.05 | 28.9* |
| 12.5 | 0.13 | 0.46 | 0.65 | 3.99 | 1.31 | 50.6* |
|
|
2.90* | 2.63* | 2.40* | |||
|
|
10.8% | 6.8% | 4.4% | |||
.
The parameters for this case differ only slightly when
compared to
 or
or  .
Adopting a lower -value
seems to be unlikely, because this would imply that the direct spectrum
shows a unrealistically high reddening so that the observed
flux in the blue spectral region would be almost only due
to scattered light.
.
Adopting a lower -value
seems to be unlikely, because this would imply that the direct spectrum
shows a unrealistically high reddening so that the observed
flux in the blue spectral region would be almost only due
to scattered light.
In the
model the initial flux of the core at 5600 is
 ,
from which only about a tenth is
directly transmitted through the dust in the host galaxy and the
Milky Way (
EB-V=0.83).
Correcting the scattered spectrum for interstellar
reddening
EB-V=0.60 yields a ratio of
,
from which only about a tenth is
directly transmitted through the dust in the host galaxy and the
Milky Way (
EB-V=0.83).
Correcting the scattered spectrum for interstellar
reddening
EB-V=0.60 yields a ratio of
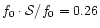 between scattered light and
initial light. This ratio depends for given wavelengths only
little on the adopted model parameters. For
between scattered light and
initial light. This ratio depends for given wavelengths only
little on the adopted model parameters. For
 %, 20%
or 15% and at
%, 20%
or 15% and at
 the ratio
 is 0.22, 0.30 or 0.30, respectively. As the single scattering
albedo for optically thin dust scatterings is between 50 and 60%,
about half (or more) of the initial light from the AGN is
scattered by dust in F51. For this rough estimate we
assumed that the initial light f0 and the scattered light
is emitted isotropically.
is 0.22, 0.30 or 0.30, respectively. As the single scattering
albedo for optically thin dust scatterings is between 50 and 60%,
about half (or more) of the initial light from the AGN is
scattered by dust in F51. For this rough estimate we
assumed that the initial light f0 and the scattered light
is emitted isotropically.
From the high scattering polarization of
 we can
further infer that the typical scattering angle must be in the range
we can
further infer that the typical scattering angle must be in the range
 .
Lower or larger angles corresponding to
forward or backward scattering situations respectively are not
producing relative scattering polarizations
in excess of
.
Lower or larger angles corresponding to
forward or backward scattering situations respectively are not
producing relative scattering polarizations
in excess of
 (e.g. Zubko & Laor 2000).
The high
indicates also that the polarization is not
strongly lowered by geometric canceling of the scattering polarization.
This means that the scattering
occur in a well defined sector having a half opening angle of not more
than about .
(e.g. Zubko & Laor 2000).
The high
indicates also that the polarization is not
strongly lowered by geometric canceling of the scattering polarization.
This means that the scattering
occur in a well defined sector having a half opening angle of not more
than about .
A significant difference of the polarization observed in some of the
objects quoted above is the behaviour of the polarized line flux.
In contrast to our results for F51, complex polarization
structures through the
H
and H
line profiles have been found in the
high-p Seyfert 1 galaxies Mrk 231, Mrk 486 and
Mrk 704
(Goodrich & Miller 1994;
Smith et al. 1995, 1997). This may indicate
that in these objects at least some polarization originates from scattering
within or close to the BLR, or that large scale gas motions are present.
As pointed out above, for F51 we found the broad line profiles
of H
and H
practically indistinguishable in total and
polarized flux, including subtle line asymmetries.
An additional but very small polarization component
in the H
line wings can be recognized in our high quality
data (Fig. 1) as a small position angle rotation over the
H
profile. Such weak polarization features in the H
line wings are often present in high quality data of Seyfert 1 and broad
line radio galaxies (Goodrich & Miller 1994;
Corbett et al. 1998; Martel 1998;
Young et al. 1999; Schmid et al. 2000).
They are probably caused by electron scattering within or close
to the BLR. In F51 this line wing component is
about 20 times smaller than the overall polarization level,
and the position angle of the line wing components is polarimetrically
orthogonal (i.e.
 )
to the main
polarization component. It is beyond the scope of this paper
to investigate the nature of the small line wing polarization,
which seems to be generic for AGN. Therefore we plotted in
Fig. 2 only polarized flux and percentage polarization
representing the main polarization component free from the
very small "orthogonal'' line wing component.
)
to the main
polarization component. It is beyond the scope of this paper
to investigate the nature of the small line wing polarization,
which seems to be generic for AGN. Therefore we plotted in
Fig. 2 only polarized flux and percentage polarization
representing the main polarization component free from the
very small "orthogonal'' line wing component.
An important result for F51 is that the polarization spectrum of the nucleus and the BLR are (apart from the bluening) exact copies of the intensity spectrum. This seems to indicate that F51 differs from other AGN by the fact that for F51 we see exactly the same velocity structure of the line emitting medium along the direct line of sight to the core as well as along the direction to the scattering medium.
As pointed out above, F51 combines some properties of a
Seyfert 1 nucleus (BLR lines, power law continuum) with some
typical Seyfert 2 properties (high polarization, strong reddening of the
core). In the framework of the standard unified AGN model such a
behaviour is explained most easily by assuming that the line of sight
of the direct light passes very close to the inner boundary (or through
the outer atmosphere) of a circumnuclear dust torus. Such dust tori
are well know to exist in AGN and the mid-IR flux of F51
listed in the IRAS catalog strongly supports the presence of such a torus
in F51. Assuming typical torus models
(see e.g. Pier & Krolik 1993;
Granato & Danese 1994; Efstathiou & Rowan-Robinson
1995) the above assumption
would mean an inclination angle of the direct beam of the order
.
At a first glance it is tempting to assume that the
observed polarized flux is nuclear light backscattered from the
illuminated (and unobscured) opposite inner wall of the torus. Since for this
light the scattering angle is near  ,
a high polarization is
to be expected. The assumption would also provide a
natural explanation for the identical BLR profiles observed in the
direct and scattered light, since the aspect angle of the initial
beam (before scattering) would be again about ,
as in the case of the direct beam. However, this assumption has the
following serious problem: from the above analysis we had to conclude
that the ratio between scattered
and direct light
f0 (before reddening losses) has to be of the order
,
a high polarization is
to be expected. The assumption would also provide a
natural explanation for the identical BLR profiles observed in the
direct and scattered light, since the aspect angle of the initial
beam (before scattering) would be again about ,
as in the case of the direct beam. However, this assumption has the
following serious problem: from the above analysis we had to conclude
that the ratio between scattered
and direct light
f0 (before reddening losses) has to be of the order
 .
A much smaller value would be incompatible with the observed high
polarization of the total light and the moderate intrinsic reddening
of the direct light, except if the extinction by the torus dust
would follow a very unusual, essentially color independent,
dust extinction law, which we regard as unlikely. With reasonable
scattering efficiencies such a high percentage of scattered
light can be achieved only
if about 50% of the flux radiated from the core into a
.
A much smaller value would be incompatible with the observed high
polarization of the total light and the moderate intrinsic reddening
of the direct light, except if the extinction by the torus dust
would follow a very unusual, essentially color independent,
dust extinction law, which we regard as unlikely. With reasonable
scattering efficiencies such a high percentage of scattered
light can be achieved only
if about 50% of the flux radiated from the core into a  solid angle
is intersected by scattering dust. On the other hand, with plausible
torus geometries and the assumed inclination angle for the direct
beam at most a few per cent of the light of the core will be scattered
in the visible part of the torus inner wall. Another problem with
scattering from this region of the torus would be the optical
thickness of the scattering layer which would decrease the scattering
efficiency and the bluening effect.
solid angle
is intersected by scattering dust. On the other hand, with plausible
torus geometries and the assumed inclination angle for the direct
beam at most a few per cent of the light of the core will be scattered
in the visible part of the torus inner wall. Another problem with
scattering from this region of the torus would be the optical
thickness of the scattering layer which would decrease the scattering
efficiency and the bluening effect.
![\begin{figure}
\par\includegraphics[width=8.8cm,clip]{ms10589f6.ps}
\end{figure}](/articles/aa/full/2001/22/aa10589/img159.gif) |
Figure 6: Schematic scattering geometry suggested for F51. The black dot in the middle of the BLR clouds is the continuum source. |
| Open with DEXTER | |
Therefore, on the basis of the inferred relatively large fraction of the
scattered radiation, we conclude that the scattering must be produced
by dust distributed over the whole volume inside or above the
torus, with a sufficient total cross section in order to cover
a large fraction of the
solid angle. The suggested
scattering geometry is illustrated schematically in Fig. 6.
The dust in the main scattering region could be contained
either in an outflowing plasma which is
evaporating from the torus walls, or it could be host galaxy dust
located above (and below) the torus. As pointed out, e.g., by Wolf & Henning
(1999) such dust configurations can produce polarized
light very efficiently.
If the dust is distributed over the whole space above the torus
the aspect angle of the core (i.e. of the continuum source and
BLR) as seen from the dust scattering clouds will be different than in the
case of light scattered off the torus wall, and it will also
be different from the
aspect angle of the direct light. On average the scattered light will now
originate from the source in a direction approximately
perpendicular to the accretion disk plane, i.e. at an angle of  relative to the direct beam (e.g. Fig. 6).
Therefore, we should see in general a different radial
velocity field and thus different BLR line profiles for the direct and the
scattered radiation. Identical lines profiles are only expected
for cases with an isotropic velocity field of the BLR emitting matter
(or certain very special and unrealistic velocity distributions).
relative to the direct beam (e.g. Fig. 6).
Therefore, we should see in general a different radial
velocity field and thus different BLR line profiles for the direct and the
scattered radiation. Identical lines profiles are only expected
for cases with an isotropic velocity field of the BLR emitting matter
(or certain very special and unrealistic velocity distributions).
Since the observed line profiles were found to be indistinguishable, it appears difficult to avoid the conclusion that the BLR velocity field of F51 is essentially spherically symmetric. This seems to exclude (for this AGN) models where the broad lines are produced in a disk-like configuration of BLR clouds. On the other hand the observations would be compatible with BLR models assuming the lines being formed in the bloated atmospheres or winds of a dense star cluster ionized by the central continuum source.
Type 1 AGN with a scattering geometry like F51 are rare. Unlike in F51, in most AGN an important fraction of scattering polarization seems to orignate from scattering regions located close to or within the BLR. Therefore, the profiles of the scattered broad lines are distorted and depend strongly on the exact location and dynamics of the scattering region. For the investigation of aspect-dependent properties of the BLR, it is therefore important to study type 1 systems like F51 with a rather well defined scattering region located far away from the BLR. This offers the unique opportunity to investigate the BLR velocity field from different aspect angles as described in this work. Therefore, it would be of great interest to see if the evidence for a spherically symmetric BLR velocity field found in F51 is restricted to this object or if similar evidence can be found for other AGN.
Acknowledgements
It is a pleasure to thank Andreas Kaufer and Chris Lidman for their helpful support at the telescope. An anonymous referee made several very competent remarks and constructive suggestions which improved the paper. This research has been supported by the Sonderforschungsbereich SFB 439.
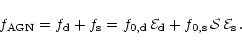
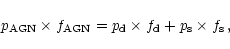
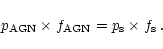
 .
.