Applying the mean surface density of companions,
A&A 372, 105-116 (2001)
DOI: 10.1051/0004-6361:20010477
R. S. Klessen1,2,3 - P. Kroupa4
1 - UCO/Lick Observatory, University of California, 499 Kerr Hall,
Santa Cruz, CA 95064, USA
2 - Otto Hahn Fellow,
Max-Planck-Institut für Astronomie, Königstuhl 17, 69917
Heidelberg, Germany
3 - Sterrewacht Leiden, Postbus 9513, 2300-RA Leiden,
The Netherlands
4 -
Institut für Theoretische Physik und Astrophysik, Universität
Kiel, 24098 Kiel, Germany
Received 11 July 2000 / Accepted 26 March 2001
Abstract
Applying the mean surface density of companions, ![]() ,
to the
dynamical evolution of star clusters is an interesting approach to
quantifying structural changes in a cluster. It has the advantage
that the entire density structure, ranging from the closest binary
separations, over the core-halo structure through to the density
distribution in moving groups that originate from clusters, can be
analysed coherently as one function of the stellar separation r. This contribution assesses the evolution of
,
to the
dynamical evolution of star clusters is an interesting approach to
quantifying structural changes in a cluster. It has the advantage
that the entire density structure, ranging from the closest binary
separations, over the core-halo structure through to the density
distribution in moving groups that originate from clusters, can be
analysed coherently as one function of the stellar separation r. This contribution assesses the evolution of ![]() for clusters
with different initial densities and binary populations. The changes
in the binary, cluster and halo branches as the clusters evolve are
documented using direct N-body calculations, and are correlated with
the cluster core and half-mass radius. The location of breaks in the
slope of
for clusters
with different initial densities and binary populations. The changes
in the binary, cluster and halo branches as the clusters evolve are
documented using direct N-body calculations, and are correlated with
the cluster core and half-mass radius. The location of breaks in the
slope of ![]() and the possible occurrence of a binary gap can
be used to infer dynamical cluster properties.
and the possible occurrence of a binary gap can
be used to infer dynamical cluster properties.
Key words: stars: binaries: general - open clusters and associations: general - stars: formation - stellar dynamics
These results prompted the reanalysis of the Taurus-Auriga data by
other authors (Simon 1997; Bate et al. 1998; Gladwin
et al. 1999), as well as the subsequent investigation of additional
star-forming regions. Mean surface densities of companions as a
function of angular separation have been derived for Orion (Simon
1997; Bate et al. 1998; Nakajima et al. 1998), for the
![]() -Ophiuchus cloud (Simon 1997; Bate et al. 1998; Nakajima et al. 1998; Gladwin et al. 1999), and for the star-forming regions in
Chamaeleon, Vela and Lupus (Nakajima et al. 1998). Common to all
studies is that the companion surface density is best described as a
double power-law, with slopes of
-Ophiuchus cloud (Simon 1997; Bate et al. 1998; Nakajima et al. 1998; Gladwin et al. 1999), and for the star-forming regions in
Chamaeleon, Vela and Lupus (Nakajima et al. 1998). Common to all
studies is that the companion surface density is best described as a
double power-law, with slopes of ![]() -2 in the binary branch and
slopes between -0.9 and -0.1 in the large-scale clustering
regime. However, the length scales where the break of the distribution
is found to vary considerably, from
-2 in the binary branch and
slopes between -0.9 and -0.1 in the large-scale clustering
regime. However, the length scales where the break of the distribution
is found to vary considerably, from ![]()
![]() AU in the Trapezium
cluster in Orion, over
AU in the Trapezium
cluster in Orion, over ![]()
![]() AU in Ophiuchus and
AU in Ophiuchus and
![]()
![]() AU in Taurus, to
AU in Taurus, to ![]() AU for the Orion OB
region. This fact raises considerable doubts about the interpretation
of the break location as being determined by the Jeans condition in
the cloud. This would imply quite different Jeans masses which in turn
should lead to deviations of the initial mass function, which have not
been observed.
AU for the Orion OB
region. This fact raises considerable doubts about the interpretation
of the break location as being determined by the Jeans condition in
the cloud. This would imply quite different Jeans masses which in turn
should lead to deviations of the initial mass function, which have not
been observed.
A thorough theoretical evaluation of the mean surface density of
companions,
![]() ,
and a discussion of viable
interpretations can be found in Bate et al. (1998). Altogether the
following picture emerges: at small separations,
,
and a discussion of viable
interpretations can be found in Bate et al. (1998). Altogether the
following picture emerges: at small separations,
![]() traces the separations of binary stars and higher-order multiple
stellar systems. The slope
traces the separations of binary stars and higher-order multiple
stellar systems. The slope ![]() -2 results from the frequency
distribution of binary separations being roughly uniform in logarithm
(Duquennoy & Mayor 1991, for main sequence stars). The break occurs
at the "crowding'' limit, i.e. at separations where wide binaries
blend into the "background'' density of the cluster. At larger
separations,
-2 results from the frequency
distribution of binary separations being roughly uniform in logarithm
(Duquennoy & Mayor 1991, for main sequence stars). The break occurs
at the "crowding'' limit, i.e. at separations where wide binaries
blend into the "background'' density of the cluster. At larger
separations,
![]() simply reflects the large-scale spatial
structure of the stellar cluster. Bate et al. (1998) pointed out that
simply reflects the large-scale spatial
structure of the stellar cluster. Bate et al. (1998) pointed out that
![]() can be strongly affected by boundary effects and that
a non-integer power-law slope in the cluster branch does not
necessarily imply fractal structure. They showed that a simple
core-halo structure, as is typical for evolved stellar clusters, will
result in a non-integer slope for separations larger than the core
radius. They also speculated about possible effects of dynamical
cluster evolution on the properties of
can be strongly affected by boundary effects and that
a non-integer power-law slope in the cluster branch does not
necessarily imply fractal structure. They showed that a simple
core-halo structure, as is typical for evolved stellar clusters, will
result in a non-integer slope for separations larger than the core
radius. They also speculated about possible effects of dynamical
cluster evolution on the properties of
![]() .
.
It is the aim of the present paper to investigate, for the first time,
evolutionary effects on
![]() as derived from realistic
N-body computations. We use models studied by Kroupa (1995a,b,c,
1998, hereinafter K1-K4) for a comparison with a "standard'' dynamical
analysis, where the binary population is analysed separately from the
bulk cluster properties. For comparison, the mean surface density of
companions for models of protostellar clusters that form and
evolve through turbulent molecular cloud fragmentation is discussed
in Klessen & Burkert (2000, 2001).
as derived from realistic
N-body computations. We use models studied by Kroupa (1995a,b,c,
1998, hereinafter K1-K4) for a comparison with a "standard'' dynamical
analysis, where the binary population is analysed separately from the
bulk cluster properties. For comparison, the mean surface density of
companions for models of protostellar clusters that form and
evolve through turbulent molecular cloud fragmentation is discussed
in Klessen & Burkert (2000, 2001).
The structure of the paper is as follows. In the next section
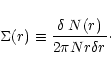
(Sect. 2) we mathematically define the mean surface density
of companions, ![]() ,
and briefly discuss its limitations. In
Sect. 3 we describe the star cluster models and their
properties. In Sect. 4, we investigate the
influence of cluster evolution on
,
and briefly discuss its limitations. In
Sect. 3 we describe the star cluster models and their
properties. In Sect. 4, we investigate the
influence of cluster evolution on ![]() and in particular
discuss wide-binary depletion. The effects of averaging and projection
are analysed in Sect. 5, and a possible
observational bias is discussed in Sect. 6.
Section 7 discusses features in
and in particular
discuss wide-binary depletion. The effects of averaging and projection
are analysed in Sect. 5, and a possible
observational bias is discussed in Sect. 6.
Section 7 discusses features in
![]() and
their relation to cluster morphology. Finally, our results are
summarised in Sect. 8.
and
their relation to cluster morphology. Finally, our results are
summarised in Sect. 8.
| Model |
Model |
Model |
Model |
Model |
Model |
||
| n | 5 | 5 | 5 | 5 | 3 | 3 | |
| f | 1 | 1 | 1 | 1 | 0 | 0 | |
| (pc) | 0.08 | 0.25 | 0.8 | 2.5 | 0.08 | 0.25 | |
|
|
( |
0.094 | 0.54 | 3.0 | 17 | 0.094 | 0.54 |
| log
|
(stars/pc3) | 5.6 | 4.1 | 2.7 | 1.1 | 5.6 | 4.1 |
| log
|
(stars/pc2) | 4.3 | 3.3 | 2.3 | 1.2 | 4.3 | 3.3 |
|
|
( |
0.0 | 0.0 | 0.0 | 0.0 | 0.0 | 0.0 |
|
|
( |
1.19 | 6.67 | 37.5 | 211 | 1.19 | 6.68 |
|
|
( |
11.9 | 66.7 | -- | -- | 11.9 | 66.8 |
|
|
( |
297 | 300 | 300 | 296 | 297 | 300 |
 |
(1) |
Stellar surveys have finite area and boundary effects may occur. For
stars closer than a distance ![]() to the boundary all annuli with
to the boundary all annuli with
![]() extend beyond the limits of the survey and companion stars may
be missed. This has little effect when considering small separations
r as only a small fraction of all stars is affected, however, when
r becomes close to the survey size the missing companions result in
a steep decline of
extend beyond the limits of the survey and companion stars may
be missed. This has little effect when considering small separations
r as only a small fraction of all stars is affected, however, when
r becomes close to the survey size the missing companions result in
a steep decline of ![]() .
Several methods have been proposed to
correct for that effect (Bate et al. 1998, and references therein),
where either the accepted range of r is reduced to separations much
smaller than the survey size, or additional assumptions about the
background density of stars are made. Neither approach is completely
satisfactory.
.
Several methods have been proposed to
correct for that effect (Bate et al. 1998, and references therein),
where either the accepted range of r is reduced to separations much
smaller than the survey size, or additional assumptions about the
background density of stars are made. Neither approach is completely
satisfactory.
In the present study we do not attempt to adopt any of the correction methods for the following reasons. First, in the numerical simulations all information about the system is accessible. There are no observational constraints and we always consider all stars in the cluster. The survey area can be arbitrary large and is chosen such that it includes the complete cluster. Second, although the considered clusters are subject to the tidal field of the Galaxy we do not include Galactic-field stars in consideration. Hence, there is no confusion limit, where contamination with foreground or background stars becomes important.
A range of star-cluster models are constructed, and their dynamical evolution is calculated using NBODY5 (Aarseth 1999), which includes a standard Galactic tidal field (Terlevich 1987). The cluster models have been discussed extensively in K1-K4, so that only a short outline is provided here.
The stellar systems initially follow a Plummer density distribution
(Aarseth et al. 1974) with half-mass radius ![]() ,
and
the average stellar mass is independent of the radial distance, r,
from the cluster centre.
,
and
the average stellar mass is independent of the radial distance, r,
from the cluster centre.
Stellar masses are distributed according to the solar-neighbourhood
IMF (Kroupa et al. 1993) with
![]() .
Larger masses are omitted so as to avoid
complications arising from stellar evolution. Binaries are created by
pairing the stars randomly, giving a birth binary proportion
.
Larger masses are omitted so as to avoid
complications arising from stellar evolution. Binaries are created by
pairing the stars randomly, giving a birth binary proportion
![]() ,
where
,
where
![]() and
and
![]() are the number of single-star and binary systems,
respectively. The initial mean system mass is
are the number of single-star and binary systems,
respectively. The initial mean system mass is
![]() ,
with
,
with
![]() being the average stellar
mass. This results in an approximately flat mass-ratio distribution
at birth (Fig. 12 in K2). Periods and eccentricities are
distributed following K1. The initial periods range from 103 to
107.5 days, and the eccentricity distribution is thermal, i.e. the relative number of binaries increases linearly with eccentricity
being consistent with observational constraints.
being the average stellar
mass. This results in an approximately flat mass-ratio distribution
at birth (Fig. 12 in K2). Periods and eccentricities are
distributed following K1. The initial periods range from 103 to
107.5 days, and the eccentricity distribution is thermal, i.e. the relative number of binaries increases linearly with eccentricity
being consistent with observational constraints.
The parameters are listed in Table 1. Four clusters
with f=1 are constructed spanning a wide range of central densities,
from log
![]() to 5.6 [stars/pc3]. Each model contains
N=400 stars and has a mass
to 5.6 [stars/pc3]. Each model contains
N=400 stars and has a mass
![]() .
The initial
tidal radius in all cases is
.
The initial
tidal radius in all cases is
![]() pc. All stars are
kept in the calculation to facilitate binary-star analysis, but those
with
pc. All stars are
kept in the calculation to facilitate binary-star analysis, but those
with
![]() experience unphysical accelerations in the
linearised local tidal field and rotating coordinate system (Terlevich
1987), so that the density distribution of stellar systems at large
radii does not reflect the true distribution in the moving group.
Five different renditions are calculated for each model to increase
the statistical significance of our results. In addition, two clusters
with f=0 are constructed for comparison with the binary-rich cases.
The evolution of these models is calculated for three cluster
realisations each. The computations cover
experience unphysical accelerations in the
linearised local tidal field and rotating coordinate system (Terlevich
1987), so that the density distribution of stellar systems at large
radii does not reflect the true distribution in the moving group.
Five different renditions are calculated for each model to increase
the statistical significance of our results. In addition, two clusters
with f=0 are constructed for comparison with the binary-rich cases.
The evolution of these models is calculated for three cluster
realisations each. The computations cover
![]() years, but we
consider only a sub-set of all possible snap-shots in the current
analysis.
years, but we
consider only a sub-set of all possible snap-shots in the current
analysis.
![\begin{figure}
\par\includegraphics[width=15.8cm,clip]{MS10093-figure01.ps}
\end{figure}](/articles/aa/full/2001/22/aa10093/img68.gif) |
Figure 1:
The mean surface
density of companions, |
| Open with DEXTER | |
In this section, we discuss the influence of the dynamical cluster
evolution on the resulting mean surface density of companions
![]() .
For each star cluster,
.
For each star cluster, ![]() is calculated as an
average over the set of n individual model realisations, and we restrict
ourselves to discussing the projection into the xy-plane. The
influence of averaging and projection is discussed in
Sect. 5.
is calculated as an
average over the set of n individual model realisations, and we restrict
ourselves to discussing the projection into the xy-plane. The
influence of averaging and projection is discussed in
Sect. 5.
![\begin{figure}
\par\includegraphics[width=15.8cm,clip]{MS10093-figure02.ps}
\end{figure}](/articles/aa/full/2001/22/aa10093/img71.gif) |
Figure 2:
The mean surface
density of companions, |
| Open with DEXTER | |
At any time and for all models, the mean surface density of companions
exhibits, at low separations r, a well defined power-law behaviour
![]() .
It implies an approximate uniform
distribution of binary separations in
.
It implies an approximate uniform
distribution of binary separations in ![]() (Bate et al. 1998).
For larger r, the binary branch blends into the plateau of constant
companion density corresponding to the core of the star cluster. This
first break of the distribution occurs at separations r1where the number of chance projections of cluster members becomes
equal to the number of binaries in that separation bin. At larger rchance projections completely dominate
(Bate et al. 1998).
For larger r, the binary branch blends into the plateau of constant
companion density corresponding to the core of the star cluster. This
first break of the distribution occurs at separations r1where the number of chance projections of cluster members becomes
equal to the number of binaries in that separation bin. At larger rchance projections completely dominate ![]() ,
and wide binaries,
if in fact present, can no longer be identified as such. The location
of the first break therefore depends on the binary fraction and on the
central density of the cluster. On larger scales the stellar clusters
follow a Plummer radial density profile with half-mass radius
,
and wide binaries,
if in fact present, can no longer be identified as such. The location
of the first break therefore depends on the binary fraction and on the
central density of the cluster. On larger scales the stellar clusters
follow a Plummer radial density profile with half-mass radius ![]() .
Therefore, a second break occurs at r2 and
.
Therefore, a second break occurs at r2 and ![]() declines sharply for separations
declines sharply for separations
![]() (see
Sect. 7).
(see
Sect. 7).
As the dynamical evolution progresses, the clusters expand and the
density declines. Hence, the projected mean surface density of
companions decreases as well. While many of the binaries with
separations comparable to the mean distance of stellar systems in the
cluster core become disrupted, some new binaries may form by capture.
Usually these are higher-order multiples (K2) with separations close
to the first break or smaller. As the cluster expands, the binary
branch becomes less affected by crowding and the first break in
![]() shifts to greater separations. This behaviour is clearly
visible in Fig. 1. For all models the core plateau in
shifts to greater separations. This behaviour is clearly
visible in Fig. 1. For all models the core plateau in
![]() "decreases in height'' and "moves'' to larger separations as
time progresses. At late stages of the evolution the entire binary
branch is uncovered and a few long-period orbits appear through
capture. This is also documented in Figs. 3 and 4 in K4.
"decreases in height'' and "moves'' to larger separations as
time progresses. At late stages of the evolution the entire binary
branch is uncovered and a few long-period orbits appear through
capture. This is also documented in Figs. 3 and 4 in K4.
The clusters develop core-halo structures through energy
equipartition. Low-mass stars gain kinetic energy through encounters
with more massive stars. The low-mass stars move away from the cluster
centre, forming the halo, whereas the more massive stars sink towards
the centre. The trajectories of halo stars that trespass beyond
the tidal radius of the cluster are dominated by the Galactic tidal
field, and most become unbound. Hence, the clusters expand until they fill
their tidal radii. When this stage is reached (roughly after
![]() years), the different clusters evolve identically
(see also Fig. 1 in K3), mostly loosing stars through their first and
second Lagrange points (Terlevich 1987; Portegies Zwart et al. 2001).
As a result,
years), the different clusters evolve identically
(see also Fig. 1 in K3), mostly loosing stars through their first and
second Lagrange points (Terlevich 1987; Portegies Zwart et al. 2001).
As a result, ![]() extends beyond the second break to
increasingly larger separations with an increasingly shallower slope,
which we identify as the halo branch in
extends beyond the second break to
increasingly larger separations with an increasingly shallower slope,
which we identify as the halo branch in ![]() .
Near the tidal
radius
.
Near the tidal
radius ![]() ,
a third break occurs, as stars with
,
a third break occurs, as stars with
![]() become unbound. The trajectories of stars belonging to these
unbound moving groups are not followed with sufficient resolution (see
Sect. 3). Also, these stars are likely to be
severely contaminated by field stars in the Galaxy, and we refrain
from a further discussion of this outermost branch in
become unbound. The trajectories of stars belonging to these
unbound moving groups are not followed with sufficient resolution (see
Sect. 3). Also, these stars are likely to be
severely contaminated by field stars in the Galaxy, and we refrain
from a further discussion of this outermost branch in ![]() .
.
As can be seen from Fig. 1, knowledge of the initial
global properties of the system is effectively erased through the
dynamical evolution. The cluster and halo branches in ![]() look quite indistinguishable in the final frames. The situation
changes, however, when considering the binary branch, as discussed in
Sect. 4.2. The f=1 versus f=0experiments demonstrate that there is no significant difference in
bulk cluster evolution between clusters containing a large primordial
binary proportion and no binaries (K3). This is also evident by
studying
look quite indistinguishable in the final frames. The situation
changes, however, when considering the binary branch, as discussed in
Sect. 4.2. The f=1 versus f=0experiments demonstrate that there is no significant difference in
bulk cluster evolution between clusters containing a large primordial
binary proportion and no binaries (K3). This is also evident by
studying ![]() ;
concentrating only on the cluster and halo
branches, the upper two final panels in Figs. 1 and 2 are indistinguishable.
;
concentrating only on the cluster and halo
branches, the upper two final panels in Figs. 1 and 2 are indistinguishable.
![\begin{figure}
\par\includegraphics[width=15.8cm,clip]{MS10093-figure03.ps}
\end{figure}](/articles/aa/full/2001/22/aa10093/img78.gif) |
Figure 3:
The function
|
| Open with DEXTER | |
However, as the clusters evolve, binaries are not only created but
also destroyed. Due to their smaller binding energies, wide binaries
are more vulnerable to dynamical processes than close ones. If the
initial binary fraction is high, then the destruction processes
dominate over binary formation, and cluster evolution leads to a
depletion of wide binaries. As a result, ![]() steepens on the
large-separation side of the binary branch. In extreme cases, some
annuli r of
steepens on the
large-separation side of the binary branch. In extreme cases, some
annuli r of ![]() may become completely depopulated, and
consequently a gap between the binary and the cluster branches opens
up, as is noticeable in Fig. 1.
may become completely depopulated, and
consequently a gap between the binary and the cluster branches opens
up, as is noticeable in Fig. 1.
The efficiency of binary disruption depends strongly on the initial
density of the cluster. For high stellar densities, the typical
impact parameters of stellar encounters are small. Hence, there is a
relatively high frequency of encounters for which the energy exchange
exceeds the binding energy of typical binary systems, which
subsequently dissolve. In our suite of models, the effect of binary
depletion is largest in ![]() ,
which has the highest central density
,
which has the highest central density
![]() ,
and decreases with increasing half-mass radius
,
and decreases with increasing half-mass radius ![]() as
as
![]() becomes smaller.
becomes smaller.
This is demonstrated in Fig. 3. Unlike the previous
figures it shows a reduced range of separations, concentrating on the
binary branch, and it plots
![]() to make it easier to
determine the power-law slope and deviations from it. At t=0.0, for
all models
to make it easier to
determine the power-law slope and deviations from it. At t=0.0, for
all models
![]() is constant in the binary branch. This
reflects the initial distribution of the binary separations, which is
uniform in the logarithm within the range
is constant in the binary branch. This
reflects the initial distribution of the binary separations, which is
uniform in the logarithm within the range ![]() pc to
pc to
![]() pc. Values
pc. Values
![]() pc come from the projection of the
3-dimensional distribution into the xy-plane. For model
pc come from the projection of the
3-dimensional distribution into the xy-plane. For model ![]() the complete binary branch is visible and fully segregated from the
cluster branch (which corresponds to the rising part of the
plot). This is because the half-mass radius of the cluster is large
enough that the projected mean separation between cluster members
exceeds the separation of the widest binary system. As both branches
are clearly separated initially, dynamical evolution does not alter
the binary distribution significantly. There is little sign of wide
binary depletion, even at
the complete binary branch is visible and fully segregated from the
cluster branch (which corresponds to the rising part of the
plot). This is because the half-mass radius of the cluster is large
enough that the projected mean separation between cluster members
exceeds the separation of the widest binary system. As both branches
are clearly separated initially, dynamical evolution does not alter
the binary distribution significantly. There is little sign of wide
binary depletion, even at
![]() .
.
![\begin{figure}
\par\includegraphics[width=12.2cm,clip]{MS10093-figure04.ps}
\end{figure}](/articles/aa/full/2001/22/aa10093/img83.gif) |
Figure 4:
Mean surface
density of companions, |
| Open with DEXTER | |
In the other models, the typical separations in the cluster core are
smaller than ![]() pc, and binary and cluster branches overlap in
the beginning. This is most significant for model
pc, and binary and cluster branches overlap in
the beginning. This is most significant for model ![]() ,
where the
initial central density is highest. Consequently a large number of
wide binaries are disrupted during the dynamical evolution of the
system, and
,
where the
initial central density is highest. Consequently a large number of
wide binaries are disrupted during the dynamical evolution of the
system, and
![]() drops considerably below its initial
value (indicated by the dashed line) in the range
drops considerably below its initial
value (indicated by the dashed line) in the range
![]() pc
pc
![]() pc. Because the size of this gap
depends on the age and the initial central concentration of the
cluster, analysing the signatures in
pc. Because the size of this gap
depends on the age and the initial central concentration of the
cluster, analysing the signatures in ![]() could be used to
constrain the initial state of observed stellar clusters. This fact,
namely that the binary population retains a memory of its past
dynamical environment, is also used in K1 to infer the typical
structures in which most Galactic-field stars form, by studying the
shape of the binary period distribution ("inverse dynamical
population synthesis'').
could be used to
constrain the initial state of observed stellar clusters. This fact,
namely that the binary population retains a memory of its past
dynamical environment, is also used in K1 to infer the typical
structures in which most Galactic-field stars form, by studying the
shape of the binary period distribution ("inverse dynamical
population synthesis'').
![\begin{figure}
\par\includegraphics[width=13.5cm,clip]{MS10093-figure05.ps}
\end{figure}](/articles/aa/full/2001/22/aa10093/img85.gif) |
Figure 5:
Illustration of
the effect of projection. Mean surface density of companions
|
| Open with DEXTER | |
The invariance to changes in projection is demonstrated in Fig. 5, which shows cluster ![]() again at
again at
![]() .
The function
.
The function ![]() is essentially independent
of the projection, and slight differences occur only where there
are smaller numbers of stars. Analogue to the variations between
different model realisations discussed above, this is the case at very
large and very small r, and at separations where wide-binary
depletion occurs. At large separations, the tidal field breaks the
symmetry. For small r and at the binary gap, it depends on the
projection which separation bin stays populated and which may become
empty. However, besides these details the overall structure of
is essentially independent
of the projection, and slight differences occur only where there
are smaller numbers of stars. Analogue to the variations between
different model realisations discussed above, this is the case at very
large and very small r, and at separations where wide-binary
depletion occurs. At large separations, the tidal field breaks the
symmetry. For small r and at the binary gap, it depends on the
projection which separation bin stays populated and which may become
empty. However, besides these details the overall structure of
![]() is projection invariant.
is projection invariant.
![\begin{figure}
\par\includegraphics[width=15.8cm,clip]{MS10093-figure06.ps}
\end{figure}](/articles/aa/full/2001/22/aa10093/img94.gif) |
Figure 6:
Mean surface density of
companions, |
| Open with DEXTER | |
With increasing
![]() ,
the total number of detected stars
decreases, and as a result
,
the total number of detected stars
decreases, and as a result ![]() is reduced. Also the shape of
is reduced. Also the shape of
![]() changes. This effect is small for low detection thresholds
(
changes. This effect is small for low detection thresholds
(
![]() ), as the overall star distribution in the
cluster is still well sampled. However, it becomes significant at
large cluster distances when only the brightest stars can be
detected. The binary branch becomes severely under-sampled, and wide
gaps open up. For
), as the overall star distribution in the
cluster is still well sampled. However, it becomes significant at
large cluster distances when only the brightest stars can be
detected. The binary branch becomes severely under-sampled, and wide
gaps open up. For
![]() the binary branch
disappears in all models.
the binary branch
disappears in all models.
The inferred cluster core radius also depends quite sensitively on the completeness of the stellar sample. As the clusters evolve dynamically, high-mass stars sink towards the cluster centre due to mass segregation, whereas low-mass stars move outwards, building up the extended halo (Fig. 2 in K3). Sub-populations of higher-mass stars therefore exhibit smaller core radii as time progresses relative to the low-mass population.
This trend is clearly seen in Fig. 6, where the
second break moves to smaller separations as
![]() increases.
At very late stages of the dynamical evolution and for very large
cut-off masses, the core radius may become too small, so that the
second break is no longer noticeable. For example, the function
increases.
At very late stages of the dynamical evolution and for very large
cut-off masses, the core radius may become too small, so that the
second break is no longer noticeable. For example, the function
![]() follows an almost perfect r-2-power-law for
follows an almost perfect r-2-power-law for
![]() at
at
![]() ,
exhibiting a smooth
transition from the binary regime to the halo regime without any sign
of the cluster core, which is present when taking all stars into
account. When considering only stars with
,
exhibiting a smooth
transition from the binary regime to the halo regime without any sign
of the cluster core, which is present when taking all stars into
account. When considering only stars with
![]() ,
then the
signature of the cluster core disappears at all times. This bias needs
be taken into account when interpreting observational data on star
clusters.
,
then the
signature of the cluster core disappears at all times. This bias needs
be taken into account when interpreting observational data on star
clusters.
| Model | time | t |
r1 (pc) | r2 (pc) | |||
| Model |
|
0.0 | 0.0014 | 0.079 | 0.03 | 0.08 | 8.0 |
|
|
1.19 | 0.0018 | 0.16 | 0.04 | 0.1 | 8.0 | |
|
|
11.9 | 0.0035 | 0.32 | 0.08 | 0.4 | 8.0 | |
|
|
300 | 0.011 | 1.0 | 0.5 | 2.1 | 6.0 | |
| Model |
|
0.0 | 0.005 | 0.20 | 0.08 | 0.25 | 8.0 |
|
|
6.67 | 0.004 | 0.32 | 0.09 | 0.4 | 8.0 | |
|
|
66.7 | 0.01 | 0.63 | 0.25 | 1.2 | 7.5 | |
|
|
300 | 0.022 | 1.6 | 0.7 | 2.6 | 6.2 | |
| Model |
|
0.0 | 0.016 | 0.79 | 0.32 | 0.8 | 8.0 |
|
|
37.5 | 0.016 | 1.26 | 0.26 | 1.0 | 8.0 | |
|
|
300 | 0.035 | 2.0 | 0.75 | 2.6 | 6.7 | |
| Model |
|
0.0 | 0.032 | 2.0 | 1.1 | 2.5 | 8.0 |
|
|
211 | 0.05 | 1.9 | 1.0 | 2.5 | 7.2 | |
|
|
296 | 0.05 | 2.0 | 0.83 | 2.5 | 6.7 | |
| Model |
|
0.0 | -- | 0.12 | 0.03 | 0.08 | 8.0 |
|
|
1.19 | -- | 0.11 | 0.03 | 0.1 | 8.0 | |
|
|
11.9 | 0.0028 | 0.34 | 0.05 | 0.3 | 8.0 | |
|
|
297 | 0.022 | 1.6 | 0.28 | 2.0 | 6.4 | |
| Model |
|
0.0 | -- | 0.31 | 0.07 | 0.25 | 8.0 |
|
|
6.67 | -- | 0.44 | 0.07 | 0.3 | 8.0 | |
|
|
66.7 | 0.0025 | 1.1 | 0.14 | 0.9 | 7.8 | |
|
|
300 | 0.022 | 2.0 | 0.63 | 2.2 | 6.9 |
As has been elucidated above, the mean surface density of companions shows distinct branches, the extend of which appear to couple with the dynamical state of the cluster. In this section we consider this in more detail.
Simple bulk cluster properties that can be used to describe the
dynamical state of a cluster are the core radius, ![]() ,
the
half-mass radius,
,
the
half-mass radius, ![]() ,
and the tidal radius,
,
and the tidal radius, ![]() .
The
core radius is approximated by calculating the density-weighted radius
.
The
core radius is approximated by calculating the density-weighted radius
![]() (Heggie & Aarseth 1992),
(Heggie & Aarseth 1992),
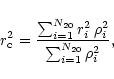 |
(2) |
We define two breaks in ![]() ,
r1 and r2, by fitting power
laws to the three distinct branches of
,
r1 and r2, by fitting power
laws to the three distinct branches of ![]() (the binary branch,
the flat central plateau, and the cluster halo out to the tidal radius
(the binary branch,
the flat central plateau, and the cluster halo out to the tidal radius
![]() )
and determining the separation at the intersection of the
fits. These values are listed in Table 2, and plots of
)
and determining the separation at the intersection of the
fits. These values are listed in Table 2, and plots of
![]() vs. r1 and
vs. r1 and ![]() vs. r2 are presented in
Fig. 7.
vs. r2 are presented in
Fig. 7.
![\begin{figure}
\par\includegraphics[width=14.8cm,clip]{MS10093-figure07.ps}
\end{figure}](/articles/aa/full/2001/22/aa10093/img113.gif) |
Figure 7:
Correlation between
the first break radius r1 and cluster core radius |
| Open with DEXTER | |
The figure shows that the quantities are well
correlated. Specifically, we find (the uncertainties are mean absolute
deviations)
The above scaling relations apply for the specific low-mass cluster
models that we investigate. These models do not suffer significant
core collapse, which is partly given by the relatively fast
evaporation time (![]() 0.5-1 Gyr, K3), and the ubiquitous binary
stars which oppose core collapse. More massive clusters are likely to
show different correlations, notably between
0.5-1 Gyr, K3), and the ubiquitous binary
stars which oppose core collapse. More massive clusters are likely to
show different correlations, notably between ![]() and
and ![]() ,
and between r1 and r2, since core collapse leads to the
contraction of
,
and between r1 and r2, since core collapse leads to the
contraction of ![]() but an expansion of
but an expansion of ![]() (Giersz &
Spurzem 2000). Analysis of more massive clusters using
(Giersz &
Spurzem 2000). Analysis of more massive clusters using ![]() is
a future goal, and it will be interesting to see if
correlations 4 and 5 remain valid.
is
a future goal, and it will be interesting to see if
correlations 4 and 5 remain valid.
Our study confirms that different projections of the same data do not
change ![]() significantly during the evolution of initially
spherical clusters in the Galactic tidal field. Also, different
numerical renditions of the same models lead to indistinguishable
results. Hence, they can be combined to improve the statistical
significance of the ensemble average
significantly during the evolution of initially
spherical clusters in the Galactic tidal field. Also, different
numerical renditions of the same models lead to indistinguishable
results. Hence, they can be combined to improve the statistical
significance of the ensemble average ![]() .
.
To allow for a proper assessment of stellar cluster properties using
![]() ,
it is important to consider as complete a census of
cluster stars as possible. Observational bias (i.e. non-detection of
faint stars) may complicate the interpretation of
,
it is important to consider as complete a census of
cluster stars as possible. Observational bias (i.e. non-detection of
faint stars) may complicate the interpretation of ![]() and
limit its applicability for inferring the initial stage of the cluster
under study (see also Bate et al. 1998). Our tests show, however,
that
and
limit its applicability for inferring the initial stage of the cluster
under study (see also Bate et al. 1998). Our tests show, however,
that ![]() remains a useful quantity even when stars with
remains a useful quantity even when stars with
![]() are not detected. We also find that mass
segregation is evident in
are not detected. We also find that mass
segregation is evident in ![]() through the location of the
second break in dependence of the mass-range used to construct
through the location of the
second break in dependence of the mass-range used to construct
![]() .
.
Future analysis of numerical models of rich clusters, for which mass segregation and possibly core collapse play important roles in the late phases of the dynamical evolution, will be performed to deepen the issues raised in this pilot study.
Acknowledgements
We thank Sverre Aarseth for distributing NBODY5 freely. RSK acknowledges support by a Otto-Hahn-Stipendium from the Max-Planck-Gesellschaft and partial support through a NASA astrophysics theory program at the joint Center for Star Formation Studies at NASA-Ames Research Center, UC Berkeley, and UC Santa Cruz. PK acknowledges support from DFG grant KR1635.