![[*]](/icons/foot_motif.gif)
A&A 371, 943-951 (2001)
DOI: 10.1051/0004-6361:20010371
Y. Q. Chen 1,2 - P. E. Nissen 2 - T. Benoni 2 - G. Zhao 1
1 -
Beijing Astronomical Observatory, Chinese Academy of Sciences, Beijing 100012, PR China
2 - Institute of Physics and Astronomy, University of Aarhus, 8000
Aarhus C, Denmark
Received 8 January 2001 / Accepted 7 March 2001
Abstract
We present a survey of lithium abundances in
185 main-sequence field stars with
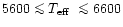 K
and
K
and
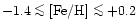 based on new measurements of the
equivalent width of the
based on new measurements of the
equivalent width of the
 Li I line in high-resolution
spectra of 130 stars and a reanalysis of data for 55 stars from
Lambert et al. (1991).
The survey takes advantage of improved photometric and spectroscopic
determinations of effective temperature and metallicity as well as
mass and age derived from Hipparcos absolute magnitudes,
offering an opportunity to investigate the behaviour of Li as a function of
these parameters.
An interesting result from this study is the presence of a large gap
in the
Li I line in high-resolution
spectra of 130 stars and a reanalysis of data for 55 stars from
Lambert et al. (1991).
The survey takes advantage of improved photometric and spectroscopic
determinations of effective temperature and metallicity as well as
mass and age derived from Hipparcos absolute magnitudes,
offering an opportunity to investigate the behaviour of Li as a function of
these parameters.
An interesting result from this study is the presence of a large gap
in the
 plane, which distinguishes
"Li-dip'' stars like those first identified in the Hyades cluster by
Boesgaard & Tripicco (1986)
from other stars with a much higher Li abundance.
The Li-dip stars concentrate on a certain mass,
which decreases with metallicity from about 1.4
plane, which distinguishes
"Li-dip'' stars like those first identified in the Hyades cluster by
Boesgaard & Tripicco (1986)
from other stars with a much higher Li abundance.
The Li-dip stars concentrate on a certain mass,
which decreases with metallicity from about 1.4  at
solar metallicity to 1.1
at
at
solar metallicity to 1.1
at
![$\mbox{\rm [Fe/H]}\simeq -1.0$](/articles/aa/full/2001/21/aa1017/img26.gif) .
Excluding the Li-dip stars and a small group of lower mass stars
with
.
Excluding the Li-dip stars and a small group of lower mass stars
with
 K and
K and
 ,
the remaining stars, when divided into four metallicity groups,
may show a correlation between Li abundance and stellar mass.
The dispersion around the
,
the remaining stars, when divided into four metallicity groups,
may show a correlation between Li abundance and stellar mass.
The dispersion around the
 -mass relation is about 0.2 dex below
![$\mbox{\rm [Fe/H]}\simeq -0.4$](/articles/aa/full/2001/21/aa1017/img30.gif) and 0.3 dex above this metallicity, which cannot
be explained by observational errors or differences in metallicity.
Furthermore, there is no correlation between the residuals of the
-mass relations and stellar age, which ranges from 1.5 Gyr to about
15 Gyr. This suggests that Li depletion occurs early
in stellar life and that parameters other than stellar mass and metallicity
affect the degree of depletion, e.g. initial rotation velocity and/or
the rate of angular momentum loss. It cannot be excluded, however, that
a cosmic scatter of the Li abundance in the Galaxy at a given metallicity
contributes to the dispersion in Li abundance. These
problems make it difficult to determine the Galactic evolution of Li
from the data, but a comparison of
the upper envelope of the distribution of stars in the
and 0.3 dex above this metallicity, which cannot
be explained by observational errors or differences in metallicity.
Furthermore, there is no correlation between the residuals of the
-mass relations and stellar age, which ranges from 1.5 Gyr to about
15 Gyr. This suggests that Li depletion occurs early
in stellar life and that parameters other than stellar mass and metallicity
affect the degree of depletion, e.g. initial rotation velocity and/or
the rate of angular momentum loss. It cannot be excluded, however, that
a cosmic scatter of the Li abundance in the Galaxy at a given metallicity
contributes to the dispersion in Li abundance. These
problems make it difficult to determine the Galactic evolution of Li
from the data, but a comparison of
the upper envelope of the distribution of stars in the
![$\log \varepsilon ({\rm Li})- \mbox{\rm [Fe/H]}$](/articles/aa/full/2001/21/aa1017/img31.gif) plane with recent Galactic evolutionary models
by Romano et al. (1999) suggests that
novae are a major source for the Li production in the Galactic disk;
their occurrence seems to be the explanation for the steep increase of
Li abundance at
.
plane with recent Galactic evolutionary models
by Romano et al. (1999) suggests that
novae are a major source for the Li production in the Galactic disk;
their occurrence seems to be the explanation for the steep increase of
Li abundance at
.
Key words: stars: abundances - stars: evolution - stars: late-type - galaxy: evolution - galaxy: solar neighbourhood
Following the discovery by Spite & Spite (1982) of a
uniform abundance of lithium in unevolved halo stars with
 K,
this trace element has attracted much attention, and many papers
have addressed problems of Galactic evolution and stellar depletion
of Li. The diagram of Li abundance versus metallicity for F and G stars
illustrates these problems. Below
K,
this trace element has attracted much attention, and many papers
have addressed problems of Galactic evolution and stellar depletion
of Li. The diagram of Li abundance versus metallicity for F and G stars
illustrates these problems. Below
![$\mbox{\rm [Fe/H]}\simeq -1.4$](/articles/aa/full/2001/21/aa1017/img33.gif) one sees a lithium
plateau with a very small dispersion of the Li abundance
(e.g. Spite et al. 1996) and perhaps a slight slope
of Li vs. [Fe/H] (Ryan et al. 1999). Above
the upper envelope of the distribution of stars in the
-
one sees a lithium
plateau with a very small dispersion of the Li abundance
(e.g. Spite et al. 1996) and perhaps a slight slope
of Li vs. [Fe/H] (Ryan et al. 1999). Above
the upper envelope of the distribution of stars in the
-
![$\mbox{\rm [Fe/H]}$](/articles/aa/full/2001/21/aa1017/img34.gif) diagram
increases from the plateau value
diagram
increases from the plateau value
 (Li)
(Li)
 to about 3.0 at
![$\mbox{\rm [Fe/H]}\simeq 0.0$](/articles/aa/full/2001/21/aa1017/img37.gif) (Lambert et al.
1991). In the same metallicity range
the Li abundances show, however, an enormous variation
at a given metallicity, i.e. more than 3 dex.
(Lambert et al.
1991). In the same metallicity range
the Li abundances show, however, an enormous variation
at a given metallicity, i.e. more than 3 dex.
The prevalent interpretation of the
-
diagram is that the plateau
represents the primordial Big Bang 7Li abundance and that the upper envelope
of the distribution reflects the Galactic evolution of lithium.
Before adopting this explanation we should,
however, be able to explain why stars with
![$\mbox{\rm [Fe/H]}\mathrel{\mathchoice {\vcenter{\offinterlineskip\halign{\hfil
...
...offinterlineskip\halign{\hfil$\scriptscriptstyle ...](/articles/aa/full/2001/21/aa1017/img38.gif) have such a
large dispersion of their Li abundances. Furthermore, it is not clear
if stars along the upper envelope have retained their original
Li abundances or suffered a mild degree of Li depletion. One may also
ask if there has been a homogeneous evolution of Li in the
Galaxy as a function of [Fe/H] or if there is a dispersion of the Li
abundance in the interstellar medium at a given metallicity related to
time or position in the Galaxy.
have such a
large dispersion of their Li abundances. Furthermore, it is not clear
if stars along the upper envelope have retained their original
Li abundances or suffered a mild degree of Li depletion. One may also
ask if there has been a homogeneous evolution of Li in the
Galaxy as a function of [Fe/H] or if there is a dispersion of the Li
abundance in the interstellar medium at a given metallicity related to
time or position in the Galaxy.
In an interesting paper on Li abundances in 81 dwarf stars, Lambert et al.
(1991) discovered that dwarf stars with
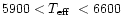 K
tend to have a bimodal distribution in the
-
K
tend to have a bimodal distribution in the
-
 diagram (see their
Fig. 4). Stars belonging to a "high-Li'' group show an increasing
abundance of Li with
and [Fe/H]. Most of the stars in the
"low-Li'' group seem to have evolved from
diagram (see their
Fig. 4). Stars belonging to a "high-Li'' group show an increasing
abundance of Li with
and [Fe/H]. Most of the stars in the
"low-Li'' group seem to have evolved from
 (ZAMS)
  6600 K,
i.e. the temperature of the "Li-dip'' stars discovered in the Hyades
by Boesgaard & Tripicco (1986), but a few low-Li stars have no
connection to the Li-dip. Still, they have an order of
magnitude less lithium than stars in the high-Li group
with corresponding parameters
,
MV, and [Fe/H].
6600 K,
i.e. the temperature of the "Li-dip'' stars discovered in the Hyades
by Boesgaard & Tripicco (1986), but a few low-Li stars have no
connection to the Li-dip. Still, they have an order of
magnitude less lithium than stars in the high-Li group
with corresponding parameters
,
MV, and [Fe/H].
In a comprehensive work on Li abundances of slightly evolved F-type
disk stars, Balachandran (1990) also identified a number
of Hyades dip-like field stars, which all appear to have evolved
from a
(ZAMS) range of 6500 to 6800 K despite their metallicity
differences. As pointed out by Balachandran,
this means that the characteristic mass of the Li-dip stars
decreases with metallicity.
Recently, Romano et al. (1999) have studied the Galactic
evolution of Li by comparing the distribution of stars in the
diagram with predictions from chemical evolution models
that include several sources of
7Li production. From a compilation of literature data they suggest
that the Li plateau extends up to
![$\mbox{\rm [Fe/H]}\simeq -0.5$](/articles/aa/full/2001/21/aa1017/img42.gif) with a steep rise in the Li abundance for higher metallicities.
In order to reproduce this trend, novae have to be included
as a dominant contributor to the Li production in the Galaxy in addition
to the contribution from AGB stars, Type II SNe and cosmic ray processes.
with a steep rise in the Li abundance for higher metallicities.
In order to reproduce this trend, novae have to be included
as a dominant contributor to the Li production in the Galaxy in addition
to the contribution from AGB stars, Type II SNe and cosmic ray processes.
In order to verify and extend the interesting findings of
Balachandran (1990), Lambert et al.
(1991) and Romano et al. (1999), we have measured
the equivalent width of the
 line in 133 main sequence
field stars with
K and
.
Li abundances
have been derived from a model atmosphere analysis of the data,
and stellar masses and ages have been derived from a comparison of
,
MV
values with stellar evolutionary tracks in the HR diagram using Hipparcos
parallaxes to determine the absolute magnitudes of the stars.
Furthermore, the Lambert et al. (1991) data have been analyzed
in the same way. The resulting
large homogeneous set of Li abundances is used to rediscuss
the distribution of stars in the
and
diagrams aiming at
a better understanding of the Galactic evolution of lithium and
the depletion in stars.
line in 133 main sequence
field stars with
K and
.
Li abundances
have been derived from a model atmosphere analysis of the data,
and stellar masses and ages have been derived from a comparison of
,
MV
values with stellar evolutionary tracks in the HR diagram using Hipparcos
parallaxes to determine the absolute magnitudes of the stars.
Furthermore, the Lambert et al. (1991) data have been analyzed
in the same way. The resulting
large homogeneous set of Li abundances is used to rediscuss
the distribution of stars in the
and
diagrams aiming at
a better understanding of the Galactic evolution of lithium and
the depletion in stars.
equivalent widths was obtained
from CCD spectra of 90 main-sequence stars with
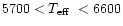 K and
K and
![$-1.0 < \mbox{\rm [Fe/H]}< +0.1$](/articles/aa/full/2001/21/aa1017/img44.gif) observed with the Coudé Echelle Spectrograph at
the 2.16 m telescope of Beijing Astronomical Observatory;
see Chen et al. (2000), who have used these spectra in a large survey of abundances of heavier elements in F and G disk
dwarfs. The spectra cover the region 5500-9000 Å at a resolution
of 40000 and have S/N above 150; see Fig. 1.
observed with the Coudé Echelle Spectrograph at
the 2.16 m telescope of Beijing Astronomical Observatory;
see Chen et al. (2000), who have used these spectra in a large survey of abundances of heavier elements in F and G disk
dwarfs. The spectra cover the region 5500-9000 Å at a resolution
of 40000 and have S/N above 150; see Fig. 1.
![\begin{figure}
\par\includegraphics[width=8.3cm,clip]{p1017.f1}\end{figure}](/articles/aa/full/2001/21/aa1017/img51.gif) |
Figure 1:
Representative Xinglong spectra in the region of the
line for HD142373
(
 K, K,
 , ,
![$ \mbox{\rm [Fe/H]}= -0.39 $](/articles/aa/full/2001/21/aa1017/img47.gif) and a high
and a high
 )
with a quite strong lithium line and HD106516A
( )
with a quite strong lithium line and HD106516A
(
 K, K,
 , ,
![$ \mbox{\rm [Fe/H]}= -0.71 $](/articles/aa/full/2001/21/aa1017/img50.gif) and a relatively low and a relatively low
 )
without Li detection )
without Li detection |
| Open with DEXTER | |
The second set of equivalent widths was measured in spectra
of 28 dwarfs with
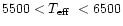 K and
K and
![$-1.4 < \mbox{\rm [Fe/H]}< -0.5$](/articles/aa/full/2001/21/aa1017/img53.gif) observed with the ESO NTT EMMI echelle spectrograph
at a resolution of 60000 and
observed with the ESO NTT EMMI echelle spectrograph
at a resolution of 60000 and
 .
These spectra have previously been used by Nissen & Schuster (1997)
in a study of the chemical composition of halo and disk stars with
overlapping metallicities.
.
These spectra have previously been used by Nissen & Schuster (1997)
in a study of the chemical composition of halo and disk stars with
overlapping metallicities.
The third sample consists of 15 turnoff stars
with
![$-0.8 < \mbox{\rm [Fe/H]}< +0.2$](/articles/aa/full/2001/21/aa1017/img55.gif) .
They were observed
in the Li I line region with the
ESO 1.4 m CAT telescope and the CES spectrograph at
a resolution of 105000 and a very high S/N of 300 to 1000.
These spectra were primarily obtained for a study of the lithium isotope
ratio and some of them have been analyzed by Nissen et al.
(1999), who detected 6Li in two stars
(HD68284 and HD130551) at a level corresponding to
.
They were observed
in the Li I line region with the
ESO 1.4 m CAT telescope and the CES spectrograph at
a resolution of 105000 and a very high S/N of 300 to 1000.
These spectra were primarily obtained for a study of the lithium isotope
ratio and some of them have been analyzed by Nissen et al.
(1999), who detected 6Li in two stars
(HD68284 and HD130551) at a level corresponding to
![$\element[][6]{Li}/\element[][7]{Li}\simeq 0.05$](/articles/aa/full/2001/21/aa1017/img56.gif) .
Here we use the equivalent width of the Li I line to derive the total Li abundance of the stars.
.
Here we use the equivalent width of the Li I line to derive the total Li abundance of the stars.
Due to the complications in measuring reliable equivalent widths and making a proper model atmosphere analysis of double-lined spectroscopic binaries, such stars were excluded from the three samples. Proven or suspected single-lined spectroscopic binaries were, however, retained. According to Chen et al. (2000) such stars do not appear to have any abundance anomalies of the heavier elements. As discussed later there are, however, indications that the Li abundance may be peculiar for such SB1 stars.
The spectra were reduced using standard MIDAS
(Xinglong data) and IRAF (ESO data) routines for order definition,
background correction, flatfielding,
extraction of echelle orders, wavelength calibration and
continuum fitting. At the resolution of the Xinglong and ESO NTT spectra,
the profile of the Li I doublet is well approximated by a Gaussian function
despite its inherent asymmetry. Hence, the equivalent width of the
Li I line was measured by Gaussian fitting, which has the advantage that the
weak
 6707.44 line in the blue wing
of the Li line gives no significant contribution. For the high resolution,
high S/N spectra from
the ESO CES the equivalent width was measured both by Gaussian fitting and
by direct integration excluding the blending Fe I line. The two sets
of data agree within
6707.44 line in the blue wing
of the Li line gives no significant contribution. For the high resolution,
high S/N spectra from
the ESO CES the equivalent width was measured both by Gaussian fitting and
by direct integration excluding the blending Fe I line. The two sets
of data agree within  mÅ.
mÅ.
![\begin{figure}
\par\includegraphics[width=8.1cm,clip]{p1017.f2}\end{figure}](/articles/aa/full/2001/21/aa1017/img59.gif) |
Figure 2:
Equivalent widths of the
line
measured from Xinglong (open circles) or ESO (asterisks)
spectra compared to equivalent widths given by
Lambert et al. (1991) |
| Open with DEXTER | |
Lambert et al. (1991) measured their equivalent widths
from spectra obtained at McDonald Observatory with
the Coudé Spectrographs of the 2.1 and 2.7 m telescopes.
The resolution of these spectra is around 35000 and
 .
Twenty stars are in common with the Xinglong sample and 5 stars
with the ESO sample. A comparison of the equivalent widths
is shown in Fig. 2. Obviously, Lambert et al.'s
EWs are systematically lower than the Xinglong and ESO data.
The reason for this discrepancy is unclear. A linear least square fit gives
.
Twenty stars are in common with the Xinglong sample and 5 stars
with the ESO sample. A comparison of the equivalent widths
is shown in Fig. 2. Obviously, Lambert et al.'s
EWs are systematically lower than the Xinglong and ESO data.
The reason for this discrepancy is unclear. A linear least square fit gives
The relation between the Lambert et al. equivalent widths and those
based on the Xinglong and ESO spectra appears to be well defined; the
rms scatter around the line shown in Fig. 2 is less
than 3 mÅ (excluding HD79028). Hence, we have rescaled
the Lambert et al. data according to Eq. (1) to get a homogeneous set
of equivalent widths of
.
Effective temperatures were determined from the Strömgren (b-y) color index using the
calibration of Alonso et al. (1996).
For the large majority of stars the gravities were determined via Hipparcos
parallaxes (ESA 1997) as described by Chen et al. (2000).
For the more distant stars
we adopt a spectroscopic gravity obtained by requiring
that Fe I and Fe II lines provide the same iron abundance.
Metallicities were taken from Chen et al. (2000),
Nissen & Schuster (1997), and Edvardsson et al.
(1993). For a few stars not included
in these sources, [Fe/H] was derived from the equivalent widths of the
 and
and
 Fe I lines given by Lambert et al.
using "solar'' oscillator strengths. Microturbulences were taken from
Chen et al. (2000) or calculated from the empirical relation found by
Edvardsson et al. (1993).
The uncertainties of the parameters are:
Fe I lines given by Lambert et al.
using "solar'' oscillator strengths. Microturbulences were taken from
Chen et al. (2000) or calculated from the empirical relation found by
Edvardsson et al. (1993).
The uncertainties of the parameters are:
 K,
K,
 dex,
dex,
![$\sigma (\mbox{\rm [Fe/H]}) = 0.1$](/articles/aa/full/2001/21/aa1017/img66.gif) and
and
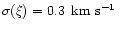 .
.
The model atmospheres were interpolated from a grid of
plane-parallel, LTE models computed with the MARCS code
by Bengt Edvardsson (Uppsala). The corresponding analysis program,
SPECTRUM, was used to calculate equivalent widths of the Li I line
as a function of the Li abundance with wavelengths and oscillator
strengths of the Li doublet components taken from
Sansonetti et al. (1995)
and Yan & Drake (1995), respectively (see Smith et al.
1998, Table 3).
The contribution of the
 isotope was assumed to be
negligible.
Li abundances were then obtained by requiring that the theoretical
equivalent widths should match the observed ones.
isotope was assumed to be
negligible.
Li abundances were then obtained by requiring that the theoretical
equivalent widths should match the observed ones.
The uncertainty in the Li abundance, resulting from errors of the
equivalent widths, is around 0.05 dex for stars with
 10-120 mÅ, increasing rapidly for stars with weaker lines.
Changes of the Li abundance due to errors in the model atmosphere
parameters are 0.058 dex for
10-120 mÅ, increasing rapidly for stars with weaker lines.
Changes of the Li abundance due to errors in the model atmosphere
parameters are 0.058 dex for
 K, -0.001
dex for both
K, -0.001
dex for both
 and
and
![$\Delta \mbox{\rm [Fe/H]}=+0.1$](/articles/aa/full/2001/21/aa1017/img72.gif) ,
-0.002 for
,
-0.002 for
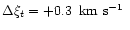 .
These numbers were derived
for HD142373 with
K,
,
and a Li I equivalent width of 49 mÅ, but
are representative of the whole sample.
For the Lambert et al. sample our derived Li abundances agree with their
original values and those derived by Romano et al. (1999)
within 0.1 dex. The differences are mainly due to different ways of determining
and our rescaling of the EWs published by Lambert et al.
.
These numbers were derived
for HD142373 with
K,
,
and a Li I equivalent width of 49 mÅ, but
are representative of the whole sample.
For the Lambert et al. sample our derived Li abundances agree with their
original values and those derived by Romano et al. (1999)
within 0.1 dex. The differences are mainly due to different ways of determining
and our rescaling of the EWs published by Lambert et al.
Finally, non-LTE
corrections were applied to the derived Li abundances based on the
work by Carlsson et al. (1994), who studied non-LTE
formation of the
line as a function of effective
temperature,
gravity, metallicity and Li abundance. For the present sample of stars, the
largest correction (LTE - non-LTE) is 0.12 dex for the hottest and
most Li-rich stars; the correction decreases with
temperature and becomes slightly negative for the cool Li-poor stars.
Atmospheric parameters and Li abundances are presented in
Table 1, which also includes the absolute magnitude derived from
the Hipparcos parallax (ESA 1997). In a few cases where the
Hipparcos parallax is not available or has a low
relative accuracy the Strömgren c1 index has been used to
determine
 (see
Edvardsson et al. 1993). Stellar masses and ages derived
from evolutionary tracks of VandenBerg et al. (2000)
(see Sect. 4.2) are also given in Table 1 (available in electronic at
http://www.edpsciences.org and at http://cdsweb.u-strasbg.fr).
(see
Edvardsson et al. 1993). Stellar masses and ages derived
from evolutionary tracks of VandenBerg et al. (2000)
(see Sect. 4.2) are also given in Table 1 (available in electronic at
http://www.edpsciences.org and at http://cdsweb.u-strasbg.fr).
Figure 3 shows the Li abundance vs.
for all stars
in the present survey.
As seen, the stars tend to separate into two groups, one with high and
one with low Li abundances. Although there is a significant spread of
the Li abundance within each group, a gap of at least 1.0 dex is seen for
 K suggesting that a special and very rapid
Li-depletion mechanism is operating in the interior of the low-Li stars.
K suggesting that a special and very rapid
Li-depletion mechanism is operating in the interior of the low-Li stars.
In the low-Li group almost all abundances derived are upper limits,
and the apparent linear correlation between the Li abundance and
simply reflects the observational detection limit,
 mÅ,
which corresponds to a Li abundance of 1.0 dex
at
mÅ,
which corresponds to a Li abundance of 1.0 dex
at
 K, 1.3 dex at
 K and 1.6 dex
at
K and 1.6 dex
at
 K. As discussed in the next section,
most of the low-Li stars with
K
have evolved from an effective temperature range corresponding
to that of the Hyades Li-dip stars.
K. As discussed in the next section,
most of the low-Li stars with
K
have evolved from an effective temperature range corresponding
to that of the Hyades Li-dip stars.
In the high-Li region, there is a spread of 1.0 dex in Li abundance
at a given
.
Metallicity seems to be responsible
for the main part of the scatter based on the fact that the upper
envelope consists of stars with
![$\mbox{\rm [Fe/H]}>-0.4$](/articles/aa/full/2001/21/aa1017/img80.gif) ,
while nearly all
stars with
,
while nearly all
stars with
![$\mbox{\rm [Fe/H]}<-0.4$](/articles/aa/full/2001/21/aa1017/img81.gif) have a Li abundance lower than
2.5 dex.
This result, coupled with the fact that there is no large Li abundance
differences among stars with
have a Li abundance lower than
2.5 dex.
This result, coupled with the fact that there is no large Li abundance
differences among stars with
![$-1.4 < \mbox{\rm [Fe/H]}< -0.6$](/articles/aa/full/2001/21/aa1017/img82.gif) and
K,
suggests a significant increase of the Galactic production of lithium
around
and
K,
suggests a significant increase of the Galactic production of lithium
around
![$\mbox{\rm [Fe/H]}\sim -0.4$](/articles/aa/full/2001/21/aa1017/img83.gif) .
.
![\begin{figure}
\par\includegraphics[width=8.3cm,clip]{p1017.f3}\end{figure}](/articles/aa/full/2001/21/aa1017/img84.gif) |
Figure 3: Lithium abundance versus effective temperature for stars in the present survey. Upper limits of the Li abundance are indicated with downward directed arrows |
| Open with DEXTER | |
In the
K range, the mean Li abundance of stars in
the high-Li region shows a decrease with temperature for
while it is nearly
independent
for
.
In both metallicity groups a steep decline
of the Li abundance begins at
 K. Furthermore,
a large scatter in Li abundance is apparent in the range
K. Furthermore,
a large scatter in Li abundance is apparent in the range
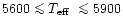 with a tendency towards a bimodal distribution. The Sun with a
Li abundance of
with a tendency towards a bimodal distribution. The Sun with a
Li abundance of
 (Steenbock & Holweger 1984)
belongs to the low-Li group.
(Steenbock & Holweger 1984)
belongs to the low-Li group.
In order to study the behaviour of Li as a function of stellar
mass and age, the positions of the stars
in the
-
 diagram were compared to
the evolutionary tracks of VandenBerg et al. (2000).
Masses and ages were derived as described by Chen et al. (2000).
The typical error of the mass is 0.03-0.06 .
For most
of the stars the age could be determined with an error of
15-20%, but a number of stars situated close to the ZAMS or in the hook
region of the evolutionary tracks
have much larger age errors. For these stars no age
is given in Table 1.
diagram were compared to
the evolutionary tracks of VandenBerg et al. (2000).
Masses and ages were derived as described by Chen et al. (2000).
The typical error of the mass is 0.03-0.06 .
For most
of the stars the age could be determined with an error of
15-20%, but a number of stars situated close to the ZAMS or in the hook
region of the evolutionary tracks
have much larger age errors. For these stars no age
is given in Table 1.
![\begin{figure}
\par\includegraphics[width=17cm,clip]{p1017.f4}\end{figure}](/articles/aa/full/2001/21/aa1017/img93.gif) |
Figure 4:
Stellar positions in the MV-
 diagram
divided according to metallicity and compared to
evolutionary tracks of VandenBerg et al. (2000)
corresponding to:
a)
diagram
divided according to metallicity and compared to
evolutionary tracks of VandenBerg et al. (2000)
corresponding to:
a)
![$\mbox{\rm [Fe/H]}= +0.12$](/articles/aa/full/2001/21/aa1017/img89.gif) ,
b) ,
b)
![$\mbox{\rm [Fe/H]}= -0.20$](/articles/aa/full/2001/21/aa1017/img90.gif) ,
c) ,
c)
![$\mbox{\rm [Fe/H]}= -0.53$](/articles/aa/full/2001/21/aa1017/img91.gif) ,
and
d) ,
and
d)
![$\mbox{\rm [Fe/H]}= -0.83$](/articles/aa/full/2001/21/aa1017/img92.gif) .
The filled circles indicate stars in the low-Li group
and open circles stars in the high-Li group.
In a) Hyades stars have been added and
are plotted with squares instead of circles .
The filled circles indicate stars in the low-Li group
and open circles stars in the high-Li group.
In a) Hyades stars have been added and
are plotted with squares instead of circles |
| Open with DEXTER | |
Figure 4 shows the position of the stars in the
-
diagram for four metallicity ranges.
In panel a), that contains the most
metal rich stars, 46 Hyades stars are added.
They were selected from the papers of
Boesgaard & Tripicco (1986),
Boesgaard & Budge (1988) and
Thorburn et al. (1993) with the condition that they should
lie in the same
range as our program stars, and excluding known
binaries. Strömgren photometry of the Hyades stars was taken from
Crawford & Perry (1966) and Hipparcos parallaxes
from Perryman et al. (1998). The effective temperatures
were determined in the same way as for the program stars, and the
derived (non-LTE) Li abundance
is based on the Li-Fe blended EWs given in the three papers
taking into account the contribution
of the Fe I
 blending line using
log
gf = -2.29 as derived from an analysis of the solar flux spectrum.
blending line using
log
gf = -2.29 as derived from an analysis of the solar flux spectrum.
As seen from Fig. 4, stars in the low-Li region (filled circles)
are concentrated either in the high mass or the low mass region
at a given metallicity. The high-mass, low-Li stars probably
suffer from the same depletion mechanism that acts on the Hyades.
Like the Hyades Li-dip stars, they are grouped in a quite narrow mass range.
This is particularly clear from panels b) and c). Furthermore,
the mass of the Li-dip stars seems to be
metallicity dependent with lower mass for the more metal-poor stars.
According to Fig. 4, the critical mass
is about
 at
at
![$\mbox{\rm [Fe/H]}\simeq 0.1$](/articles/aa/full/2001/21/aa1017/img96.gif) ,
,
 at
at
![$\mbox{\rm [Fe/H]}\simeq -0.2$](/articles/aa/full/2001/21/aa1017/img98.gif) ,
,
 at
,
and
at
,
and
 at
at
![$\mbox{\rm [Fe/H]}\simeq -0.9$](/articles/aa/full/2001/21/aa1017/img101.gif) .
We also note that Li-dip stars can be found over a range
of effective temperatures as
clearly shown by panels b) and c), where stars with
.
We also note that Li-dip stars can be found over a range
of effective temperatures as
clearly shown by panels b) and c), where stars with
 K and
K and
 K both show the Li-dip depletion. Therefore,
Li-dip stars in the field can not be distinguished by the
temperature range alone. Instead, stellar mass is the key
parameter that decides if a star suffers from the Li-dip
depletion.
K both show the Li-dip depletion. Therefore,
Li-dip stars in the field can not be distinguished by the
temperature range alone. Instead, stellar mass is the key
parameter that decides if a star suffers from the Li-dip
depletion.
In the low-mass region there is a tendency that the lowest Li abundances occur among stars with the smallest masses, but there is no clear separation between high and low-Li stars. Apparently, the Li abundance is very sensitive to stellar mass and/or metallicity in this part of the HR diagram.
Two low-Li stars have intermediate masses, namely
HD80218 in panel b), and HD106516A in panel d).
HD80218 was recently shown to be an astrometric
binary by Gontcharov et al. (2000).
HD106516A (HR4657)
is a single-lined spectroscopic binary with an unusually large
rotational velocity (Vsini = 6.8 kms-1, Fuhrmann & Bernkopf
1999) for its effective temperature (
K)
and metallicity (
). Fuhrmann & Bernkopf
suggest that HD106516A is a blue straggler and
link the absence of Li to this special class of objects.
Lambert et al. (1991) also classified HD106516A as a Li-poor star unrelated to both the Li-dip stars and the low-mass stars. They suggested six other stars as belonging to this "intermediate-mass'' group of Li-poor stars. None of these cases are, however, confirmed by our work. Based on the more accurate Hipparcos distances HD95241 (HR4285), HD159332 (HR6541) and HD219476 clearly belong to the Li-dip stars. HD30649 and HD143761 (HR5968) belong to the low-mass, Li-poor group. Finally, HD79028 (HR3648) is the star probably misidentified by Lambert et al. As discussed in Sect. 2, we measure a much larger equivalent width of the Li line, and hence the star belongs to the high-Li group. Altogether, we conclude that "intermediate-mass'' Li-poor stars are rare and may be binaries.
In agreement with previous studies, a plot of
as a
function of
(see Fig. 5) indicates
a large spread in Li abundance
at a given metallicity, and the abundance range tends to increase with
higher metallicity. The upper envelope of the distribution of
for
![$\mbox{\rm [Fe/H]}<-0.2$](/articles/aa/full/2001/21/aa1017/img104.gif) is compatible with the the relation
given by Lambert et al. (1991)
as derived from the Rebolo et al. (1988) data.
Above
our sample does not, however, reach
such high Li abundances as the Rebolo et al. sample. This is partly
due to the neglect of non-LTE correction by Rebolo et
al., which leads to an overestimate of the Li
abundance by about 0.1 dex for stars with the highest Li abundances.
Furthermore, we note that stars with the highest Li abundances in this
metallicity range in Rebolo et al. (1988)
all have
is compatible with the the relation
given by Lambert et al. (1991)
as derived from the Rebolo et al. (1988) data.
Above
our sample does not, however, reach
such high Li abundances as the Rebolo et al. sample. This is partly
due to the neglect of non-LTE correction by Rebolo et
al., which leads to an overestimate of the Li
abundance by about 0.1 dex for stars with the highest Li abundances.
Furthermore, we note that stars with the highest Li abundances in this
metallicity range in Rebolo et al. (1988)
all have
 K. These rather young, metal-rich stars are not
represented in our sample of stars.
K. These rather young, metal-rich stars are not
represented in our sample of stars.
In order to show the upper envelope more clearly, Fig. 5
includes only stars belonging to the high-Li group
defined as stars having
 for
K
and
for
K
and
 for
for
 K. As seen, from Fig. 3 this
definition excludes all Li-dip stars and the group of low-Li stars
for
K.
K. As seen, from Fig. 3 this
definition excludes all Li-dip stars and the group of low-Li stars
for
K.
The distribution of stars in Fig. 5
is compared to recent models for the Galactic evolution
of Li by Romano et al. (1999).
Their model A includes contributions to the Li production from low-mass
AGB stars (C-stars), high-mass AGB stars and SNeII. As seen, this model
gives a very poor fit to the upper envelope. In model B, Li production
by novae is included, which improves the fit at higher metallicities,
but the models fails in predicting a too high Li abundance at
metallicities around
![$\mbox{\rm [Fe/H]}\sim -0.7$](/articles/aa/full/2001/21/aa1017/img109.gif) .
Model C has no contribution from
low-mass AGB stars and the yields of high-mass AGB stars and SNeII are
reduced by a factor of two, whereas the contribution from novae is retained.
This model provides a better fit of the upper envelope at low metallicities
by predicting only a weak increase in the Li abundance from
.
Model C has no contribution from
low-mass AGB stars and the yields of high-mass AGB stars and SNeII are
reduced by a factor of two, whereas the contribution from novae is retained.
This model provides a better fit of the upper envelope at low metallicities
by predicting only a weak increase in the Li abundance from
![$\mbox{\rm [Fe/H]}= -1.5$](/articles/aa/full/2001/21/aa1017/img110.gif) to -0.5 and then a steep increase, but the model fails to account for
the high Li abundance (
to -0.5 and then a steep increase, but the model fails to account for
the high Li abundance ( 3.0 dex) for stars with
![$-0.3 < \mbox{\rm [Fe/H]}< -0.1$](/articles/aa/full/2001/21/aa1017/img112.gif) .
Finally, model C+GCR also includes the contribution to Li production from
cosmic ray processes. This model gives the best overall fit, especially when
one takes into account that all stars with
.
Finally, model C+GCR also includes the contribution to Li production from
cosmic ray processes. This model gives the best overall fit, especially when
one takes into account that all stars with
![$\mbox{\rm [Fe/H]}> -0.1$](/articles/aa/full/2001/21/aa1017/img113.gif) probably
have suffered some
Li depletion, as suggested by the high (3.3 dex) Li abundance in meteorites
and in young stellar clusters like the Pleiades.
probably
have suffered some
Li depletion, as suggested by the high (3.3 dex) Li abundance in meteorites
and in young stellar clusters like the Pleiades.
![\begin{figure}
\par\includegraphics[width=8.2cm,clip]{p1017.f5}\end{figure}](/articles/aa/full/2001/21/aa1017/img114.gif) |
Figure 5: Lithium abundances as a function of metallicity for stars in the high-Li group (see text for the definition). Theoretical predictions from Romano et al. (1999) are plotted |
| Open with DEXTER | |
One low metallicity star (HD106038 at
![$\mbox{\rm [Fe/H]}= -1.33$](/articles/aa/full/2001/21/aa1017/img115.gif) and
and
 )
lies well above
the Li evolutionary curves, and also above the "Spite plateau''
for metal-poor halo stars. As shown by Nissen & Schuster (1997)
this star has very peculiar abundances; [Si/Fe]
)
lies well above
the Li evolutionary curves, and also above the "Spite plateau''
for metal-poor halo stars. As shown by Nissen & Schuster (1997)
this star has very peculiar abundances; [Si/Fe]
 ,
[Ni/Fe]
,
[Ni/Fe]
 ,
[Y/Fe]
,
[Y/Fe]
 ,
and [Ba/Fe]
,
and [Ba/Fe]
 .
Most likely, the atmospheric composition of the star has been changed
by mass transfer from an evolved component in its AGB phase causing
the enrichment in Li and the s-process elements. The enrichment
in Si and Ni is, however, difficult to explain.
.
Most likely, the atmospheric composition of the star has been changed
by mass transfer from an evolved component in its AGB phase causing
the enrichment in Li and the s-process elements. The enrichment
in Si and Ni is, however, difficult to explain.
![\begin{figure}
\par\includegraphics[width=17.1cm,clip]{p1017.f6}\end{figure}](/articles/aa/full/2001/21/aa1017/img121.gif) |
Figure 6: Li abundance versus stellar mass for "high-Li'' stars divided into four metallicity groups. In a) Hyades stars outside the Li-dip have been added and are plotted with crosses. In d) stars with halo kinematics have been plotted with filled circles. The rest of the stars have disk kinematics |
| Open with DEXTER | |
-
diagram (Fig. 5)
that only a few stars lie along the Li evolutionary curves predicted from
the models of Romano et al. (1999). The canonical interpretation
is that Li has been destroyed in the majority of the stars due to
reactions with protons at the bottom of the outer convection zone of the
star, i.e. at
 K. As the depth of the convection zone
depends primarily on stellar mass, a correlation between
Li abundance and mass is then expected for a given metallicity. To investigate
this, we have divided the high-Li stars (i.e. those included in
Fig. 5) into four
metallicity intervals and plotted the Li abundance as a function of
mass (see Fig. 6). In panel a), Hyades stars outside the
Li-dip region have been added.
K. As the depth of the convection zone
depends primarily on stellar mass, a correlation between
Li abundance and mass is then expected for a given metallicity. To investigate
this, we have divided the high-Li stars (i.e. those included in
Fig. 5) into four
metallicity intervals and plotted the Li abundance as a function of
mass (see Fig. 6). In panel a), Hyades stars outside the
Li-dip region have been added.
As seen from Fig. 6 there may indeed be a correlation
between Li abundance and mass.
Excluding the Hyades and the peculiar star (HD106038),
straight lines have been fitted to the data
taking into account errors in both coordinates.
The slope of the fitted lines is about the same in panels
a), b) and c),
 Mass
Mass  .
For the most metal-poor group, panel d), the slope is
1 but the correlation is marginal.
It is also seen that the slope defined by the Hyades stars
agrees well with that of the field stars and that the Hyades lie only
slightly above the mean relation for the field stars
despite of their younger age.
.
For the most metal-poor group, panel d), the slope is
1 but the correlation is marginal.
It is also seen that the slope defined by the Hyades stars
agrees well with that of the field stars and that the Hyades lie only
slightly above the mean relation for the field stars
despite of their younger age.
The dispersion around the fitted lines in Fig. 6 is,
however, much
larger than expected from the estimated errors of
and the stellar
mass. From
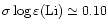 and
and  (Mass)
 we would expect a dispersion in the
direction of 0.16 dex in
panels a), b) and c) and 0.11 dex in panel d). The actual dispersion
around the fitted lines is 0.32 dex in panels a) and b), 0.22 dex in c)
and 0.14 dex in d). Furthermore, there is no significant
correlation between the residuals of the fits and the stellar age
(see Fig. 7) or
the metallicity variation within each group. The most likely explanation
is that the depletion of Li depends on parameters other
than stellar mass, age and metallicity, such as the initial rotational
velocity of the star and/or the rate of angular momentum loss
during its evolution.
The same conclusion has been reached from studies of Li abundances
of open cluster stars, e.g. the Hyades (Thorburn et al. 1993) and
M67 (Jones et al. 1999) as well as from studies of
Li abundances in upper main sequence stars (Balachandran
1990), solar-like stars (Pasquini et al. 1994)
and subgiants (Randich et al. 1999).
we would expect a dispersion in the
direction of 0.16 dex in
panels a), b) and c) and 0.11 dex in panel d). The actual dispersion
around the fitted lines is 0.32 dex in panels a) and b), 0.22 dex in c)
and 0.14 dex in d). Furthermore, there is no significant
correlation between the residuals of the fits and the stellar age
(see Fig. 7) or
the metallicity variation within each group. The most likely explanation
is that the depletion of Li depends on parameters other
than stellar mass, age and metallicity, such as the initial rotational
velocity of the star and/or the rate of angular momentum loss
during its evolution.
The same conclusion has been reached from studies of Li abundances
of open cluster stars, e.g. the Hyades (Thorburn et al. 1993) and
M67 (Jones et al. 1999) as well as from studies of
Li abundances in upper main sequence stars (Balachandran
1990), solar-like stars (Pasquini et al. 1994)
and subgiants (Randich et al. 1999).
The fact that there is no significant correlation between the residuals
of the
-mass relations and stellar age is interesting. As the age for
the present sample of stars ranges from 1.5 Gyr to about 15 Gyr, the lack
of correlation suggests that the main part of Li depletion occurs rather
early in the stellar life, i.e. at ages
 Gyr. In a review of Li
abundances in open cluster stars, Pasquini (2000) reached a
similar conclusion: most of the Li depletion occurs for stellar ages between
100 and 600 Myr.
Gyr. In a review of Li
abundances in open cluster stars, Pasquini (2000) reached a
similar conclusion: most of the Li depletion occurs for stellar ages between
100 and 600 Myr.
There may, however, also be a contribution to the Li
dispersion arising from a cosmic scatter of Li in the Galaxy
at a given metallicity. To investigate this, we searched for
correlations between Li abundances and stellar kinematics, but
the outcome was negative. In the lowest metallicity group
(
![$-1.4 < \mbox{\rm [Fe/H]}< -0.7$](/articles/aa/full/2001/21/aa1017/img129.gif) )
eight stars have halo kinematics, i.e. elongated
Galactic orbits and low values of the velocity component in the direction
of Galactic rotation,
)
eight stars have halo kinematics, i.e. elongated
Galactic orbits and low values of the velocity component in the direction
of Galactic rotation,
 kms-1.
Furthermore, Nissen & Schuster (1997) have shown that these
"metal-rich'' halo stars have lower ratios between the
kms-1.
Furthermore, Nissen & Schuster (1997) have shown that these
"metal-rich'' halo stars have lower ratios between the
 -elements and Fe than disk stars in the same metallicity range.
As seen from Fig. 6 panel d) there is, however, no systematic
differences between the Li abundance of stars with
halo and disk kinematics, respectively. Still, we cannot exclude
variations in Li/Fe on Galactic scales that are not reflected in
the kinematics of the stars. The fact that Be abundances of
disk main sequence stars with
between 5700 and 6400 K
show a large spread (Boesgaard & King 1993) suggests
inefficient mixing of light elements produced by cosmic rays,
considering that beryllium is more robust against stellar destruction
than lithium and is unlikely to be depleted in the temperature
range mentioned.
-elements and Fe than disk stars in the same metallicity range.
As seen from Fig. 6 panel d) there is, however, no systematic
differences between the Li abundance of stars with
halo and disk kinematics, respectively. Still, we cannot exclude
variations in Li/Fe on Galactic scales that are not reflected in
the kinematics of the stars. The fact that Be abundances of
disk main sequence stars with
between 5700 and 6400 K
show a large spread (Boesgaard & King 1993) suggests
inefficient mixing of light elements produced by cosmic rays,
considering that beryllium is more robust against stellar destruction
than lithium and is unlikely to be depleted in the temperature
range mentioned.
![\begin{figure}
\par\includegraphics[width=8.2cm,clip]{p1017.f7}\end{figure}](/articles/aa/full/2001/21/aa1017/img132.gif) |
Figure 7:
The residuals of
with respect to the
-mass fits
in Fig. 6 as a function of the
logarithmic stellar age. The four metallicity groups are shown by
different symbols |
| Open with DEXTER | |
The low-Li stars (not included in Fig. 6) can be
divided into two classes: lower mass stars with
 to which
the Sun belongs, and higher mass stars originating from a Hyades-like
Li dip. For the lower mass, Li-poor stars we note that adding them
to Fig. 6
greatly increases the dispersion in Li at the lower mass end of the
plots.
For the Li-dip stars, a tight correlation
between metallicity and mass is found (see Fig. 8).
A least squares fit to the data gives the following relation
to which
the Sun belongs, and higher mass stars originating from a Hyades-like
Li dip. For the lower mass, Li-poor stars we note that adding them
to Fig. 6
greatly increases the dispersion in Li at the lower mass end of the
plots.
For the Li-dip stars, a tight correlation
between metallicity and mass is found (see Fig. 8).
A least squares fit to the data gives the following relation
![$\displaystyle M = (1.40 + 0.28 \mbox{\rm [Fe/H]})~M_{\odot}$](/articles/aa/full/2001/21/aa1017/img134.gif) |
(2) |
It is noted that an extrapolation of Eq. (2) leads to a Li-dip
mass of about
 at
at
![$\mbox{\rm [Fe/H]}\simeq -1.5$](/articles/aa/full/2001/21/aa1017/img136.gif) .
This is well above
the maximum turnoff mass of halo stars (
.
This is well above
the maximum turnoff mass of halo stars (
 )
suggesting that Li-dip stars are unlikely to occur among halo stars
at their typical metallicity of
.
)
suggesting that Li-dip stars are unlikely to occur among halo stars
at their typical metallicity of
.
![\begin{figure}
\par\includegraphics[width=8.3cm,clip]{p1017.f8}\end{figure}](/articles/aa/full/2001/21/aa1017/img138.gif) |
Figure 8: The dependence of stellar mass on metallicity for Li-dip stars. Crosses refer to Hyades stars and filled circles to field stars |
| Open with DEXTER | |
K
and
,
two kinds of Li depletion emerge:
the as yet unknown process responsible for the Li-dip stars,
and the mass dependent depletion of Li, which occurs near the
bottom of the convective zone due to destruction of Li by reactions
with protons. The group of Li-dip stars is clearly separated from
the high-Li stars in
the
 diagram with a gap of at least 1 dex in the
Li abundance.
diagram with a gap of at least 1 dex in the
Li abundance.
As shown in Fig. 8 there is a well defined relation between the mass of the Li-dip stars and their metallicity, confirming previous findings by Balachandran (1990) and Randich et al. (1999). The derived mass-[Fe/H] relation, Eq. (2), may be used as a constraint on the various stellar mixing theories suggested as an explanation of the Li-dip stars: microscopic diffusion, mass loss, meridional circulation, turbulence or rotational braking; see e.g. the discussion by Balachandran (1995), the study of Talon & Charbonnel (1998), and the recent review by Deliyannis et al. (2000).
Excluding the Li-dip stars, a correlation between Li abundance
and stellar mass is found (see Fig. 6), which
is probably due to an increasing degree of Li depletion as the
outer convection zone deepens with decreasing stellar mass.
The dispersion around the Li-mass relation is, however, much
larger than expected from observational errors and the residuals are
not correlated with stellar age, which for the present sample of stars
ranges from 1.5 Gyr to about 15 Gyr. This suggests that the
main part of Li depletion occurs when the star is young and that
other parameters in addition to stellar mass and metallicity
affect the degree of depletion, e.g. initial rotation velocity,
rate of angular momentum loss or magnetic field strength.
Binarity may also play a role in the degree of Li depletion,
as exemplified by the two "intermediate-mass'' Li-poor stars
HD80218 and HD106516A, and although we have
excluded double-lined spectroscopic binaries from our sample,
a significant fraction of the stars may be binaries with a
low mass component.
Furthermore, it cannot be excluded that
a cosmic scatter of the Li abundance in the Galaxy at a given metallicity
contributes to the dispersion in Li abundance, although we have not
found any correlation between stellar kinematics and Li abundance.
If the upper envelope of the
distribution is assumed to
represent the Galactic evolution of Li, then the Galactic evolutionary
models of Romano et al. (1999) suggest that
novae, massive AGB stars, SNeII and Galactic cosmic rays all
contribute to the production of Li. In particular, novae seem to
provide a major contribution to the Li enrichment and to be
responsible for the steep increase in the Li abundance at
.
It is, however, doubtful if stellar Li abundances along the
upper envelope of the
distribution, based on samples
of long-lived F & G stars in this and other works, really represent
the Galactic evolution of Li given that there may be a dispersion
of Li in the interstellar medium at a given metallicity and that
no stars reach the meteoritic Li abundance at solar metallicity.
To make progress on this problem one will probably need a sample of
stars that is an order of magnitude larger than the present sample.
Furthermore, it would be interesting to observe the spectra of these stars
with higher resolution, say
 ,
and very high S/N
in order to be able to estimate stellar
rotation velocities and magnetic field strengths from the profiles
of Zeeman-insensitive and Zeeman-sensitive spectral lines. This would enable
a study of possible correlations between the degree of Li depletion
and stellar rotation as well as magnetic field strength.
,
and very high S/N
in order to be able to estimate stellar
rotation velocities and magnetic field strengths from the profiles
of Zeeman-insensitive and Zeeman-sensitive spectral lines. This would enable
a study of possible correlations between the degree of Li depletion
and stellar rotation as well as magnetic field strength.
Acknowledgements
This research was supported by the Danish Research Academy, the Danish Daloon Foundation, the Chinese NSF, and NKBRSF G1999075406.
|
STAR |
Teff |
logg |
[Fe/H] |
M_V |
Mass |
Age |
EW |
Li |
|
SUN |
5780 |
4.44 |
0.00 |
4.83 |
1.00 |
4.6 |
<3.0 |
<1.00 |
|
HD 400 |
6122 |
4.13 |
-0.23 |
3.59 |
1.20 |
4.3 |
26.9 |
2.25 |
|
HD 693 |
6163 |
4.11 |
-0.38 |
3.53 |
1.18 |
4.8 |
38.2 |
2.44 |
|
HD 2454 |
6418 |
4.09 |
-0.37 |
3.26 |
1.32 |
3.3: |
<4.0 |
<1.60 |
|
HD 3454 |
6056 |
4.29 |
-0.59 |
4.13 |
0.95 |
9.1 |
58.6 |
2.58 |
|
HD 3567 |
6041 |
4.01 |
-1.20 |
4.07: |
0.82 |
13.7 |
45.4 |
2.40 |
|
HD 4614 |
5806 |
4.33 |
-0.31 |
4.57 |
1.00 |
8.0 |
24.0 |
1.97 |
|
HD 4813 |
6146 |
4.34 |
-0.15 |
4.23 |
1.06 |
3.8 |
71.0 |
2.74 |
|
HD 5750 |
6223 |
4.21 |
-0.44 |
3.86: |
1.05 |
6.0 |
45.7 |
2.56 |
|
HD 6834 |
6295 |
4.12 |
-0.73 |
3.45 |
1.04 |
6.3 |
10.3 |
1.90 |
|
HD 6840 |
5860 |
4.03 |
-0.45 |
3.71: |
1.07 |
7.2 |
65.8 |
2.50 |
|
HD 7439 |
6419 |
4.13 |
-0.32 |
3.21 |
1.33 |
2.8: |
<4.0 |
<1.60 |
|
HD 7476 |
6486 |
3.91 |
-0.24 |
2.49 |
1.42 |
2.6: |
32.8 |
2.58 |
|
HD 9826 |
6110 |
4.13 |
0.09 |
3.48 |
1.33 |
3.3 |
33.9 |
2.35 |
|
HD 10307 |
5776 |
4.13 |
-0.05 |
4.45 |
0.99 |
9.1 |
19.7 |
1.86 |
|
HD 11007 |
6027 |
4.20 |
-0.16 |
3.61 |
1.18 |
4.9 |
51.7 |
2.50 |
|
HD 11592 |
6232 |
4.18 |
-0.41 |
3.66 |
1.10 |
5.5 |
28.0 |
2.33 |
|
HD 13555 |
6366 |
4.03 |
-0.32 |
2.84 |
1.42 |
2.8: |
71.0 |
2.88 |
|
HD 15335 |
5785 |
3.92 |
-0.22 |
3.45 |
1.09 |
7.0 |
57.9 |
2.39 |
|
HD 15798 |
6385 |
3.92 |
-0.25 |
2.68 |
1.40 |
2.8: |
85.1 |
2.99 |
|
HD 16673 |
6170 |
4.35 |
0.02 |
4.13 |
1.16 |
2.2 |
112.8 |
3.01 |
|
HD 16895 |
6219 |
4.27 |
-0.02 |
3.86 |
1.20 |
2.5 |
74.3 |
2.81 |
|
HD 17288 |
5700 |
4.38 |
-0.88 |
5.46: |
0.80 |
|
8.3 |
1.41 |
|
HD 17820 |
5750 |
4.11 |
-0.69 |
4.52: |
0.83 |
16.4 |
5.6 |
1.28 |
|
HD 18768 |
5695 |
3.91 |
-0.62 |
3.40 |
1.09 |
6.8 |
67.7 |
2.43 |
|
HD 19373A |
5867 |
4.01 |
0.03 |
3.94 |
1.09 |
5.7 |
51.2 |
2.38 |
|
HD 22484 |
5915 |
4.03 |
-0.13 |
3.61 |
1.08 |
6.3 |
49.1 |
2.39 |
|
HD 22879 |
5790 |
4.28 |
-0.84 |
4.76 |
0.78 |
18.8 |
7.8 |
1.45 |
|
HD 24339 |
5810 |
4.20 |
-0.67 |
4.43: |
0.86 |
14.4 |
21.9 |
1.94 |
|
HD 24421 |
5986 |
4.10 |
-0.37 |
3.81 |
1.03 |
7.9 |
59.7 |
2.54 |
|
HD 25173 |
5867 |
4.07 |
-0.62 |
3.52 |
0.99 |
7.9 |
63.3 |
2.49 |
|
HD 25457 |
6162 |
4.28 |
-0.11 |
3.95 |
1.16 |
3.5 |
104.5 |
2.95 |
|
HD 25704 |
5765 |
4.12 |
-0.91 |
4.81 |
0.78 |
18.7 |
21.6 |
1.90 |
|
HD 25998 |
6147 |
4.35 |
-0.11 |
3.82 |
1.16 |
4.2 |
85.3 |
2.82 |
|
HD 28620 |
6101 |
4.08 |
-0.52 |
3.61 |
1.09 |
6.1 |
38.2 |
2.40 |
|
HD 30649 |
5695 |
4.24 |
-0.51 |
4.58 |
0.88 |
14.5 |
<2.0 |
<0.80 |
|
HD 33256 |
6385 |
4.10 |
-0.30 |
3.12 |
1.32 |
3.3: |
<3.0 |
<1.40 |
|
HD 33632A |
5962 |
4.30 |
-0.23 |
4.40 |
1.06 |
6.0 |
52.3 |
2.45 |
|
HD 34411A |
5773 |
4.02 |
0.01 |
4.20 |
1.01 |
9.4 |
27.4 |
2.02 |
|
HD 35296A |
6015 |
4.24 |
-0.14 |
4.15 |
1.00 |
7.5 |
106.4 |
2.87 |
|
HD 38393A |
6306 |
4.29 |
-0.07 |
3.83 |
1.21 |
2.6 |
63.5 |
2.79 |
|
HD 39587 |
5805 |
4.29 |
-0.18 |
4.72 |
0.90 |
10.7 |
105.6 |
2.71 |
|
HD 39833 |
5767 |
4.06 |
0.04 |
4.30 |
1.00 |
9.4 |
61.7 |
2.40 |
|
HD 41330 |
5791 |
4.10 |
-0.24 |
4.01 |
0.98 |
9.3 |
21.9 |
1.92 |
|
HD 41640 |
6004 |
4.37 |
-0.62 |
4.58 |
0.95 |
7.2 |
54.7 |
2.51 |
|
HD 43042 |
6485 |
4.27 |
0.04 |
3.58 |
1.30 |
1.1 |
6.0 |
1.82 |
|
HD 43947 |
5859 |
4.23 |
-0.33 |
4.41 |
0.98 |
9.8 |
47.0 |
2.33 |
|
HD 46317 |
6216 |
4.29 |
-0.24 |
3.80 |
1.19 |
3.7 |
56.6 |
2.67 |
|
HD 49732 |
6260 |
4.15 |
-0.70 |
3.73 |
1.04 |
6.3 |
29.7 |
2.37 |
|
HD 51530 |
6017 |
3.91 |
-0.56 |
2.82 |
1.28 |
3.4 |
<3.0 |
<1.20 |
|
HD 54717 |
6350 |
4.26 |
-0.44 |
3.86 |
1.10 |
4.6 |
24.2 |
2.34 |
|
HD 55575 |
5802 |
4.36 |
-0.36 |
4.44 |
1.00 |
10.6 |
13.5 |
1.71 |
|
HD 58551 |
6149 |
4.22 |
-0.54 |
4.09 |
1.04 |
5.9 |
44.0 |
2.49 |
|
HD 58855 |
6286 |
4.31 |
-0.31 |
3.87 |
1.16 |
3.6 |
20.3 |
2.22 |
|
HD 59380 |
6280 |
4.27 |
-0.17 |
3.64 |
1.20 |
4.2 |
18.1 |
2.16 |
|
HD 59984A |
5900 |
4.18 |
-0.71 |
3.55 |
0.99 |
7.8 |
47.3 |
2.36 |
|
HD 60319 |
5867 |
4.24 |
-0.85 |
4.37 |
0.80 |
17.0 |
21.2 |
1.96 |
|
HD 61421 |
6671 |
4.02 |
-0.02 |
2.65 |
1.50 |
2.1: |
<2.0 |
<1.40 |
|
HD 62301 |
5837 |
4.23 |
-0.67 |
4.07 |
0.90 |
12.2 |
26.2 |
2.04 |
|
HD 63077 |
5831 |
4.19 |
-0.78 |
4.45 |
0.80 |
13.6 |
6.1 |
1.37 |
|
HD 63333 |
6057 |
4.23 |
-0.39 |
3.92 |
1.03 |
7.5 |
36.3 |
2.35 |
|
HD 68146A |
6227 |
4.16 |
-0.09 |
3.77 |
1.10 |
4.9 |
38.6 |
2.49 |
|
HD 68284 |
5832 |
3.91 |
-0.56 |
3.41 |
1.09 |
6.4 |
54.4 |
2.39 |
|
HD 69897 |
6243 |
4.28 |
-0.28 |
3.85 |
1.19 |
3.3 |
62.7 |
2.73 |
|
HD 70110 |
5949 |
3.96 |
0.07 |
3.12 |
1.40 |
|
55.8 |
2.48 |
|
HD 72945A |
6202 |
4.18 |
0.00 |
3.83 |
1.20 |
2.8 |
105.9 |
2.99 |
|
HD 74011 |
5693 |
4.05 |
-0.65 |
4.08 |
0.91 |
12.6 |
18.6 |
1.79 |
|
HD 75332 |
6130 |
4.32 |
0.00 |
3.96 |
1.15 |
3.9 |
106.4 |
2.94 |
|
HD 76349 |
6004 |
4.21 |
-0.49 |
3.88 |
1.02 |
8.1 |
46.4 |
2.42 |
|
HD 76932 |
5873 |
4.12 |
-0.91 |
4.17 |
0.87 |
12.5 |
26.0 |
2.06 |
|
HD 78418A |
5625 |
3.98 |
-0.26 |
3.48 |
1.19 |
5.9 |
33.7 |
2.03 |
|
HD 79028 |
5874 |
4.06 |
-0.05 |
3.71 |
0.95 |
7.4 |
76.5 |
2.59 |
|
HD 80218 |
6092 |
4.14 |
-0.28 |
3.65 |
1.18 |
4.9 |
<2.0 |
<1.00 |
|
HD 82328 |
6302 |
3.91 |
-0.20 |
2.53 |
1.40 |
2.8: |
112.5 |
3.10 |
|
HD 83220 |
6470 |
4.06 |
-0.49 |
3.52 |
1.20 |
5.1 |
<3.0 |
<1.50 |
|
HD 86560 |
5845 |
4.13 |
-0.48 |
4.06 |
0.98 |
9.4 |
31.7 |
2.13 |
|
HD 89125A |
6038 |
4.25 |
-0.36 |
4.03 |
1.07 |
6.5 |
40.2 |
2.38 |
|
HD 90839A |
6051 |
4.36 |
-0.18 |
4.30 |
1.03 |
5.2 |
60.5 |
2.59 |
|
HD 91347 |
5808 |
4.35 |
-0.48 |
4.72 |
0.90 |
10.8 |
24.0 |
1.98 |
|
HD 91752 |
6483 |
4.02 |
-0.23 |
2.95 |
1.31 |
2.9: |
<2.0 |
<1.30 |
|
HD 91889A |
6020 |
4.15 |
-0.24 |
3.76 |
1.15 |
5.8 |
44.6 |
2.42 |
|
HD 94280 |
6063 |
4.10 |
0.06 |
3.96 |
1.13 |
4.8 |
52.1 |
2.53 |
|
HD 95128 |
5731 |
4.16 |
-0.12 |
4.31 |
0.92 |
12.1 |
18.0 |
1.79 |
|
HD 95241 |
5808 |
3.91 |
-0.30 |
2.74 |
1.40 |
3.3 |
<1.0 |
<0.50 |
|
HD 97916 |
6445 |
4.16 |
-0.94 |
3.64: |
1.04 |
5.5 |
<5.0 |
<1.50 |
|
HD 99747 |
6631 |
4.12 |
-0.54 |
3.24 |
1.26 |
2.8 |
<5.0 |
<1.80 |
|
HD 100180A |
5866 |
4.12 |
-0.11 |
4.44 |
0.95 |
9.2 |
57.0 |
2.43 |
|
HD 100446 |
5967 |
4.29 |
-0.48 |
4.14 |
0.98 |
8.8 |
29.3 |
2.18 |
|
HD 100563 |
6423 |
4.31 |
-0.02 |
3.65 |
1.27 |
1.6 |
48.6 |
2.72 |
|
HD 101676 |
6102 |
4.09 |
-0.47 |
3.64 |
1.09 |
6.1 |
35.1 |
2.36 |
|
HD 102634 |
6333 |
4.22 |
0.24 |
3.48 |
1.35 |
2.3 |
35.9 |
2.53 |
|
HD 102870 |
6068 |
4.09 |
0.13 |
3.41 |
1.32 |
|
15.3 |
1.96 |
|
HD 103723 |
6062 |
4.33 |
-0.75 |
4.65: |
0.96 |
4.8 |
35.1 |
2.33 |
|
HD 103799 |
6169 |
4.02 |
-0.45 |
3.29 |
1.20 |
4.8 |
21.9 |
2.18 |
|
HD 105004 |
5832 |
4.32 |
-0.78 |
5.56 |
0.90 |
|
21.7 |
1.95 |
|
HD 106038 |
5939 |
4.23 |
-1.33 |
4.98: |
0.70 |
20.7 |
64.1 |
2.51 |
|
HD 106516A |
6135 |
4.34 |
-0.71 |
4.35 |
0.90 |
9.3 |
<2.0 |
<1.10 |
|
HD 107113 |
6373 |
4.07 |
-0.54 |
3.34 |
1.18 |
4.1 |
<4.0 |
<1.50 |
|
HD 108134 |
5761 |
4.17 |
-0.44 |
4.24 |
0.98 |
10.3 |
23.0 |
1.93 |
|
HD 108510 |
5929 |
4.31 |
-0.06 |
4.44 |
1.05 |
5.2 |
48.8 |
2.39 |
|
HD 109303 |
5905 |
4.10 |
-0.61 |
3.55 |
1.00 |
8.4 |
47.3 |
2.37 |
|
HD 109358 |
5750 |
4.30 |
-0.19 |
4.66 |
0.89 |
12.4 |
9.0 |
1.49 |
|
HD 110897 |
5757 |
4.31 |
-0.59 |
4.76 |
0.85 |
14.5 |
23.0 |
1.92 |
|
HD 113679 |
5595 |
3.98 |
-0.71 |
3.75 |
0.95 |
10.4 |
32.9 |
1.99 |
|
HD 114642A |
6355 |
3.91 |
-0.17 |
2.47 |
1.41 |
2.8: |
94.4 |
3.03 |
|
HD 114710A |
5877 |
4.24 |
-0.05 |
4.45 |
0.94 |
9.6 |
66.3 |
2.51 |
|
HD 114762 |
5821 |
4.15 |
-0.74 |
4.26 |
0.88 |
12.9 |
25.1 |
2.01 |
|
HD 114837 |
6241 |
4.18 |
-0.28 |
3.63 |
1.20 |
4.2 |
22.7 |
2.24 |
|
HD 115383A |
5866 |
4.03 |
0.00 |
3.92 |
1.09 |
5.7 |
84.6 |
2.64 |
|
HD 118244 |
6234 |
4.13 |
-0.55 |
3.71 |
1.07 |
5.8 |
16.0 |
2.07 |
|
HD 120162 |
5823 |
4.33 |
-0.73 |
4.75 |
0.84 |
13.5 |
35.0 |
2.16 |
|
HD 120559 |
5405 |
4.40 |
-0.88 |
6.22: |
0.80 |
|
<2.0 |
<1.00 |
|
HD 121004 |
5622 |
4.31 |
-0.71 |
4.72: |
0.80 |
18.3 |
<4.0 |
<1.00 |
|
HD 121560 |
6059 |
4.35 |
-0.38 |
4.24 |
1.00 |
7.1 |
41.1 |
2.40 |
|
HD 124244 |
5853 |
4.11 |
0.05 |
3.57 |
1.19 |
5.8 |
51.9 |
2.37 |
|
HD 126512 |
5714 |
4.02 |
-0.63 |
3.92 |
0.97 |
10.1 |
18.6 |
1.81 |
|
HD 126681 |
5533 |
4.28 |
-1.14 |
5.59: |
0.70 |
17.5 |
14.9 |
1.54 |
|
HD 127334 |
5501 |
4.16 |
0.05 |
4.52 |
0.90 |
15.9 |
16.4 |
1.60 |
|
HD 128167 |
6737 |
4.25 |
-0.41 |
3.53 |
1.30 |
1.0: |
<3.0 |
<1.60 |
|
HD 128385 |
6041 |
4.12 |
-0.33 |
4.26 |
1.06 |
5.5 |
31.0 |
2.26 |
|
HD 130551 |
6274 |
4.19 |
-0.72 |
3.77 |
1.07 |
7.6 |
28.2 |
2.36 |
|
HD 130948 |
5780 |
4.18 |
-0.20 |
4.61 |
0.97 |
10.0 |
103.1 |
2.69 |
|
HD 131117 |
6014 |
4.00 |
0.13 |
3.17 |
1.40 |
|
73.2 |
2.67 |
|
HD 132254 |
6231 |
4.22 |
0.07 |
3.64 |
1.23 |
3.2 |
35.4 |
2.45 |
|
HD 136351 |
6343 |
3.91 |
0.01 |
2.32 |
1.62 |
|
37.6 |
2.56 |
|
HD 139457 |
5941 |
4.06 |
-0.52 |
3.70 |
0.98 |
8.7 |
48.8 |
2.41 |
|
HD 141004 |
5801 |
4.16 |
-0.04 |
4.07 |
1.04 |
8.4 |
23.0 |
1.95 |
|
HD 142373 |
5920 |
4.27 |
-0.39 |
3.61 |
0.96 |
9.7 |
61.5 |
2.51 |
|
HD 142860A |
6227 |
4.18 |
-0.22 |
3.63 |
1.20 |
4.2 |
19.0 |
2.15 |
|
HD 143761 |
5698 |
4.14 |
-0.26 |
4.20 |
0.99 |
11.2 |
6.0 |
1.28 |
|
HD 146099A |
5941 |
4.10 |
-0.61 |
3.57 |
1.00 |
8.1 |
45.5 |
2.37 |
|
HD 146588 |
5895 |
4.29 |
-0.63 |
4.53 |
0.90 |
11.0 |
42.6 |
2.31 |
|
HD 149750 |
5792 |
4.17 |
0.08 |
4.05 |
1.11 |
7.5 |
30.6 |
2.07 |
|
HD 150453 |
6458 |
3.91 |
-0.37 |
2.41 |
1.51 |
2.3: |
32.8 |
2.56 |
|
HD 154417 |
5925 |
4.30 |
-0.04 |
4.47 |
1.05 |
5.0 |
80.5 |
2.65 |
|
HD 155358 |
5818 |
4.09 |
-0.67 |
4.09 |
0.89 |
12.7 |
23.0 |
1.97 |
|
HD 157347 |
5654 |
4.36 |
-0.02 |
4.84 |
1.06 |
7.7 |
<5.0 |
<1.10 |
|
HD 157466 |
5935 |
4.32 |
-0.44 |
4.51 |
0.95 |
8.4 |
46.7 |
2.38 |
|
HD 159332 |
6204 |
3.91 |
-0.23 |
2.82 |
1.29 |
3.3: |
<4.0 |
<1.50 |
|
HD 160291 |
6008 |
4.10 |
-0.53 |
3.78 |
1.04 |
7.5 |
28.4 |
2.20 |
|
HD 162004B |
6059 |
4.12 |
-0.08 |
4.03 |
1.10 |
5.6 |
65.9 |
2.64 |
|
HD 165908 |
6083 |
4.19 |
-0.56 |
3.98 |
1.04 |
6.8 |
38.2 |
2.39 |
|
HD 167588 |
5894 |
4.13 |
-0.33 |
3.45 |
1.18 |
4.9 |
46.5 |
2.35 |
|
HD 168009 |
5719 |
4.08 |
-0.07 |
4.52 |
0.89 |
12.8 |
<4.0 |
<1.10 |
|
HD 168151 |
6529 |
4.15 |
-0.31 |
3.17 |
1.35 |
2.5 |
<2.0 |
<1.40 |
|
HD 170153A |
6034 |
4.28 |
-0.65 |
4.04 |
0.95 |
9.4 |
36.0 |
2.32 |
|
HD 174912 |
5787 |
4.35 |
-0.54 |
4.77 |
0.87 |
13.8 |
32.8 |
2.11 |
|
HD 184601 |
5830 |
4.20 |
-0.81 |
4.48: |
0.80 |
17.1 |
40.7 |
2.24 |
|
HD 186379 |
5816 |
3.99 |
-0.46 |
3.60 |
1.10 |
7.0 |
44.8 |
2.29 |
|
HD 187691 |
6034 |
4.16 |
0.09 |
3.69 |
1.23 |
4.5: |
69.9 |
2.65 |
|
HD 189340 |
5888 |
4.26 |
-0.19 |
3.93 |
0.96 |
9.4 |
46.0 |
2.34 |
|
HD 191862A |
6328 |
4.19 |
-0.27 |
3.61 |
1.15 |
5.9 |
62.9 |
2.79 |
|
HD 198390 |
6339 |
4.20 |
-0.31 |
3.62 |
1.20 |
3.8 |
17.0 |
2.17 |
|
HD 199960 |
5750 |
4.17 |
0.11 |
4.10 |
1.09 |
8.3 |
59.0 |
2.37 |
|
HD 200580 |
5829 |
4.39 |
-0.58 |
3.58 |
0.87 |
13.3 |
22.9 |
1.97 |
|
HD 201891 |
5827 |
4.43 |
-1.04 |
4.64 |
0.70 |
21.7 |
25.5 |
2.01 |
|
HD 203608 |
6109 |
4.34 |
-0.67 |
4.41 |
0.95 |
7.2 |
37.3 |
2.39 |
|
HD 204306 |
5896 |
4.09 |
-0.65 |
3.74 |
0.98 |
8.9 |
44.1 |
2.33 |
|
HD 204363 |
6141 |
4.18 |
-0.49 |
3.89 |
1.06 |
6.3 |
73.3 |
2.75 |
|
HD 206301 |
5682 |
3.98 |
-0.04 |
3.68: |
1.09 |
6.7 |
62.1 |
2.35 |
|
HD 206860 |
5798 |
4.25 |
-0.20 |
4.66 |
0.97 |
9.9 |
109.5 |
2.73 |
|
HD 208906A |
5929 |
4.39 |
-0.73 |
4.62 |
0.83 |
13.6 |
40.7 |
2.31 |
|
HD 209942A |
6022 |
4.25 |
-0.29 |
4.00 |
1.10 |
6.2 |
38.5 |
2.35 |
|
HD 210027A |
6496 |
4.25 |
-0.17 |
3.41 |
1.23 |
2.7 |
72.0 |
2.98 |
|
HD 210752 |
5847 |
4.33 |
-0.68 |
4.56 |
0.85 |
14.0 |
39.0 |
2.23 |
|
HD 212029A |
5875 |
4.36 |
-1.01 |
4.70 |
0.76 |
18.8 |
27.9 |
2.08 |
|
HD 215257 |
5976 |
4.36 |
-0.65 |
4.28 |
0.90 |
11.2 |
38.3 |
2.31 |
|
HD 216385 |
6244 |
3.97 |
-0.25 |
3.02 |
1.29 |
3.3: |
<2.0 |
<1.20 |
|
HD 218470 |
6495 |
4.06 |
-0.13 |
3.04 |
1.32 |
2.6: |
<4.0 |
<1.70 |
|
HD 219476 |
5887 |
3.91 |
-0.59 |
2.78 |
1.27 |
3.4 |
<2.0 |
<0.90 |
|
HD 219623A |
6039 |
4.07 |
0.02 |
4.04 |
1.10 |
5.5 |
68.0 |
2.65 |
|
HD 221377 |
6348 |
3.91 |
-0.96 |
2.80 |
1.13 |
4.5 |
<3.0 |
<1.40 |
|
HD 222368 |
6169 |
4.06 |
-0.17 |
3.43 |
1.15 |
4.8 |
20.8 |
2.16 |
|
HD 241253 |
5830 |
4.23 |
-1.10 |
5.36: |
0.76 |
10.8 |
29.5 |
2.08 |
|
BD-21 3420 |
5858 |
4.25 |
-1.09 |
5.08: |
0.72 |
19.2 |
21.5 |
1.95 |
|
CD-33 3337 |
6022 |
3.99 |
-1.34 |
4.16: |
0.77 |
16.4 |
38.0 |
2.32 |
|
CD-45 3283 |
5650 |
4.50 |
-0.84 |
5.71: |
0.80 |
|
<2.0 |
<0.70 |
|
CD-47 1087 |
5657 |
4.20 |
-0.80 |
5.08: |
0.74 |
22.7 |
5.7 |
1.21 |
|
CD-57 1633 |
5944 |
4.22 |
-0.89 |
5.12: |
0.90 |
|
33.7 |
2.22 |
|
CD-61 0282 |
5772 |
4.20 |
-1.23 |
5.27: |
0.70 |
18.6 |
34.8 |
2.12 |
|
G005-040 |
5737 |
4.02 |
-0.91 |
4.76: |
0.77 |
19.5 |
10.1 |
1.90 |
|
G046-031 |
5907 |
4.18 |
-0.81 |
5.12: |
0.88 |
|
26.8 |
2.09 |
|
G088-040 |
5911 |
4.14 |
-0.83 |
4.60: |
0.83 |
13.8 |
24.6 |
2.06 |
|
G102-020 |
5310 |
4.56 |
-1.09 |
6.00: |
0.70 |
|
7.1 |
1.26 |
|
W7547 |
6272 |
4.03 |
-0.42 |
3.27: |
1.25 |
|
<2.0 |
<1.20 |

 Li line,
and non-LTE Li abundance. For the majority of stars the absolute magnitude
has been derived from Hipparcos parallaxes but in a few cases (marked by
:) a photometric value derived from the c1 index is given.
Most stellar ages have errors of around 20% but those marked with `:' are
more uncertain, and for stars close to the ZAMS no age is given.
Li line,
and non-LTE Li abundance. For the majority of stars the absolute magnitude
has been derived from Hipparcos parallaxes but in a few cases (marked by
:) a photometric value derived from the c1 index is given.
Most stellar ages have errors of around 20% but those marked with `:' are
more uncertain, and for stars close to the ZAMS no age is given.