A&A 371, 445-469 (2001)
DOI: 10.1051/0004-6361:20010352
The new sample of Giant radio sources
I. Radio imaging, optical identification and spectroscopy of selected
candidates
J. Machalski - M. Jamrozy - S. Zola
Astronomical Observatory, Jagellonian University,
ul. Orla 171, 30244 Cracow, Poland
Received 23 January 2001 / Accepted 26 February 2001
Abstract
A new sample of very large angular size radio sources has been
selected from the 1.4 GHz VLA surveys: FIRST and NVSS. This sample will be very
useful for an observational constraint on the time evolution of double radio
sources, especially their size, predicted by numerous analytical models of such
evolution (cf. Introduction). In this paper we present radio and optical data
for a large fraction of the sample sources. They are: high-frequency VLA maps
with very weak radio cores detected, deep optical images showing the identified
faint host galaxies not visible on the DSS images, and optical spectra of the
identified galaxies brighter than about
 mag taken with the
McDonald Observatory 2.1 m telescope.
For 15 galaxies (of which 4 do not belong to the complete sample) the redshift
has been determined. In the result, 44 per cent of galaxies in the complete
sample have redshift data (with one exception all redshifts are less than
0.33), of which 70 per cent have a linear size exceeding 1 Mpc. The photometric
redshift estimates for other 11 galaxies with
 mag (0.3<z<0.5)
predict their sizes much over 1 Mpc.
Key words: galaxies: active - galaxies: distances and redshift -galaxies:
evolution - radio continuum: galaxies
Giant double radio sources with a projected linear extent  Mpc
(if
 and H0=50 km s-1Mpc-1 which we use
hereafter) are the largest objects in the Universe. Since the existing models
of the radio source evolution (e.g. Kaiser et al. 1997;
Kaiser & Alexander 1999; Blundell et al. 1999) predict that
classical double sources grow in size with increasing age, these giants must
represent a very late phase of the evolution of radio sources. In the analytical
model of Kaiser et al. (1997), the range of luminosities and the largest
linear sizes are limited mostly by the jet powers and the different processes
of energy loss. The importance of adiabatic, synchrotron, and inverse Compton
losses in reducing the source luminosity at large life time is so significant
that the largest sources should have very low luminosity, especially at high
observing frequencies. Blundell et al. argue that the samples of FRII sources
are strongly affected by the effect of "youth-redshift degeneracy" causing
the old sources are barely observed at high redshifts.
A natural consequence of these predictions is that the majority of giants have
to be very old. On the other hand, it is not
clear under what circumstances radio sources can live long enough to reach
Mpc-sizes, and what fraction of their population can do that. One
possibility is that the extreme sizes of some sources are related to their
surrounding intergalactic medium. Mack et al. (1998), after the spectral ageing
analysis of 5 giant radio galaxies, found evidence that those giants are so
large because of their low-density environments and not because of higher ages.
Kaiser & Alexander suggested that a few giant sources in the LRL sample
(Laing et al. 1983) may "constitute a class of objects intrinsically
different from the rest of the sample".
It has to be emphasized that all these studies were based on an inhomogenous
collection of currently known giant sources. An ambitious project to select a
uniform and large sample of giant radio sources appropriate for an extensive
study of their population, has been undertaken at Leiden Observatory (e.g.
Schoenmakers et al. 1998). The sample of 33 candidate sources, selected from
the WENSS 325-MHz survey in the sky area of about 2.5 sr (Rengelink et al. 1997),
has been studied by Schoenmakers (1999). These sources supplement a sample of 19
Giants already known in the same sky area.
However, in our contribution during IAU Symposium No. 199 on the population
modelling of giant FRII-type sources, we have presented evidence that only a
very small fraction of expected faint giants (with 1.4 GHz flux density less
than 0.5 Jy) has already been detected. In order to find the missing giant sources
we have selected another sample of faint candidates for which further radio and
optical observations have been done.
In this paper, the first results of (i) the radio imaging with the main effort
to detect a compact radio core in those giant candidates whose cores were not
detected yet, (ii) the follow-up optical identifications, and (iii) the optical
spectroscopy of identified optical counterparts (with the one exception - only
galaxies) are presented. In Sect. 2, the selection criteria and the list of
candidates are given. The new radio observations are described in Sect. 3. The
optical identification, and the deep optical imaging for those candidates whose
optical counterpart is not visible on the POSS plates, are gived in Sect. 4.
Finally, the optical spectroscopy of the identified galaxies bright enough that
their spectrum could be taken with a medium-size telescope are presented in
Sect. 5.
Basic physical parameters have been derived for the sample sources
with spectroscopic redshift including their radio and optical luminosity,
projected linear size, equipartition magnetic field and energy density. A
photometric redshift and size estimates are provided for a few host galaxies
identified in the deep optical images and for which a crude apparent R-band
magnitude has been determined. These results are summarized in Sect. 6.
We decided to select our candidates from the 1.4-GHz sky surveys: NVSS (Condon
et al. 1998) and the first part of FIRST (Becker et al. 1995). These
surveys, which provide radio maps made with two different angular resolutions
(
 and
and
 ,
respectively) at the same observing frequency,
allowed (i) an effective removal of confusing sources, (ii) a reliable
determination of its morphological type, and (iii) a determination of the compact
core component necessary for the proper identification of the source with its
host optical object. From the population modelling (cf. Introduction) we
expected that most missing giants should be below a redshift of about 0.4.
At
 ,
a source with a linear size of 1 Mpc will have an angular
size of 2.6 arcmin. Therefore, we have chosen the following selection criteria:
The radio source
(1) lies within the sky area of 0.47 sr limited by
 and
and
 ,
(2) has a morphological type (suggested from the NVSS and FIRST radio maps, Fanaroff-Riley (1974)) type II (FRII) or FRI/II,
(3) has an angular separation between the brightest regions on the maps
 arcmin, and
(4) has a 1.4 GHz flux density on the NVSS map of
S1.4<500 mJy.
The above criteria were fulfilled by 36 sources listed in Table 1. The entries of
Table 1 are:
Column 1: IAU name at epoch J2000.
Column 2: Fanaroff-Riley morphological type.
Column 3: 1.4 GHz flux density from the NVSS survey.
Column 4: radio spectral index around the frequency of 1.4 GHz specified
as the mean of spectral indices
 and
and
 .
If
a flux density at about 5 GHz is not known, the respective spectral index is given
as
 .
Column 5: angular size in arcsec.
Column 6: information about radio core; "c'' indicates that the core has already been
detected in the FIRST survey, "c'' - that it has been detected in this work.
"c?'' indicates the lack of high-resolution map, but a compact core is very
probable.
Column 7: optical identification; G-galaxy, Q-quasar.
Column 8: R-band apparent magnitude of the identified host object taken
from the reference given in Col. 10. The magnitudes of faint galaxies detected
in this paper (cf. Sect. 4.2 and Table 4) are marked by bold-face.
Column 9: redshift of the host object (galaxy). The redshifts of 5 objects
were available prior to our spectroscopical observations; the relevant references
are given in Col. 10. Redshifts determined in this paper are marked by
bold-face.
Column 10: references to optical type of the identified object and its
magnitude, and to the redshift.
At the bottom of Table 1 we list 4 additional giant candidates which have been
observed spectroscopically though they do not belong to the complete sample.
J1218+5026, taken from the GB/GB2 sample (Machalski 1998), was supposed to be a
very large source; the remaining three (J1018-1240, J1328-0307, and J1457-0613)
are the largest sources among the Las Campanas radio galaxies (cf. Machalski &
Condon 1999).
Notes on individual sources in Table 1:
J0816+3347: Very blue object on the DSS (E = 18.76 mag; O-E = -0.04 mag).
R = (
 )
mag was found in March 4, 2000 (cf. Fig. 3a). A very
certain variability suggests that this object may be a quasar.
J0912+3510: The source was noticed as a giant by Jamrozy & Machalski
(1999) on the basis of a photometric redshift estimate derived for the brightest
galaxy near the midpoint between its radio lobes (marked as galaxy A in Table 4
and in Fig. 2a).
Figure 4b shows the spectrum of galaxy A. On the other hand, the statistical
effect that the radio core is predominantly closer to the brighter radio lobe
(cf. Sect. 6.4) suggests another possible identification with galaxy B.
Unfortunately, no radio core brighter than about 0.1 mJybeam-1 was
detected in spite of two observational attempts (cf. Table 2).
Table 1:
The sample of Giant candidates
|
References: (1) the Digitized Sky Survey (DSS) data base, (2) Cotter et al. (1996),
(3) Hook et al.(1998), (4) Schoenmakers (1999), (5) Machalski & Condon (1999),
(6) this paper.
|
 |
Figure 1a:
8.46-GHz VLA map of the source J0927+3510 with no radio core detected
(white contours) overlayed on 1.4-GHz NVSS map (gray scale). The crosses indicate
positions of the two galaxies given in Table 4 and shown in Fig. 3b |
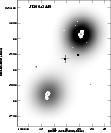 |
Figure 1b:
The same as in Fig. 1a but for the source J1200+3449. The radio core
detected is marked by black contours. The cross indicates position of the
identified galaxy (cf. Table 4) |
 |
Figure 1c:
4.86-GHz VLA map of the source J1254+2933 (white contours) overlayed
on the NVSS map (gray scale). The cross indicates position of the radio core
and the identified galaxy |
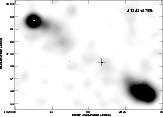 |
Figure 1d:
As in Fig. 1c but for the source J1343+3758 |
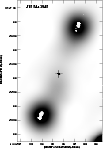 |
Figure 1e:
As in Fig. 1c but for the source J1554+3945 |
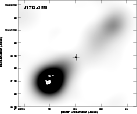 |
Figure 1f:
As in Fig. 1c but for the source J1712+3558 |
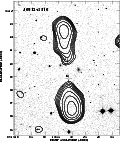 |
Figure 2a:
NVSS contour map of the source J0912+3510 overlayed on the optical
DSS image indicating the galaxies given in Table 4 |
 |
Figure 2b:
NVSS contour map of the source J1253+4041 overlayed on the optical
DSS image indicating the galaxy (cross) whose spectrum in shown in Fig. 4e |
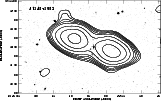 |
Figure 2c:
As in Fig. 2b but for the source J1345+3952. The spectrum of the
galaxy marked with the cross is shown in Fig. 4i |
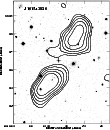 |
Figure 2d:
As in Fig. 2b but for the source J1615+3826. The spectrum of the
galaxy marked with the cross is shown in Fig. 4n |
J0927+3510: The second case where we did not detect the radio core
(cf. Fig. 1a).
Therefore, a probable identification is a galaxy marked as galaxy A in Table 4 and Fig. 3b.
This 20.6 mag galaxy is closer to the brighter eastern lobe of the source, thus
is favoured by the correlation mentioned above. The second possible
identification is the 21.7 mag galaxy B lying close to the midpoint between the radio
lobes (cf. Fig. 3b).
J1330+3850: Because a radio core is unknown yet, the optical identification
remains uncertain. Two possible identifications of a host galaxy are given in
Table 4.
J1343+3758: The radio map with the core indicated is shown in
Fig. 1d. A detailed analysis of this the third largest giant source
known up to now is given by Machalski & Jamrozy (2000). The final corrected
redshift of the identified galaxy is given in this paper.
J1344+4028: A 20 mJy background source at
 ,
,
 (J2000), contaminating the sample source, is
subtracted.
J1555+3653: The sample source is slightly confused on the NVSS map
by the strong steep-spectrum background source 6C155304.9+370235 (B1950).
J1725+3923: Strongly confused by two compact sources at the (J2000)
positions:
 ;
;
 and
and
 ;
;
 ,
hence its
radio spectrum is uncertain.
Eight out of twelve sources with no radio core detected in the FIRST survey have
been observed with the VLA in the B-array at 4.86 GHz and/or BnC-array at
8.46 GHz. The observing log is given in Table 2. In order to reach a rms
noise of about 30 Jybeam-1 the field of view centred at a midpoint
between the lobes was observed for an integration time of at least 40 min.
The interferometric phases were calibrated approximately every 20 min with the
phase calibrator nearest to the observed source. The source 3C 286 served as the
primary flux density calibrator.
The sky coordinates and the integrated flux density of the detected cores are
given in Table 3. The last column of Table 3 gives the ratio of 5-GHz flux
density of the core to 1.4-GHz flux density of the entire source. Unfortunately,
no core brighter than about 0.1 mJybeam-1 was detected in the sources
J0912+3510 and J0927+3510. Dividing the above limit of core flux by the total
flux
of these sources, one can expect their fraction  to be below 0.001.
This is about 2 times less than that of the faintest core detected in already
known giants. Also no core was detected in the source J1513+3841. In this
case, the upper limit of 5 GHz flux density of the core is about 0.25 mJy beam-1.
The high-frequency VLA contour maps for those sources whose extended lobes were
not attenuated too much by the VLA primary beam and/or where some compact structures
reside in the lobes, are presented in Figs. 1a-f. In order to show how these
structures are located inside the extended emission, each contour map is
overlaid onto the relevant NVSS map shown in the gray scale. The compact cores, for
the sake of proper contrast, are shown by the black contours. The crosses
indicate the position of the host galaxy (cf. Sect. 4).
To identify our source candidates whose radio core is known with a host optical
object, first of all we used the "Digitized Sky Survey'' (DSS), i.e. digitized
POSS survey. For 29 sample sources with cores, we have identified their cores
with 13 galaxies and one very blue object, possibly a quasar. This means that
the optical counterpart of one half of our giant candidates is fainter than
 mag. Taking into account the R-band Hubble diagram for 3C radio
galaxies (Eales 1985) and allowing the giant radio galaxies to be one magnitude
less luminous than the 3C ones,
 mag implied a redshift
z>0.4. For four giant candidates without known radio core (J0912+3510,
J1253+4041,
J1345+3952, and J1615+3826) a very probable host galaxy has been determined.
The optical fields, reproduced from the DSS and showing the presumed
identification with the radio contour NVSS map overlayed, are shown in
Figs. 2a-d. The R magnitudes of the identified galaxies from the DSS are listed
in Table 1 with 0.01 precision.
For 9 sky fields containing the sample sources, 6 of which having no radio core
identification in the DSS, deep optical imaging was done with the
2.1 m telescope of the McDonald Observatory (Texas). The observations were made
using the "Imaging Grism Instrument'' (IGI) equipped with aTK4
 CCD detector cooled with liquid nitrogen. IGI allows direct
imaging and spectroscopy with a spatial scale of
 per pixel within
the field of view of about
  arcmin. The sky fields centred on the
radio source were observed through the Cousins R-band filter at zenith angles
providing air masses less than 1.2, most of them being below 1.05. The exposure
times applied ranged from 3 min to 10 min.
Although seeing conditions during the
observing night of March 4/5, 2000 were not photometric ones, also the standard
fields NGC2419, NGC4147, and M 92 (Christian et al. 1985) were observed for
a crude photometric calibration.
The astrometric calibration has been done by transforming the instrumental
pixel coordinates of stars in the investigated frame into their sky coordinates
in the DSS data base. As a result, all six sources with a core have been
identified with faint galaxies. In the two remaining fields, possible galaxy
identifications are found. Instrumental magnitudes of the identified host
galaxies (and several other objects) on the CCD frames, reduced for bias, dark
current and flat field with the ESO MIDAS package, were determined using both
the aperture (MIDAS magnitude/circle procedure) and PSF (DAOPHOT II procedure;
Stetson 1987) methods. These instrumental magnitudes were then transformed into
R magnitudes in the twofold manner: a transformation formula was determined
for (i) those objects in the particular frame whose magnitudes are calibrated in
the DSS (
 ), and (ii) standards in the calibration fields
(
 ). Dispersions of the differences
 and
and
 (the latter calculated from the calibration
fields taken just before and after the target frame) have been used to determine
the combined rms error
 of particular Rmagnitude.
The sky coordinates, radio-minus-optical offsets with respect to the radio core,
and R-magnitude estimate with its rms error of the identified faint galaxies
are listed in Table 4. The CCD R-band frames with the deep identification marked
are shown in Figs. 3a-h.
![\begin{figure}
\par\resizebox{10.5cm}{!}{\includegraphics{H2655F3A.PS}}\hfill
\parbox[]{65mm}{
}
\end{figure}](/articles/aa/full/2001/20/aah2655/Timg44.gif) |
Figure 3a:
Deep R-band image of the optical field around the source J0816+3347.
The host optical object (possibly a quasar) is marked with the cross. The NVSS
contour map is overlayed for a comparison |
![\begin{figure}
\par\resizebox{10.5cm}{!}{\includegraphics{H2655F3B.PS}}\hfill
\parbox[]{65mm}{
}
\end{figure}](/articles/aa/full/2001/20/aah2655/Timg45.gif) |
Figure 3b:
As in Fig. 3a but around the source J0927+3510. The two galaxies listed
in Table 4 are marked with the crosses |
![\begin{figure}
\par\resizebox{10.5cm}{!}{\includegraphics{H2655F3C.PS}}\hfill
\parbox[]{65mm}{
}
\end{figure}](/articles/aa/full/2001/20/aah2655/Timg46.gif) |
Figure 3c:
As in Fig. 3a but around the source J1011+3111. The identified
21.2 mag
galaxy in marked with the cross |
![\begin{figure}
\par\resizebox{10.5cm}{!}{\includegraphics{H2655F3D.PS}}\hfill
\parbox[]{65mm}{
}
\end{figure}](/articles/aa/full/2001/20/aah2655/Timg47.gif) |
Figure 3d:
As in Fig. 3a but around the source J1155+4029. The identified
21.5 mag
galaxy is marked with the cross |
![\begin{figure}
\par\resizebox{10.5cm}{!}{\includegraphics{H2655F3E.PS}}\hfill
\parbox[]{65mm}{
}
\end{figure}](/articles/aa/full/2001/20/aah2655/Timg48.gif) |
Figure 3e:
As in Fig. 3a but around the source J1200+3449. The identified 21.2 mag
galaxy and the radio core (cf. Fig. 1b) are deflected from the axis of radio
cocoon suggested by the NVSS contour map overlayed |
![\begin{figure}
\par\resizebox{10.5cm}{!}{\includegraphics{H2655F3F.PS}}\hfill
\parbox[]{65mm}{
}
\end{figure}](/articles/aa/full/2001/20/aah2655/Timg49.gif) |
Figure 3f:
As in Fig. 3a but around the source J1254+2933. The identified 20.3 mag
galaxy is marked with the cross |
 |
Figure 3g:
As in Fig. 3a but around the source J1355+2923. The identified 20.4 mag
galaxy is marked with the cross |
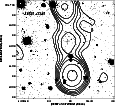 |
Figure 3h:
As in Fig. 3a but around the source J1525+3345. The identified 20.9 mag
galaxy is marked with the cross |
In order to determine redshifts of the identified galaxies brighter than about
18.5 mag in the R band, optical spectroscopic observations were conducted
between Feb. 27 and March 4, 2000. Also these observations were made with the
McDonald Observatory 2.1 m telescope equipped with the IGI instrument. A grism
sensitive to the wavelength range of 3750 Å to 7600 Å, and a
 wide
slit providing a dispersion of 3.7 Å per pixel and spectral resolution of
about 12 Å, were used. A number of exposures ranging from 15 min to 30 min was
taken for 15 galaxies, of which only 11 belonging to the
complete sample were bright enough to be observed with the 2.1 m telescope.
The resulting redshifts have been put in bold face in Table 1. The epoch of observations did not allow us to try to observe
the identified galaxies at RA
 (i.e. J1712+3558 and J1725+3923).
Usually two or three useable exposures were obtained for each galaxy, which
made it possible to improve S/N ratio without an increase of smearing of the spectrum
during a too long single exposure due to imperfect tracking of the telescope.
The total integration time for each spectrum ranged from 30 min for the
brightest galaxy (J1344+4028) to 90 min for the faintest ones.
The wavelength calibration was carried out using exposures to helium and mercury
lamps. The flux calibration was provided by exposures of a spectrophotometric
standard star close to the observed galaxy, chosen from among HZ43, HZ44, EG50,
EG79, GZ140, and Feige98 (Stone 1977).
Table 4:
Data of the identified faint galaxies
 |
All spectra obtained were reduced in the standard way, i.e. corrected for bias,
dark current and flat field, rejected cosmic rays, combined and calibrated using the
LONGSLIT package of the IRAF software. One-dimensional spectra for the
galaxies were extracted interactively, using the observed intensity profile
along the slit to define the apertures and sky-background regions. The final
1-D spectra
of the observed galaxies are shown in Figs. 4a-o. The emission lines and/or
absorption bands detected, as well as the resultant redshift of these features
with its rms error are listed in Table 5.
Most of the spectra are typical of elliptical and lenticular (E, S0) galaxies
whose continuum emission with the prominent 4000 Å discontinuity is dominated
by evolved giant stars (cf. Kennicutt 1992). The emission lines mostly detected
are [OII]
 and [OIII]
 and
and
 .
Also weak
Balmer lines are present in some spectra, however usually only H
 is
detected because the majority of the spectra is redshifted by more than 1.1, so
that in those cases the H
 line was beyond the wavelength range observed.
In a few spectra the blue continuum is strong and suggests the presence of
a young population of stars characteristic for early-type spirals. However
these blue galaxies are too faint to be morphologically classified on the
digitized POSS plates. For four galaxies (J1344+4028,
J1345+3952, J1512+3050, and J1635+3608) their redshift can be determined from
the absorption lines CaII

 and bands G, Mg, and
NaD only.
The global physical parameters estimated for the sources with spectroscopic
redshift are given in Table 6. The twelve columns of Table 6 give:
Column 1: IAU name of source.
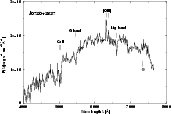 |
Figure 4a:
Optical spectrum of the galaxy identified with the source J0720+2837 |
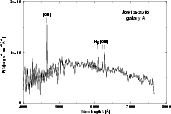 |
Figure 4b:
Optical spectrum of the galaxy A, a possible identification of the
source J0912+3510 |
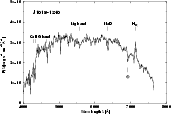 |
Figure 4c:
As in Fig. 4a but for the galaxy identified with the source J1018-1240 |
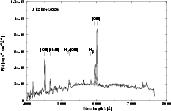 |
Figure 4d:
As in Fig. 4a but for the galaxy identified with the source J1218+5026 |
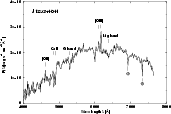 |
Figure 4e:
As in Fig. 4a but for the galaxy likely identified with the source
J1253+4041 |
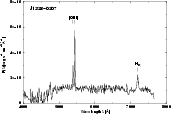 |
Figure 4f:
As in Fig. 4a but for the galaxy identified with the source J1328-0307 |
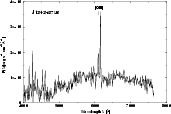 |
Figure 4g:
As in Fig. 4a but for the galaxy identified with the source J1343+3758 |
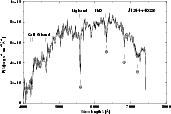 |
Figure 4h:
As in Fig.4a but for the galaxy identified with the source J1344+4028 |
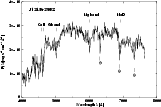 |
Figure 4i:
As in Fig. 4a but for the galaxy likely identified with the source
J1345+3952 |
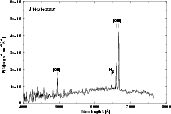 |
Figure 4j:
As in Fig. 4a but for the galaxy identified with the source J1451+3357 |
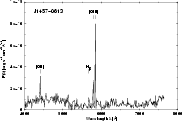 |
Figure 4k:
As in Fig. 4a but for the galaxy identified with the source J1457-0613 |
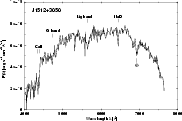 |
Figure 4l:
As in Fig. 4a but for the galaxy identified with the source J1512+3050 |
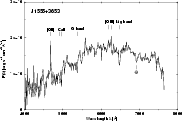 |
Figure 4m:
As in Fig. 4a but for the galaxy identified with the source J1555+3653 |
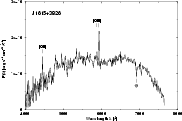 |
Figure 4n:
As in Fig. 4a but for the galaxy likely identified with the source
J1615+3826 |
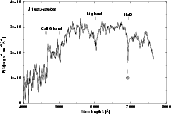 |
Figure 4o:
As in Fig. 4a but for the galaxy identified with the source J1635+3608 |
Column 2: Logarithm of radio luminosity at the emitted frequency of 1.4
GHz (
 )
calculated with the luminosity-distance modulus for
q0=0.5, i.e.
Column 3: Absolute R-band magnitude of the host galaxy calculated
assuming it is an elliptical with an optical spectral index
(
 )
corresponding to the B-R colour and evolving with redshift accordingly the
"c''-model of Bruzual (1983). Thus
No correction for the foreground extinction has been applied because most of the
galaxies have a galactic latitude
 .
Column 4: Logarithm of the radio-optical luminosity ratio parameter
defined by
Column 5: Linear size of source (D), i.e. projected separation between
the hotspots or the brightest regions in opposite radio lobes.
Column 6: Average magnetic field (
 )
calculated under
assumption of energy equipartition, a cylindrical geometry of the extended
emission with the base diameter set equal to the average width of the lobes,
usually measured half-way between the core and their brightest regions, using
the prescription of Leahy & Williams (1984), a filling factor of unity, and
equal distribution of kinetic energy between relativistic electrons and protons.
The total radio luminosity is integrated from 10 MHz to 10 GHz.
Column 7: Minimum energy density (
 )
under the same assumptions.
Column 8: Ratio of the equivalent magnetic field of the microwave
background radiation
 [nT] to the equipartition
magnetic field in the source
 .
Column 9: Ratio of the energy losses by synchrotron radiation to the total
energy losses due to the synchrotron and inverse Compton processes,
 .
Column 10: Ratio of the 1.4 GHz flux densities in two opposite radio lobes,
 .
.
Column 11: Ratio of the radio core separation from the hotspot (or the
brightest region) in the brighter lobe to that from the darker one,
 .
Column 12: Misalignment angle (
 )
between straight lines connecting
the core with the brightest regions in opposite lobes.
The above parameters are not estimated for a few faint sample sources for which
the total luminosity could not be determined because of a practically unknown
radio spectrum. It is worth emphasizing that the parameters in Cols. 6-9 are calculated under assumptions identical to those adopted by
Ishwara-Chandra & Saikia (1999) in their list of previously known giant sources. Thus, the above parameters are homogeneously determined for our
giants and theirs, and can be used for statistical analyses.
As in Machalski & Jamrozy (2000), we have estimated the errors in the determination
of
 ,
,
 ,
,
 ,
and
,
and
 adopting errors of 20 per cent
in the integral radio luminosity, and 50 per cent in the source volume. These
give identical fractional errors for the above values as follows:
 ,
,
 ,
,
 ,
and
,
and
 .
.
The absolute MR magnitude of the galaxies with spectroscopic redshift
varies from -22.0 mag to -25.0 mag (with the exception of J1428+2918 whose
apparent R magnitude may be overestimated). A distribution of the MRvalues in Table 6 has a mean of -23.65 mag and a standard deviation of 0.95
mag. Assuming this mean for the remaining identified galaxies but not observed
spectroscopically (cf. Table 1), one can estimate their redshift, and hence
distance, size, etc. Such estimates of redshift, logarithm of 1.4-GHz
luminosity, logarithm of radio-optical luminosity ratio (logr), and linear
size D for the identified faint galaxies are given in Cols. 2-5
of Table 7. An uncertainty of the above estimates is computed taking into account
the minimal and maximal MR values as -22.0 mag and -25.0 mag. Columns 6-8 of
Table 7 give the measure of asymmetries of the sources as do
Cols. 10-12 of Table 6.
The size estimates of the sources in Table 7 are well above 1 Mpc, strongly
suggesting that all these sources would be giants even if their host galaxy had
the lowest absolute magnitude.
1) The investigated sample is inevitably biased against radio luminosity. The
sources at higher redshifts (or redshift estimates) are evidently more luminous.
This is not the case for the optical absolute magnitude; 11 galaxies with
0.07<z<0.2 in our sample have
 mag,
while 7 galaxies with 0.2<z<0.4 have
 mag. The above parameters produce a spurious correlation between the
radio-optical luminosity ratio (logr) and redshift.
2) The ratio
 for all the giant sources in our sample
reaches the value of about 2 to 6 supporting the thesis that inverse-Compton
losses are a few times larger than synchrotron radiative losses in the time
evolution of the lobes of giant radio sources. Indeed, our limited data confirm
the correlations between the ratio
 and linear size D,
as well as between
 and Dpointed out by Ishwara-Chandra & Saikia.
3) In most of the giant sources in Tables 6 and 7, the brighter lobe is closer
to the host galaxy. This is expected if a source is intrinsically highly
symmetric, its inclination angle from the observer's line of sight differs (but
slightly) from
 ,
and it is at an
age where the luminosity of its lobes is already decreasing. In such cases,
the asymmetries of the lobes in brightness and separation from the nucleus
are generated by the different ages the lobes have in the observer's frame. The lobe
(hotspots) seen as closer to the nucleus has to be younger and brighter than the
farther one.
Acknowledgements
The authors acknowledge (i) the National Radio Astronomy Observatory (Socorro,
NM) for the target-of-opportunity observing time, (ii) the McDonald Observatory
(Mt. Locke, TX) for the observing time, (iii) the National Optical Astronomy
Observatories (Kitt Peak, AZ) for the usage of the IRAF software, (iv) the
Space Telescope Science Institute for the usage of the DSS data base, and
(v) Dr. Luigina Feretti for her constructive remarks improving this paper. This work
was supported in part by the State Committee for Scientific Research
(KBN) under contract PB 0266/PO3/99/17.
-
Blundell, K. M., Rawlings, S., & Willott, C. J. 1999, AJ, 117, 677
In the text
NASA ADS
- Bruzual, A. G. 1983, ApJ, 273, 105
In the text
NASA ADS
- Christian, C. A., Adams, M., Barnes, J. V., et al. 1985, PASP, 97, 363
In the text
NASA ADS
- Condon, J. J., Cotton, W. D., Greisen, E. W., et al. 1998, AJ, 115, 1693 (NVSS)
In the text
NASA ADS
-
Cotter, G., Rawlings, S., & Saunders, R. 1996, MNRAS, 281, 1081
NASA ADS
- Eales, S. A. 1985, MNRAS, 217, 179
In the text
NASA ADS
- Fanaroff, B. L., & Riley, J. M. 1974, MNRAS, 167, 31P
In the text
NASA ADS
-
Hook, I. M., Becker, R. H., McMahon, R. G., & White, R. L. 1998, MNRAS, 297, 1115
NASA ADS
- Ishwara-Chandra, C. H., & Saikia, D. J. 1999, MNRAS, 309, 100
In the text
NASA ADS
- Jamrozy, M., & Machalski, J. 1999, Acta Astr., 49, 181
In the text
NASA ADS
-
Kaiser, C. R., Dennett-Thorpe, J., & Alexander, P. 1997, MNRAS, 292, 723
In the text
NASA ADS
-
Kaiser, C. R., & Alexander, P. 1999, MNRAS, 302, 515
In the text
NASA ADS
- Kennicutt, R. C. 1992, ApJS, 79, 255
In the text
NASA ADS
-
Laing, R. A., Riley, J. M., & Longair, M. S. 1983, MNRAS, 204, 151
In the text
NASA ADS
- Leahy, J. P., & Williams, A. G. 1984, MNRAS, 210, 929
In the text
NASA ADS
-
Machalski, J. 1998, A&AS, 128, 153
In the text
NASA ADS
-
Machalski, J., & Condon, J. J. 1999, ApJS, 123, 41
In the text
NASA ADS
- Machalski, J., & Jamrozy, M. 2000, A&A, 363, L17
NASA ADS
-
Machalski, J., & Jamrozy, M. 2000, in The Universe at low Radio Frequencies, ed. A. P. Rao, ASP Conf. Ser., in press
In the text
-
Mack, K. H., Klein, U., O'Dea, C. P., Willis, A. G., & Saripalli, L. 1998, A&A, 329, 431
In the text
NASA ADS
- Miley, G. K. 1980, ARA&A, 18, 165
NASA ADS
-
Rengelink, R. B., Tang, Y., de Bruyn, A. G., et al. 1997, A&AS, 124, 259
In the text
NASA ADS
-
Schoenmakers, A. P., Mack, K. H., Lara, L., et al. 1998, A&A, 336, 455
In the text
NASA ADS
-
Schoenmakers, A. P. 1999, Ph.D. Thesis, Univ. of Utrecht
In the text
- Stetson, P. B. 1987, PASP, 99, 191
In the text
NASA ADS
- Stone, R. P. S. 1977, ApJ, 218, 767
In the text
NASA ADS
Copyright ESO 2001


![\begin{figure}
\par\resizebox{10.5cm}{!}{\includegraphics{H2655F3A.PS}}\hfill
\parbox[]{65mm}{
}
\end{figure}](/articles/aa/full/2001/20/aah2655/Timg44.gif)
![\begin{figure}
\par\resizebox{10.5cm}{!}{\includegraphics{H2655F3B.PS}}\hfill
\parbox[]{65mm}{
}
\end{figure}](/articles/aa/full/2001/20/aah2655/Timg45.gif)
![\begin{figure}
\par\resizebox{10.5cm}{!}{\includegraphics{H2655F3C.PS}}\hfill
\parbox[]{65mm}{
}
\end{figure}](/articles/aa/full/2001/20/aah2655/Timg46.gif)
![\begin{figure}
\par\resizebox{10.5cm}{!}{\includegraphics{H2655F3D.PS}}\hfill
\parbox[]{65mm}{
}
\end{figure}](/articles/aa/full/2001/20/aah2655/Timg47.gif)
![\begin{figure}
\par\resizebox{10.5cm}{!}{\includegraphics{H2655F3E.PS}}\hfill
\parbox[]{65mm}{
}
\end{figure}](/articles/aa/full/2001/20/aah2655/Timg48.gif)
![\begin{figure}
\par\resizebox{10.5cm}{!}{\includegraphics{H2655F3F.PS}}\hfill
\parbox[]{65mm}{
}
\end{figure}](/articles/aa/full/2001/20/aah2655/Timg49.gif)


![\begin{displaymath}\log L_{\rm opt}[{\rm W\,Hz^{-1}}]=-0.4\,M_{R}+13.522.\end{displaymath}](/articles/aa/full/2001/20/aah2655/img109.gif)