A&A 371, 300-311 (2001)
DOI: 10.1051/0004-6361:20010350
The peculiar supernova remnant CTB 80
F. Mavromatakis 1 - J. Ventura 1,2,3 - E. V. Paleologou 2 - J. Papamastorakis 1,2
1 -
University of Crete, Physics Department, PO Box 2208, 710 03 Heraklion,
Crete, Greece
2 - Foundation for Research and Technology-Hellas, PO Box 1527,
711 10 Heraklion, Crete, Greece
3 - Max Planck Institut für Extraterrestrische Physik,
85741 Garching, Germany
Received 20 September 2000 / Accepted 2 March 2001
Abstract
Deep CCD exposures of the peculiar supernova remnant CTB 80 in the light of the
H N II], [S II], [O II], and [O III] filters have been obtained.
These images reveal significant shock heated emission in the area of the
remnant.
An extended bright diffuse nebula in the south-east part of CTB 80 overlaps
soft X-ray emission from ROSAT but it does not appear to be related to
the remnant under study.
New diffuse and filamentary structures are detected to the south,
south-east, and north of PSR 1951+32, most
likely associated with CTB 80. Especially, the sulfur line image shows
emission in the north along the outer boundary of the IRAS and HI shells.
The [O III] emission is filamentary, suggesting shock velocities
greater than 100 km s-1 but its spatial extent is quite limited.
Lower shock velocities are expected in the north and north-east areas
of the remnant, since [O II] emission is present, while [O III] line
emission is not detected.
The comparison between the [O III] and
[O II] line images further suggest the presence of significant
inhomogeneities in the interstellar medium. The flux-calibrated images
do not indicate the presence of incomplete recombination zones, and we
estimate that the densities of the preshock clouds should not exceed
a few atoms per cm3. The typical projected angular widths of the
observed filaments are
N II], [S II], [O II], and [O III] filters have been obtained.
These images reveal significant shock heated emission in the area of the
remnant.
An extended bright diffuse nebula in the south-east part of CTB 80 overlaps
soft X-ray emission from ROSAT but it does not appear to be related to
the remnant under study.
New diffuse and filamentary structures are detected to the south,
south-east, and north of PSR 1951+32, most
likely associated with CTB 80. Especially, the sulfur line image shows
emission in the north along the outer boundary of the IRAS and HI shells.
The [O III] emission is filamentary, suggesting shock velocities
greater than 100 km s-1 but its spatial extent is quite limited.
Lower shock velocities are expected in the north and north-east areas
of the remnant, since [O II] emission is present, while [O III] line
emission is not detected.
The comparison between the [O III] and
[O II] line images further suggest the presence of significant
inhomogeneities in the interstellar medium. The flux-calibrated images
do not indicate the presence of incomplete recombination zones, and we
estimate that the densities of the preshock clouds should not exceed
a few atoms per cm3. The typical projected angular widths of the
observed filaments are  30
30
 .
Typical surface brightness values of the long [O III] filament in the
south are 12 10-17 erg s-1 cm-2 arcsec-2 while the [O II] image is characterized
by fluxes of 10-20 10-17 erg s-1 cm-2 arcsec-2.
The area covered by the optical radiation along with the radio emission
at 1410 MHz suggest that CTB 80 occupies a larger angular extent than was
previously known.
.
Typical surface brightness values of the long [O III] filament in the
south are 12 10-17 erg s-1 cm-2 arcsec-2 while the [O II] image is characterized
by fluxes of 10-20 10-17 erg s-1 cm-2 arcsec-2.
The area covered by the optical radiation along with the radio emission
at 1410 MHz suggest that CTB 80 occupies a larger angular extent than was
previously known.
Key words: ISM: general - ISM: supernova remnants
- ISM: individual objects: CTB 80
Downes (1970), almost 30 years ago, proposed that the radio
source CTB 80 (G69.0+2.7)
was a supernova remnant. However, confirmation came only in 1974
when observations of total and polarized intensity
of a number of radio sources were performed by Velusamy & Kundu (1974).
The non-thermal emission and the strong polarization of the source
thus offered further support to the initial claim, and
established the source's peculiar radio morphology.
The radio images show the presence of a (1 )
compact central source (spectral index
0.0 for
)
compact central source (spectral index
0.0 for 
 ),
a plateau to the east of the compact core extending for
10
),
a plateau to the east of the compact core extending for
10 6
(spectral index 0.3) and three
large-scale structures extending, roughly, to the north, to the east and to
the south-west (spectral index 0.8, Angerhofer et al. 1981;
Strom & Stappers 2000).
The source, depending upon the frequency of observation, displays
a different morphology, while the polarization is quite strong over
a
large part of the radio emission.
Radio observations in 1984 and 1985 led Strom (1987) to propose that the radio properties of the central compact core
indicated the presence of a central neutron star.
Interest in this source
intensified following the discovery
of a 39.5 ms (105 yr old) radio pulsar at the center of the radio compact core
(Clifton et al. 1987). Shortly after the pulsar discovery,
Fesen et al. (1988) reported the detection of a shell of infrared
emission correlated with the radio lobes of CTB 80.
The IRAS shell centered
6
(spectral index 0.3) and three
large-scale structures extending, roughly, to the north, to the east and to
the south-west (spectral index 0.8, Angerhofer et al. 1981;
Strom & Stappers 2000).
The source, depending upon the frequency of observation, displays
a different morphology, while the polarization is quite strong over
a
large part of the radio emission.
Radio observations in 1984 and 1985 led Strom (1987) to propose that the radio properties of the central compact core
indicated the presence of a central neutron star.
Interest in this source
intensified following the discovery
of a 39.5 ms (105 yr old) radio pulsar at the center of the radio compact core
(Clifton et al. 1987). Shortly after the pulsar discovery,
Fesen et al. (1988) reported the detection of a shell of infrared
emission correlated with the radio lobes of CTB 80.
The IRAS shell centered
 east of the pulsar, and
characterized by a diameter of
1
east of the pulsar, and
characterized by a diameter of
1 ,
is open in the south-west and has a higher surface brightness
in the 60
,
is open in the south-west and has a higher surface brightness
in the 60  m wavelength regime than in the 100 m regime.
These properties
led the authors to suggest that the presumably fast, moving
pulsar caught up with the decelerating supernova shell and, through
the pressure of its relativistic wind broke off the
southwestern portion of the HI shell, deforming the magnetic field structure,
and producing the peculiar south-west protrusion in the radio emission.
This suggestion is further supported by the detection of an
expanding HI shell by Koo et al.(1990). The HI shell is clumpy
(Koo et al. 1993), its south-west part is also open
and is very well
correlated with the infrared shell.
The distance to CTB 80 is approximately 2 kpc, although distances
in the range of 1.5-2.5 kpc cannot be
excluded (Koo et al. 1993; Strom & Stappers 2000).
Major characteristics of the remnant in X-ray wavelengths
are the low count rate, and its small spatial extent
(Wang & Seward 1984; Safi-Harb et al. 1995).
The ROSAT data show that the soft X-ray flux is confined to the area
around the pulsar (11
5)
while the medium and hard X-ray flux show extended emission east, south-east
of the pulsar. The spectrum indicates an average photon power-law
index of 1.8. The column density was not well determined due to the
low X-ray counting statistics and was found to lie in the range of
1021-1022 cm-2(Safi-Harb et al. 1995).
The authors also studied the temporal behavior of the central source and
concluded that the pulsed fraction has a significant dependence on the energy.
m wavelength regime than in the 100 m regime.
These properties
led the authors to suggest that the presumably fast, moving
pulsar caught up with the decelerating supernova shell and, through
the pressure of its relativistic wind broke off the
southwestern portion of the HI shell, deforming the magnetic field structure,
and producing the peculiar south-west protrusion in the radio emission.
This suggestion is further supported by the detection of an
expanding HI shell by Koo et al.(1990). The HI shell is clumpy
(Koo et al. 1993), its south-west part is also open
and is very well
correlated with the infrared shell.
The distance to CTB 80 is approximately 2 kpc, although distances
in the range of 1.5-2.5 kpc cannot be
excluded (Koo et al. 1993; Strom & Stappers 2000).
Major characteristics of the remnant in X-ray wavelengths
are the low count rate, and its small spatial extent
(Wang & Seward 1984; Safi-Harb et al. 1995).
The ROSAT data show that the soft X-ray flux is confined to the area
around the pulsar (11
5)
while the medium and hard X-ray flux show extended emission east, south-east
of the pulsar. The spectrum indicates an average photon power-law
index of 1.8. The column density was not well determined due to the
low X-ray counting statistics and was found to lie in the range of
1021-1022 cm-2(Safi-Harb et al. 1995).
The authors also studied the temporal behavior of the central source and
concluded that the pulsed fraction has a significant dependence on the energy.
Several optical observations have been performed, though
the majority of them have
focused on the area in the immediate neighbourhood of the pulsar
(e.g. Blair et al. 1988; Whitehead et al. 1989;
Hester & Kulkarni 1989). Wide field red plates
taken by van den Bergh (1980) in H and [S II]
showed faint,
patchy nebulosity. Blair et al. (1984) performed
interference filter observations in HN II] of two
30
30
areas located
south-west and north-east of the pulsar. The area
around the pulsar was
also observed in [O III] but no emission was detected apart from the
nebulosity surrounding the pulsar. Spectra taken at two restricted areas in
the south-west and the north-east indicate moderate absorption and
shock heating.
and [S II]
showed faint,
patchy nebulosity. Blair et al. (1984) performed
interference filter observations in HN II] of two
30
30
areas located
south-west and north-east of the pulsar. The area
around the pulsar was
also observed in [O III] but no emission was detected apart from the
nebulosity surrounding the pulsar. Spectra taken at two restricted areas in
the south-west and the north-east indicate moderate absorption and
shock heating.
In this work we present the first comprehensive CCD imaging
in HN II], [S II], [O II] and [O III], of the area around CTB 80, covering a
wide field of 2
2,
at a resolution of
4
-5
.
These new optical images reveal
a rich network of filamentary and diffuse structures
allowing for a better comparison with
existing radio, infrared, and X-ray data.
Information about the observations and the data
reduction is given in Sect. 2,
while in Sect. 3 we describe the
observed morphology in the various filters.
Finally, in Sect. 4 we discuss the physical properties of the remnant,
its positional relation, and interaction with the interstellar medium (ISM).
The optical images of CTB 80 were obtained with the 0.3 m
telescope at Skinakas Observatory. The remnant was observed in July 9,
July 10, and October 13, 1999. Two different CCDs were used during
these observations. The first, was a 1024
1024 Thomson CCD
which resulted in a 69
69
field of view
and an image scale of 4
 12 per pixel.
The second was a 1024
1024 Site CCD which had a larger pixel size
resulting in a 89
89
field of view and an image
scale of 5
21 per pixel. Our aim was to cover the whole field
defined by the faintest radio contours at 1410 MHz (Mantovani et al. 1985). Given the large extent of the remnant,
we performed several
pointings in order to have the best possible coverage of the field. At each
pointing the relevant field was observed for 1800 s at two different
instances, i.e. the total exposure time was 3600 s. Consequently,
overlapping areas have an effective exposure time of 7200 s.
Every field was projected to a common origin before any image
combination. The astrometric solutions were calculated with the aid of the
Hubble Space Telescope Guide Star catalogue.
The characteristics of the interference filters used during the
observations are listed in Table 1.
All coordinates in this work refer to epoch 2000.
12 per pixel.
The second was a 1024
1024 Site CCD which had a larger pixel size
resulting in a 89
89
field of view and an image
scale of 5
21 per pixel. Our aim was to cover the whole field
defined by the faintest radio contours at 1410 MHz (Mantovani et al. 1985). Given the large extent of the remnant,
we performed several
pointings in order to have the best possible coverage of the field. At each
pointing the relevant field was observed for 1800 s at two different
instances, i.e. the total exposure time was 3600 s. Consequently,
overlapping areas have an effective exposure time of 7200 s.
Every field was projected to a common origin before any image
combination. The astrometric solutions were calculated with the aid of the
Hubble Space Telescope Guide Star catalogue.
The characteristics of the interference filters used during the
observations are listed in Table 1.
All coordinates in this work refer to epoch 2000.
Standard IRAF and MIDAS routines were used for the reduction of the data.
Individual frames were bias subtracted and flat-field corrected using
well-exposed twilight flat-fields. The spectrophotometric standard stars
HR 7596, HR 7950, HR 8634,
and HR 718 were used for flux calibration.
 |
Figure 1:
CTB 80 imaged in the HN II] filter.
The image has been smoothed to suppress the residuals from the imperfect
continuum subtraction. Here and in all subsequent figures north is up,
east to the left and the coordinates refer to epoch 2000.
Shadings run linearly from 0.0 to 70 10-17 erg s-1 cm-2 arcsec-2.
The line segments seen near overexposed stars in this figure and the
next figures are due to the blooming effect |
| Open with DEXTER |
 |
Figure 2:
CTB 80 imaged in the [S II] filter.
The image has been smoothed to suppress the residuals from the imperfect
continuum subtraction.
Shadings run linearly from 0.0 to 20 10-17 erg s-1 cm-2 arcsec-2 |
| Open with DEXTER |
The field in the area of CTB 80 contains both filamentary and diffuse
structures. The nebulosity around the pulsar at
 19
19 53
53 and
and  3253
is clearly seen in Fig. 1
as a slightly extended "star-like'' object situated in a
10
3253
is clearly seen in Fig. 1
as a slightly extended "star-like'' object situated in a
10  patch of diffuse HN II] emission.
North of PSR 1951+32, several small scale structures are detected in the
[S II] image (Fig. 2).
They are nicely correlated with the north radio ridge (Fig. 3)
as well as
with the north part of the I(60 m)/I(100 m) map of Fesen et al. (1988, hereafter FSS) while their
relation to the H
emission ([S II] / H
1.0) further
suggests that we observe shocked material
associated with the remnant CTB 80.
To the west of the pulsar and towards the south, we find the known
network of filaments (position I in Fig. 1,
see also Fig. 1a of Blair et al. 1984).
In this area, diffuse emission is seen to the west of the bright filament
at
1951
patch of diffuse HN II] emission.
North of PSR 1951+32, several small scale structures are detected in the
[S II] image (Fig. 2).
They are nicely correlated with the north radio ridge (Fig. 3)
as well as
with the north part of the I(60 m)/I(100 m) map of Fesen et al. (1988, hereafter FSS) while their
relation to the H
emission ([S II] / H
1.0) further
suggests that we observe shocked material
associated with the remnant CTB 80.
To the west of the pulsar and towards the south, we find the known
network of filaments (position I in Fig. 1,
see also Fig. 1a of Blair et al. 1984).
In this area, diffuse emission is seen to the west of the bright filament
at
1951 and
3232
(position II), lying just outside
the faintest radio contours at 1410 MHz (Mantovani et al. 1985).
The typical surface brightness fluxes measured in the HN II] and [S II] images
lie in the range of 30-40 10-17 erg s-1 cm-2 arcsec-2 and 5-12 10-17 erg s-1 cm-2 arcsec-2,
respectively.
South of the radio contours and at positions III and IV two patches
of emission are detected running along the west-east direction at
3210.
Faint emission, at the same declination,
appears to fill the gap between these two locations and might indicate their
physical relation. The optical radiation at location IV displays
filamentary structures of projected widths 10
to 30
.
The structure seems to curve towards the north, north-east. The
overall appearance of these structures in the [S II] image is less
filamentary.
and
3232
(position II), lying just outside
the faintest radio contours at 1410 MHz (Mantovani et al. 1985).
The typical surface brightness fluxes measured in the HN II] and [S II] images
lie in the range of 30-40 10-17 erg s-1 cm-2 arcsec-2 and 5-12 10-17 erg s-1 cm-2 arcsec-2,
respectively.
South of the radio contours and at positions III and IV two patches
of emission are detected running along the west-east direction at
3210.
Faint emission, at the same declination,
appears to fill the gap between these two locations and might indicate their
physical relation. The optical radiation at location IV displays
filamentary structures of projected widths 10
to 30
.
The structure seems to curve towards the north, north-east. The
overall appearance of these structures in the [S II] image is less
filamentary.
The bright diffuse emission to the south-east of position IV occupies
an area of 30
18
and its relation to CTB 80 is not certain. A search in the SIMBAD database around
1955
and
3205
did not reveal
any previously known extended object, although diffuse
emission is seen
in the POSS plates. North of this extended structure, we come across two
elongated structures at positions V and VI (Figs. 1, 2).
The first one
is oriented in the SE to NW direction and is characterized by a length
of 20
and typical thickness of 30
while the
second is oriented along the SW to NE direction and extends for
33.
The thickness of this structure is 1
and its
position coincides with the outer south
part of the
I(60 m)/I(100 m) map of FSS.
The positions of these locations (V and VI)
completely overlap the radio
contours (eastern ridge) at 1410 MHz (Mantovani et al. 1985).
At the NE boundary of the radio contours the known
Lynd's Bright Nebula 156 (Lynds 1965) is found,
which is quite bright in both the HN II] and [S II] filters. Part of LBN 158 is seen to the west of LBN 156 at the west edge
of our field.
Interestingly, at the north end of LBN 156 we see two thin arcs convex
to the west extending further to the north for 38
(location VII). These two arcs have a projected thickness of 30
and cross each other at
195630
and
3350,
while the crossing
area is rather
extended (10
4).
The arcs are also seen in the [S II] image but are less prominent.
 |
Figure 3:
The 49 cm radio contours (Strom & Stappers 2000)
are overlaid to the [S II] image
shown in Fig. 2. The correlation of the small scale structures
in the north is evident. The known filaments in the south-west are also
seen. The radio contours are drawn linearly
from 0.004 to 0.14 Jy/beam |
| Open with DEXTER |
 |
Figure 4:
CTB 80 imaged in the [O III]  5007 Å emission line.
The image has been smoothed to suppress the residuals from the imperfect
continuum subtraction. Shadings run linearly from
0.0 to 10 10-17 erg s-1 cm-2 arcsec-2 5007 Å emission line.
The image has been smoothed to suppress the residuals from the imperfect
continuum subtraction. Shadings run linearly from
0.0 to 10 10-17 erg s-1 cm-2 arcsec-2 |
| Open with DEXTER |
 |
Figure 5:
CTB 80 imaged in the [O II] 3726 and 3729 Å emission lines.
The image has been smoothed to suppress the residuals from the imperfect
continuum subtraction. Shadings run linearly from
0.0 to 24 10-17 erg s-1 cm-2 arcsec-2 |
| Open with DEXTER |
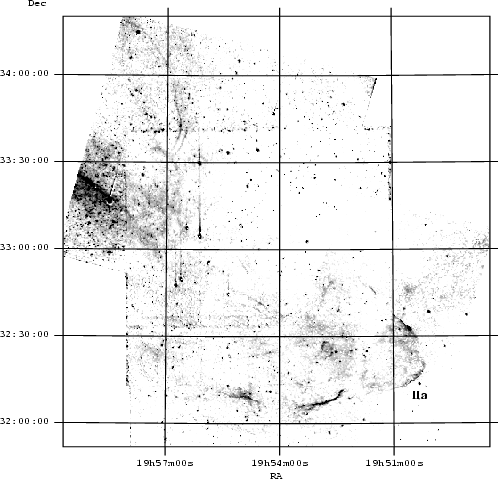
The morphology of the area around CTB 80 in [O III] (see Fig. 4)
is quite different
from that seen in the HN II] and [S II] images.
The field is relatively clean of diffuse, patchy emission while
a few filamentary structures are seen. The first filament
is detected SW of the pulsar and has a length of 3
and a projected thickness of 25
.
It is located at position I where the corresponding HN II] flux is lower
by a factor
of 2 than the flux of the neighbouring filaments.
Blair et al. (1984) did not detect any [O III] emission in their
"SW'' spectrum since it was taken 11
away.
Another [O III] filament which has an HN II] and [S II] counterpart is
located at
195030
and
3234
(our position II, position "SSW'' of Blair et al. 1984).
Around
1950
and
3215
we find a
filament which is 12
long and 40
wide (position
IIa in Fig. 4).
A noteworthy feature of this filament is its location along the outer
radio contours, in the south,
at 1410 MHz (Mantovani et al. 1985). Emission
from the low ionization lines of HN II], [S II] and [O II]
(Figs. 1, 2, 5) is only
partially correlated with this [O III] emission.
To the south of position IV a 17
long [O III] filamentary
structure is detected which has no obvious HN II] counterpart. Its thickness
ranges from 30
-60
.
This structure is 14
away to the
south of the outer 1410 MHz
radio contours.
A peculiar [O III] structure, which has a shape similar to the number "9'',
is found around
1953
and
3230
just inside the outer radio contour at 1410 MHz.
Finally, the last [O III]features present in the field are the arcs to the
north of LBN 156 (position VII).
However, only one of the arcs is seen for
38
while the second one is seen for 10.
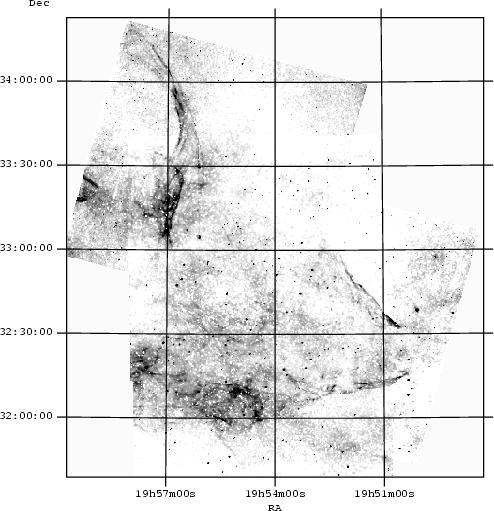
The morphology of the field in [O II] (Fig. 5) is generally
similar to that seen
in HN II] and [S II] but still, important diferences do exist.
Some of the filaments seen in HN II], SW of the pulsar (position I),
have a counterpart
in [O II] while others do not. Furthermore, in the position of an H
filament, in the same area,
we see in the [O II] image localized emission areas scattered
along the general direction of the HN II] filament.
It is interesting to note that the filament seen in [O II] in the south
of position I is better defined than in HN II].
Additionally, we observe that the long [O III] filament (south of position IV)
is seen as a series
of localized emission "hills'' in [O II]. The "valleys'' (gaps)
between the bright "hills'' have
typical lengths of the order of 0.2-0.4 pc.
Also, while we detect [O II] emission
at position IV, there is practically no emission in [O III].
The extended diffuse structure in the south is also visible in [O II]
while to its
north, we observe less structured emission which is partially correlated
with the HN II] emission (positions V and VI).
Finally, the bright nebula LBN 156 and the two arcs in the very north
of our field are present and well correlated with the HN II] and [S II] line
emission. Deep exposures have been obtained from the area east of the two arcs
and the results will be presented elsewhere (Mavromatakis et al. 2000).
An interesting aspect concerning almost all of our line images is that
the filaments in the west and the SW seem to define rather well the two
sides of a triangle much like the shape of any closed, outer contour at 1410 MHz
(Mantovani et al. 1985).
We have analyzed public ASCA data of CTB 80 in order to have an accurate
determination of the column density which would allow us to obtain estimates
of the color excess, E(B-V) and the average ISM density.
An estimate of the color excess is desirable since current measurements
refer to the pulsar neighbourhood (e.g. Hester & Kulkarni 1989)
while away from the pulsar the measurements are less certain
(Blair et al. 1984). Determination of the hydrogen column density
will provide us with an order of magnitude estimate of the
ISM density around CTB 80 which can be compared with our
estimates of the preshock cloud densities.
The source was observed in June 17, 1993 (sequence id 50037010)
by the GIS and SIS detectors onboard the ASCA satellite (Halm 1996).
Applying the strict selection criteria to the original data resulted in
25 ks and 19 ks exposure time for the GIS and SIS detectors, respectively.
The hardness ratios between the 0.8-2.0 keV, 2.0-6.0 keV and the
6.0-12.0 keV bands did not reveal any statistically
significant spectral variations.
Consequently, all photons within a 8
radius from the
center of the GIS intensity distribution were accumulated to create a
source spectrum, while from the SIS data all photons within a rectangular
area of 4
4
were accumulated.
An important point to be mentioned concerns the background
subtraction. The available blank-sky background spectra are obtained from
observations towards high galactic latitudes. However, CTB 80 is only
3
away from the galactic plane, where a different
spectral behavior of the sky background is expected.
We have extracted a few observations
from the ASCA database which were performed in the direction of CTB 80.
The analysis showed that a thermal (
 keV) and a non-thermal
component (
keV) and a non-thermal
component (
 )
could fit the source-free spectra close to
the galactic plane. Subsequently, these components were included in the fits
of the SNR spectra by keeping the temperature and power-law index fixed
at the aforementioned values.
)
could fit the source-free spectra close to
the galactic plane. Subsequently, these components were included in the fits
of the SNR spectra by keeping the temperature and power-law index fixed
at the aforementioned values.
We find that a simple power-model attenuated by
the intervening column density provides a sufficient description of the data.
The photon power-law index is 1.95
+0.15-0.11 and the column
density is 2.9
+0.5-0.5 1021 cm-2. The quoted
errors refer to the 90% probability level for two parameters of
interest (
 = 4.61). In the case where we do not include
the galactic plane background component, we find
a photon power-law index of 1.88
+0.06-0.05 and a column density
of 2.6
+0.3-0.3 1021 cm-2. The two methods provide
results that agree within the statistical errors due to the low counting
statistics of CTB 80. Nevertheless, the contribution of the galactic plane
background
should always be taken into account when analyzing source spectra near the
galactic plane. We note here that our results are in good agreement with the
results reported by Safi-Harb et al. (1995), however, the allowed
range of the parameters is much narrower now.
= 4.61). In the case where we do not include
the galactic plane background component, we find
a photon power-law index of 1.88
+0.06-0.05 and a column density
of 2.6
+0.3-0.3 1021 cm-2. The two methods provide
results that agree within the statistical errors due to the low counting
statistics of CTB 80. Nevertheless, the contribution of the galactic plane
background
should always be taken into account when analyzing source spectra near the
galactic plane. We note here that our results are in good agreement with the
results reported by Safi-Harb et al. (1995), however, the allowed
range of the parameters is much narrower now.
Current measurements of the color excess suggest values in the range of
0.7-1 (e.g. Blair et al. 1984, 1988).
Assuming the relation
 cm-2 mag-1(Ryter et al. 1975), and the best determined
  from the
ASCA data, we derive a color excess of
from the
ASCA data, we derive a color excess of
 mag. Clearly, the
relation used is a statistical relation and deviations of 3-4
mag. Clearly, the
relation used is a statistical relation and deviations of 3-4 could be justified. However, if the observed difference is true, then the
X-ray measured color excess of 0.4 will represent the amount of pure
interstellar extinction. The additional 0.3-0.4 mags of extinction would be
due to local extinction around the core area.
In any case, applying the interstellar reddening curve of Whitford
(1958) as presented by Kaler (1976), an
interstellar extinction c of 0.57 (
could be justified. However, if the observed difference is true, then the
X-ray measured color excess of 0.4 will represent the amount of pure
interstellar extinction. The additional 0.3-0.4 mags of extinction would be
due to local extinction around the core area.
In any case, applying the interstellar reddening curve of Whitford
(1958) as presented by Kaler (1976), an
interstellar extinction c of 0.57 ( 0.15) is obtained.
Finally, the average ISM density towards CTB 80 is
0.5 cm-3, assuming a distance of 2 kpc
(Koo et al. 1993; Strom & Stappers 2000).
0.15) is obtained.
Finally, the average ISM density towards CTB 80 is
0.5 cm-3, assuming a distance of 2 kpc
(Koo et al. 1993; Strom & Stappers 2000).
FSS reported the detection of an infrared emitting shell
in the area of CTB 80. The shell posseses an angular diameter of 1,
is characterized by strong 60 m emission relative to the 100 m
emission and is correlated with the radio emission.
HI observations by Koo et al. (1990) revealed the presence of a clumpy
shell, open in the south-west, expanding at 70 km s-1.
They also estimated a density of the HI medium of 1.7 cm-3.
Subsequent VLA HI observations by Koo et al. (1993) showed that the
clumpy nature of the HI shell is caused by dense, fast moving HI clumps. These
clumps preexisted the supernova explosion and were accelerated by the blast wave.
The two shells (infrared and HI) are very well correlated, suggesting their
association with CTB 80, while the smaller extent of the HI shell is probably due
to the difficulty in distinguishing emission of the low radial
velocity portion of the HI shell from galactic background
emission (Koo et al. 1993).
The optical emission detected north, north-east of the pulsar position
is rather well correlated with the IRAS![[*]](/icons/foot_motif.gif) ratio map of I(60 m)/I(100 m)
of FSS as well as with the HI shell of Koo et al. (1990).
The optical emission in this area lies inside the outer infrared (dashed)
contour and outside the HI (dash-dotted) contour in Fig. 6.
The solid contour corresponds to radio continuum emission at 49 cm
(Strom & Stappers 2000) while the three short lines in the south,
south-west indicate the positions of the prominent [O III] filaments.
As seen from Fig. 6 there is also a good degree of
correlation between HI, infrared and optical emission in the south,
south-east (positions V and VI).
The degree of correlation between the optical and infrared data increases
when we consider the individual IRAS maps of e.g. the 60 m emission.
Optical forbidden line emission at positions IV and V
seem to be related to the 60 m
emission. Based on this positional correspondence between the optical,
HI and infrared emission, and the estimated flux ratio of
[S II]/H
0.7-1.0 (extinction of 0.6 asssumed)
at these areas, it is proposed that the
observed optical emission is indeed
associated with CTB 80.
The filamentary and diffuse structures in locations III, IV, V, and VI
along with LBN 156 may be viewed as forming part of an almost continuous
shell structure. This
adds further support to FSS's previous suggestion that LBN 156 is
also associated with CTB 80.
ratio map of I(60 m)/I(100 m)
of FSS as well as with the HI shell of Koo et al. (1990).
The optical emission in this area lies inside the outer infrared (dashed)
contour and outside the HI (dash-dotted) contour in Fig. 6.
The solid contour corresponds to radio continuum emission at 49 cm
(Strom & Stappers 2000) while the three short lines in the south,
south-west indicate the positions of the prominent [O III] filaments.
As seen from Fig. 6 there is also a good degree of
correlation between HI, infrared and optical emission in the south,
south-east (positions V and VI).
The degree of correlation between the optical and infrared data increases
when we consider the individual IRAS maps of e.g. the 60 m emission.
Optical forbidden line emission at positions IV and V
seem to be related to the 60 m
emission. Based on this positional correspondence between the optical,
HI and infrared emission, and the estimated flux ratio of
[S II]/H
0.7-1.0 (extinction of 0.6 asssumed)
at these areas, it is proposed that the
observed optical emission is indeed
associated with CTB 80.
The filamentary and diffuse structures in locations III, IV, V, and VI
along with LBN 156 may be viewed as forming part of an almost continuous
shell structure. This
adds further support to FSS's previous suggestion that LBN 156 is
also associated with CTB 80.
 |
Figure 6:
CTB 80 imaged in the [S II] filter as a grey scale representation.
The solid line outlines the 49 cm radio emission and the arrow points to
the pulsar location. The dashed line delineates the infrared shell while the
dash-dotted line delineates the HI shell. The short lines in the south
labeled as [O III]a, b, c indicate the locations of [O III] filaments
|
| Open with DEXTER |
The calibrated flux images at positions I and II (Fig. 1)
do not provide any strong evidence for incomplete
recombination zones. The estimated values of [O III]/H are found in the range of 1-3 while a value of 7 (the minimum
extinction of 0.6 was assumed) is obtained
at position IIa (Fig. 4). Raymond et al. (1988)
report a maximum ratio of 6 for complete shock structures and shock
velocities between 80 and 140 km s-1. Since we are dealing most likely
with complete shocks, the results of
Cox & Raymond (1985) and Raymond et al. (1988) can be used
to infer some basic shock properties. The presence of faint
[O III] emission (6 10-17 erg s-1 cm-2 arcsec-2) together with the high values
of the [O II]/[O III] ratio (>3-8, extinction of 0.6 asssumed)
suggest shock velocities between
85 and 120 km s-1, and most probably towards the high end of this range.
Since the column density of a fully developed
flow, roughly, scales as 10
are found in the range of 1-3 while a value of 7 (the minimum
extinction of 0.6 was assumed) is obtained
at position IIa (Fig. 4). Raymond et al. (1988)
report a maximum ratio of 6 for complete shock structures and shock
velocities between 80 and 140 km s-1. Since we are dealing most likely
with complete shocks, the results of
Cox & Raymond (1985) and Raymond et al. (1988) can be used
to infer some basic shock properties. The presence of faint
[O III] emission (6 10-17 erg s-1 cm-2 arcsec-2) together with the high values
of the [O II]/[O III] ratio (>3-8, extinction of 0.6 asssumed)
suggest shock velocities between
85 and 120 km s-1, and most probably towards the high end of this range.
Since the column density of a fully developed
flow, roughly, scales as 10

 cm-2(Raymond et al. 1988), where
 denotes the shock velocity in units of 100 km s-1,
we can set upper limits to the preshock cloud density.
The column density is
denotes the shock velocity in units of 100 km s-1,
we can set upper limits to the preshock cloud density.
The column density is
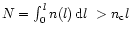 ,
where l is the
projected thickness of a filament and
,
where l is the
projected thickness of a filament and  the preshock cloud density.
A typical thickness of a filament at positions I and II is 9 1017 cm for a distance of 2 kpc
(Koo et al. 1993; Strom & Stappers 2000),
thus we obtain
the preshock cloud density.
A typical thickness of a filament at positions I and II is 9 1017 cm for a distance of 2 kpc
(Koo et al. 1993; Strom & Stappers 2000),
thus we obtain
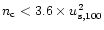 cm-3.
For shock velocities in the range of 85 and 120 km s-1, we get
< 2.6 cm-3 and 5.2 cm-3, respectively.
cm-3.
For shock velocities in the range of 85 and 120 km s-1, we get
< 2.6 cm-3 and 5.2 cm-3, respectively.
In neighbouring locations around positions I and II possible [O III] emission is
below our detection limit while [O II] emission is detected well above the
sky background. Since these two lines originate from the same element, it
is rather likely that the shock velocity is less than 100 km s-1.
In this case, the upper limit to the preshock cloud density
becomes 3.6 cm-3. A possible explanation for the lower shock velocities
could involve higher cloud densities by factors of 1.5-2.0 than the
cloud densities where both [O II] and [O III] are detected.
A different situation seems to hold for the [O III] filament at position IIa.
It is partially correlated with [O II] emission while the degree of correlation
is even smaller when the HN II] and [S II] images are examined.
These morphological differences suggest the presence of
inhomogeneities in the preshock medium. The low ionization lines are
produced in areas of lower temperatures while the [O III] line
emerges from higher temperature regions.
The less hot areas are found at larger distances behind the shock front
and consequently, at higher column densities.
Inhomogeneities in the preshock clouds would mainly affect regions of
higher column densities. At the same time, preshock cloud density
variations would also affect the recombination zone through their effect
on the cooling and recombination time scales (see Hester 1987 for
more details).
In the south and close to position IV, a long [O III] filament
is detected. Typical surface brightness values are of the order of
12 10-17 erg s-1 cm-2 arcsec-2. The same spatial location in the [O II] image
looks completely different where small size patches (50
30
)
of emitting material are seen, instead of a well defined filament.
According to Cox & Raymond (1985) shock velocities greater
than 100 km s-1 would be required to give rise to the
observed [O II] and [O III] fluxes.
Inhomogeneities and preshock density variations are probably the cause of the
observed differences in morphology. The CCD images suggest angular
length scales of 25
of these irregularities.
An important issue
related to the presence of this filament is whether or not it is
associated with CTB 80. Even though, a negative correlation can not be formally
excluded, a positive correlation may be more favorable given the shape,
the spatial location and emission characteristics of this [O III] filament.
In addition, we note that this filament is located along the outer boundary
of a region of relatively strong 60 m emission seen in the IRAS maps
(Wheelock et al. 1994).
A positive indentification would imply a larger extent than
currently assumed and, consequently, a larger shock radius.
New, more sensitive radio observations at 1410 MHz would help to
clarify this issue.
The east, south-east area of CTB 80 shows mainly diffuse optical radiation,
even though a few filamentary structures are present. These are characterized
by lengths of 60
-110
and projected widths of
20
.
Assuming complete shock structures, shock velocities less
than 100 km s-1 and a distance of 2 kpc (Koo et al. 1993;
Strom & Stappers 2000),
we find that the preshock
cloud densities
should satisfy
 cm-3.
Such shock velocities may be expected, according to the calculations
of Cox & Raymond (1985), since associated [O III] emission is not
detected, while in one location (
= 195535
and
= 323303
)
[O II] is also detected well above the
sky background.
Safi-Harb et al. (1995) analyzed ROSAT PSPC and HRI data taken from
the field of CTB 80. The PSPC data show the presence of four extended irregular
structures in the south-east apart from the emission observed around the
pulsar. The whole enhancement is described as the cone-like feature
by Safi-Harb et al. (1995) and includes an elongated structure
along the outer boundary of the PSPC in the south-east.
The cone-like feature
overlaps the optical emission at positions V and VI and the elongated
structure partially overlaps the bright diffuse emission south of position IV.
Given the strong sulfur line emission observed from this bright diffuse
structure, it would be interesting to see if future radio observations
would detect a thermal or non-thermal spectrum.
However, at the moment, no firm conclusions can be drawn about the
correlation between the optical and X-ray data.
Although shell-like structures have been seen in HI, the infrared, and now
in the optical, CTB 80 is not a common shell SNR. There is substantial
and multifaceted evidence that PSR 1951+32 has strongly interacted
with and altered the remnant as is evident from its unusual radio
appearance. It is necessary to proceed with care in attempting to
reconstruct its evolution. As noted earlier (Sect. 4.2) the optical
observations appear to support the suggestion of FSS and Koo et al. (1990) of a breakout of the SN shell south west of the pulsar,
presumably through the action of a strong particle and electromagnetic
wind, which has deformed the shell's magnetic field, and has given rise
to the south western radio emission ridge.
cm-3.
Such shock velocities may be expected, according to the calculations
of Cox & Raymond (1985), since associated [O III] emission is not
detected, while in one location (
= 195535
and
= 323303
)
[O II] is also detected well above the
sky background.
Safi-Harb et al. (1995) analyzed ROSAT PSPC and HRI data taken from
the field of CTB 80. The PSPC data show the presence of four extended irregular
structures in the south-east apart from the emission observed around the
pulsar. The whole enhancement is described as the cone-like feature
by Safi-Harb et al. (1995) and includes an elongated structure
along the outer boundary of the PSPC in the south-east.
The cone-like feature
overlaps the optical emission at positions V and VI and the elongated
structure partially overlaps the bright diffuse emission south of position IV.
Given the strong sulfur line emission observed from this bright diffuse
structure, it would be interesting to see if future radio observations
would detect a thermal or non-thermal spectrum.
However, at the moment, no firm conclusions can be drawn about the
correlation between the optical and X-ray data.
Although shell-like structures have been seen in HI, the infrared, and now
in the optical, CTB 80 is not a common shell SNR. There is substantial
and multifaceted evidence that PSR 1951+32 has strongly interacted
with and altered the remnant as is evident from its unusual radio
appearance. It is necessary to proceed with care in attempting to
reconstruct its evolution. As noted earlier (Sect. 4.2) the optical
observations appear to support the suggestion of FSS and Koo et al. (1990) of a breakout of the SN shell south west of the pulsar,
presumably through the action of a strong particle and electromagnetic
wind, which has deformed the shell's magnetic field, and has given rise
to the south western radio emission ridge.
The radio images at 1410 MHz and 1720 MHz show that faint emission extends
for more than 1
 5 in the north-south and west-east directions.
The optical data span from 32
2 to 33
5 in declination,
while the span in right ascension is somewhat smaller.
The new optical emission features detected in the south, south-east
(positions IV, V and VI) seem to define an extended emission arc of large
curvature, while the optical features detected in the north delinetate an
emission arc of smaller curvature.
This apparent discrepancy could be reconciled if we adopt
the evolutionary scenario of CTB 80 proposed by Koo et al. (1993).
According to this scenario, soon after the supernova explosion (2000 yr)
the blast wave broke out into a cavity in the south-east, while in the north,
north-west the shock front propagated into a denser but clumpy interstellar
medium.
The pulsar was born with a westward velocity, and caught up the slower
expanding shell after 105 yr. Consequently, the optical structures
at positions III, IV and VI may roughly define the south, south-east boundaries
of a cavity seen in the HI data, while the structure at position V may be
projected into the cavity area, or else be related to the cavity's
foreground edge.
5 in the north-south and west-east directions.
The optical data span from 32
2 to 33
5 in declination,
while the span in right ascension is somewhat smaller.
The new optical emission features detected in the south, south-east
(positions IV, V and VI) seem to define an extended emission arc of large
curvature, while the optical features detected in the north delinetate an
emission arc of smaller curvature.
This apparent discrepancy could be reconciled if we adopt
the evolutionary scenario of CTB 80 proposed by Koo et al. (1993).
According to this scenario, soon after the supernova explosion (2000 yr)
the blast wave broke out into a cavity in the south-east, while in the north,
north-west the shock front propagated into a denser but clumpy interstellar
medium.
The pulsar was born with a westward velocity, and caught up the slower
expanding shell after 105 yr. Consequently, the optical structures
at positions III, IV and VI may roughly define the south, south-east boundaries
of a cavity seen in the HI data, while the structure at position V may be
projected into the cavity area, or else be related to the cavity's
foreground edge.
If this interpretation is correct, then the
optical data suggest that the cavity must extend from declination
3310
to 3210.
The correlation between the enhanced IRAS emission along the east cavity
wall, and the optical radiation may suggest that the shock front encountered
a dense medium. Note here that diffuse X-ray emission is mainly detected
in this area (Safi-Harb et al. 1995) which may tie in with the
presence of the HI cavity permeated by hot, low density gas
(Koo et al. 1993).
The secondary shock driven into these dense clouds
allowed the production of H,
[N II], and [S II] radiation but its velocity
was not high enough to allow for the production of [O III] radiation, i.e.
the shock velocity is probably less than 70 km s-1
(Cox & Raymond 1985;
Hartigan et al. 1987). However, [O III] filamentary emission
(positions I, II, IIa, and III) is clearly detected in the south,
south-west (Figs. 4 and 6). Consequently,
shock velocities greater than 80 km s-1 are expected in these locations
according to the calculations of Cox & Raymond (1985).
These areas are found to the south of the dense HI cloud detected by
Koo et al. (1993) where the IRAS and HI emission is weak (FSS,
Koo et al. 1990).
The presence of shock heated filaments at positions I and II suggests
that the injection of pulsar-generated relativistic particles
(FSS) has a strong impact on the "break-out'' portion of the remnant's
south western segment which may have been compressed westward,
possibly against preexisting "clouds''.
The rich network of filaments seen in the low ionization lines and
the spatially limited but filamentary [O III] emission (positions I and II) on
the leading edge of the south-west radio ridge indicate different
shock velocities as well as inhomegenities in the interstellar medium (see
also Koo et al. 1993).
Summarizing, we can propose the following.
The optically emitting gas detected in the north in the [S II] filter
delineates a circular structure which is very well correlated with the
radio, infrared and HI radiation.
The north part of the emission corresponds to the
undisturbed part of the shock while in the south-east the
accelerated shock front has reached the oposite walls of the HI cavity.
The shock velocity into the cavity walls was sufficiently low not to
allow for the production of [O III] emission while faster shocks have
propagated towards the south, south-west. The pulsar relativistic wind
interacts with the preexisting clouds, giving rise to a complex network
of filaments along the south-west radio ridge.
A 22
area around the pulsar PSR 1951+32 was
observed in HN II], [S II], [O III] and [O II].
The low ionization line images of [S II] and [O II] show significant emission
not before detected at locations in the south and south-east.
The [S II] image also shows emission north of the pulsar, clearly, tracing
the infrared shell and the north radio ridge.
The morphology of the HN II] and [S II] images is similar.
The [O III] image appears rather faint in relation to the images in the lower
ionization lines, probably reflecting the remnant's advanced age and low
expansion velocity.
The differences between the oxygen line images and the morphologies seen
in the lower ionization images suggest the existence of density variations
and inhomogenities in the preshock interstellar medium. Rough upper limits
to the preshock density of the interstellar clouds are of the order of a
few atoms per cm3 while the ASCA X-ray data suggest an average insterstellar
medium density of 0.5 cm-3. Based on our upper limits, it is estimated that the
density contrast between the ISM clouds and the ISM medium is less than
5.
The absence of radio emission from the main body of the infrared
and HI expanding shells is conspicuous and surprising, especially
as these shells are reported to be very massive
(Koo et al. 1990, 1993).
The area covered by the 1410 MHz radio emission and the optical
radiation detected in the south and south-east indicate
that the accelerated shock front has traversed the HI cavity
and is interacting with its walls.
More sensitive radio observations at 1410 MHz would be required to
establish the relation of the optical structures in the south of
CTB 80, and the actual size of the remnant which is a crucial parameter
for the further modeling of this remnant.
An extended diffuse structure is detected in the south-east
well away from the faintest radio contours which overlaps soft X-ray emission
detected by ROSAT. Radio observations would be required to establish the
nature of this structure.
Acknowledgements
It is a pleasure to thank R. G. Strom for his comments and for
providing the 49 cm radio data.
We are further indebted to the referee whose pertinent remarks helped
clarify, and enhance the scope of this paper.
Skinakas Observatory is a collaborative project of the University of
Crete, the Foundation for Research and Technology-Hellas and
the Max-Planck-Institut für Extraterrestrische Physik.
This work has been supported by a P.EN.E.D. program of the General
Secretariat of Research and Technology of Greece.
J.V. acknowledges support through an Alexander von Humboldt Fellowship.
This research has made use of data obtained through the High Energy
Astrophysics Science Archive Research Center Online Service,
provided by the NASA/Goddard Space Flight Center.
- Angerhofer, P. E., Strom, R. G.,
Velusamy, T., &
Kundu, M. R. 1981, A&A, 94, 313
In the text
NASA ADS
- van den Bergh, S. 1980, PASP, 92, 768
In the text
NASA ADS
- Blair, W. P., Kirshner, R. P., Fesen, R. A.,
& Gull, T. R. 1984, ApJ, 282, 161
In the text
NASA ADS
- Blair, W. P., Fesen, R. A., & Becker, R. H. 1988,
AJ, 96, 1011
In the text
NASA ADS
- Cioffi, D. F., McKee, C. F., & Bertschinger, E.
1988, ApJ, 334, 252
NASA ADS
- Clifton, T. R., Backer, D. C., Foster, R. S.,
et al. 1987, IAU Circ., No. 4422
In the text
- Cox, D. P., & Raymond, J. C. 1985,
ApJ, 298, 651
In the text
NASA ADS
- Downes, D. 1970, Ph.D. Thesis, Harvard University
In the text
- Fesen, R. A., Shull, J. M., & Saken, J. M. 1988,
Nature, 334, 229
In the text
NASA ADS
- Halm, I. 1996, MPE report 263,
ed. H. U. Zimmerman, J. Trümper, & H. Yorke
In the text
- Hartigan, P., Raymond, J., &
Hartmann, L. 1987, ApJ, 316, 323
In the text
NASA ADS
- Hester, J. J. 1987,
ApJ, 314, 187
In the text
NASA ADS
- Hester, J. J., & Kulkarni, S. R. 1989, ApJ, 340, 362
In the text
NASA ADS
- Kaler, J. B. 1976,
ApJS, 31, 517
In the text
NASA ADS
- Koo, B. C., Yun, M. S., Ho, P. T., & Lee, Y. 1993,
ApJ, 417, 196
In the text
NASA ADS
- Koo, B. C., Reach, W. T., Heiles, C., Fesen, R. A.,
& Shull, M. 1990, ApJ, 364, 178
In the text
NASA ADS
- Lynds, B. T. 1965, ApJS, 12, 163
In the text
NASA ADS
- Maciejewski, W., & Cox, D. P. 1999,
ApJ, 511, 972
- Mantovani, F., Reich, W., Salter, C. J.,
& Tomasi, P. 1985, A&A, 145, 50
In the text
NASA ADS
- Mavromatakis, et al. 2000, under preparation
In the text
- Raymond, J. C., Hester, J. J.,
Cox, D., et al. 1988,
ApJ, 324, 869
In the text
NASA ADS
- Raymond, J. C. 1979, ApJS, 39, 1
NASA ADS
- Ryter, C., Cesarsky, C. J., & Audouze, J. 1975,
ApJ, 198, 103
In the text
NASA ADS
- Safi-Harb, S., Ögelman, H., & Finley, J.
1995, ApJ, 439, 722
In the text
NASA ADS
- Strom, R. G. 1987, ApJ, 310, L103
In the text
- Strom, R. G., & Stappers, B. W. 2000,
Pulsar Astronomy - 2000 and Beyond, ed. M.
Kramer, N. Wex, & R. Wielebinski
In the text
- Wang, Z. R., & Seward, F. D. 1984,
ApJ, 285, 607
In the text
NASA ADS
- Wheelock, S. L., Gautier, T. N., Chillemi, J.,
et al. 1994, IRAS sky survey atlas, Explanatory supplement
In the text
- Whitehead, M. J., Meaburn, J., & Clayton, C. A. 1989,
MNRAS, 237, 1109
In the text
NASA ADS
- Whitford, A. 1958, AJ, 63, 201
In the text
NASA ADS
- Velusamy, T., & Kundu, M. R. 1974, A&A, 32, 375
In the text
NASA ADS
Copyright ESO 2001


 Wavelength at peak transmission for f/3.2.
 Contributions from
  Contributions from
  Contributions from

 3726, 3729 Å