in astrophysical environments
A&A 370, 1030-1043 (2001)
DOI: 10.1051/0004-6361:20010242
S. Hony1 - C. Van Kerckhoven2 - E. Peeters3,4 - A. G. G. M. Tielens3,4 - D. M. Hudgins5 - L. J. Allamandola5
1 - Astronomical Institute `Anton Pannekoek',
Kruislaan 403, 1098 SJ Amsterdam, The Netherlands
2 -
Instituut voor Sterrenkunde, K. U. Leuven,
Celestijnenlaan 200B, 3001 Heverlee, Belgium
3 -
SRON Laboratory for Space Research Groningen,
PO Box 800, 9700 AV Groningen, The Netherlands
4 -
Kapteyn Astronomical Institute PO Box 800, 9700 AV
Groningen, The Netherlands
5 -
NASA/Ames Research Center, MS:245-6, Moffett Field, CA
94035-1000, USA
Received 2 August 2000 / Accepted 12 February 2001
Abstract
We present 10-15 ![]() m spectra of a sample of H II
regions, YSOs and evolved stars that show strong unidentified
infrared emission features, obtained with the ISO/SWS spectrograph
on-board ISO. These spectra reveal a plethora of emission features
with bands at 11.0, 11.2, 12.0, 12.7, 13.5 and 14.2
m spectra of a sample of H II
regions, YSOs and evolved stars that show strong unidentified
infrared emission features, obtained with the ISO/SWS spectrograph
on-board ISO. These spectra reveal a plethora of emission features
with bands at 11.0, 11.2, 12.0, 12.7, 13.5 and 14.2 ![]() m. These
features are observed to vary considerably in relative strength to
each-other from source to source. In particular, the 10-15
m. These
features are observed to vary considerably in relative strength to
each-other from source to source. In particular, the 10-15 ![]() m
spectra of the evolved stars are dominated by the 11.2
m
spectra of the evolved stars are dominated by the 11.2 ![]() m band
while for H II regions the 12.7 is typically as strong as the
11.2
m band
while for H II regions the 12.7 is typically as strong as the
11.2 ![]() m band. Analysing the ISO data we find a good correlation
between the 11.2
m band. Analysing the ISO data we find a good correlation
between the 11.2 ![]() m band and the 3.3
m band and the 3.3 ![]() m band, and between
the 12.7
m band, and between
the 12.7 ![]() m and the 6.2
m and the 6.2 ![]() m band. There is also a correlation
between the ratio of the UIR bands to the total dust emission and
the 12.7 over 11.2
m band. There is also a correlation
between the ratio of the UIR bands to the total dust emission and
the 12.7 over 11.2 ![]() m ratio. Bands in the 10-15
m ratio. Bands in the 10-15 ![]() m
spectral region are due to CH out-of-plane (OOP) bending modes of
polycyclic aromatic hydrocarbons (PAHs). We summarise existing
laboratory data and theoretical quantum chemical calculations of
these modes for neutral and cationic PAHs. Due to mode coupling,
the exact peak position of these bands depends on the number of
adjacent CH groups and hence the observed interstellar 10-15
m
spectral region are due to CH out-of-plane (OOP) bending modes of
polycyclic aromatic hydrocarbons (PAHs). We summarise existing
laboratory data and theoretical quantum chemical calculations of
these modes for neutral and cationic PAHs. Due to mode coupling,
the exact peak position of these bands depends on the number of
adjacent CH groups and hence the observed interstellar 10-15
![]() m spectra can be used to determine the molecular structure of
the interstellar PAHs emitting in the different regions. We conclude
that evolved stars predominantly inject compact 100-200 C-atom
PAHs into the ISM where they are subsequently processed, resulting
in more open and uneven PAH structures.
m spectra can be used to determine the molecular structure of
the interstellar PAHs emitting in the different regions. We conclude
that evolved stars predominantly inject compact 100-200 C-atom
PAHs into the ISM where they are subsequently processed, resulting
in more open and uneven PAH structures.
Key words: circumstellar matter - stars: pre-main sequence - H II regions - ISM: molecules; - planetary nebulae: general - infrared: ISM: lines and bands
Laboratory spectroscopy of PAHs shows that, besides the well known UIR
bands, PAHs exhibit many weaker emission bands. In particular, the
region from 10 to 15 ![]() m has a rich spectrum due to the
out-of-plane bending vibrations (OOP) of aromatic H-atoms. The
peak wavelength of these modes depends on the structure of the
molecule; in particular on the number of neighbouring H-atoms per ring
(e.g. Bellamy 1958; Hudgins & Allamandola 1999). Here we present data
in this region obtained with the Short Wavelength Spectrometer (SWS)
(de Graauw et al. 1996) on-board the Infrared Space Observatory
(ISO) (Kessler et al. 1996). The sensitivity and medium
resolving power of the instrument allows us to detect and resolve
several weak features predicted by the PAH hypothesis and to determine
the molecular structure of the emitting PAHs and their evolution in
space.
m has a rich spectrum due to the
out-of-plane bending vibrations (OOP) of aromatic H-atoms. The
peak wavelength of these modes depends on the structure of the
molecule; in particular on the number of neighbouring H-atoms per ring
(e.g. Bellamy 1958; Hudgins & Allamandola 1999). Here we present data
in this region obtained with the Short Wavelength Spectrometer (SWS)
(de Graauw et al. 1996) on-board the Infrared Space Observatory
(ISO) (Kessler et al. 1996). The sensitivity and medium
resolving power of the instrument allows us to detect and resolve
several weak features predicted by the PAH hypothesis and to determine
the molecular structure of the emitting PAHs and their evolution in
space.
In Sect. 2, we present the observations of our
sample of H II regions, YSOs, reflection nebulae (RNe) and
evolved objects. The 10-15 ![]() m regions of these sources are
analysed in Sect. 3. The spectral characteristics of
PAHs in this wavelength range as measured in the laboratory and
calculated by quantum chemical theories are summarised in
Sect. 4.1. In Sect. 4.2 the
laboratory spectra are compared to the observed spectra. The molecular
structures implied by the observed spectra are discussed in
Sect. 5 while in Sect. 6 the
origin and evolution of these molecular structures are examined.
Finally in Sect. 7 our main results are summarised.
m regions of these sources are
analysed in Sect. 3. The spectral characteristics of
PAHs in this wavelength range as measured in the laboratory and
calculated by quantum chemical theories are summarised in
Sect. 4.1. In Sect. 4.2 the
laboratory spectra are compared to the observed spectra. The molecular
structures implied by the observed spectra are discussed in
Sect. 5 while in Sect. 6 the
origin and evolution of these molecular structures are examined.
Finally in Sect. 7 our main results are summarised.
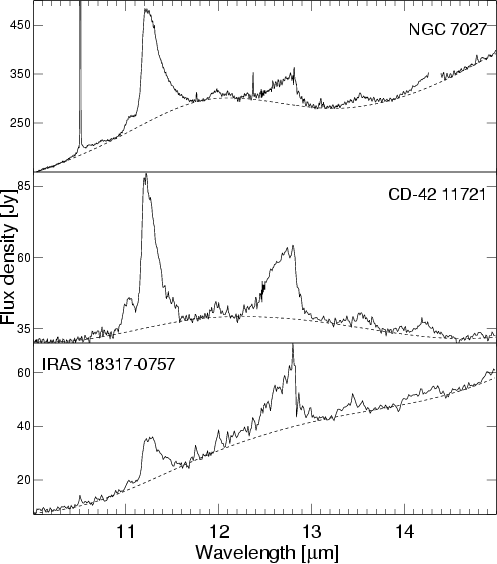 |
Figure 1: Spectra of 3 sources that show features in the region of interest. The dashed lines are the continua mentioned in the text |
| Object | Obs.a | TDTb | Sp.Type | Obj.Type | |||
| Mode | (J2000) | (J2000) | (1.6 10-6 W/m2) | ||||
| AFGL 437 | 01(2) | 03 07 23.68 | +58 30 50.62 | 86300810 | O8.5 | 1E5 | Star forming region |
| IRAS 03260+3111 | 01(3) | 03 29 10.37 | +31 21 58.28 | 65902719 | B9 | 2E4 | Herbig AeBe |
| NGC 2023 | 01(3) | 05 41 38.30 | -02 16 32.59 | 65602309 | B1.5V | 3E2 | Refl. Nebula |
| HD 44179 | 01(4) | 06 19 58.20 | -10 38 15.22 | 70201801 | B8V | 5E6 | post-AGB |
| IRAS 07027-7934 | 01(2) | 06 59 26.30 | -79 38 48.01 | 73501035 | WC10 | 2E7 | PN |
| HD 97048 | 01(4) | 11 08 04.61 | -77 39 16.88 | 61801318 | A0 | 2E4 | Herbig AeBe |
| IRAS 12405-6238 | 01(3) | 12 43 31.93 | -62 55 11.39 | 29400410 | O9.5 | 3E5 | H II |
| HEN 2-113
|
WC10 | 6E4 | PN | ||||
| - | 01(1) | 14 59 53.49 | -54 18 07.70 | 07903307 | |||
| - | 01(2) | 14 59 53.49 | -54 18 07.70 | 43400768 | |||
| IRAS 15384-5348 | 01(2) | 15 42 17.16 | -53 58 31.51 | 29900661 | 1E4 | H II | |
| CD-42 11721(off) | 01(2) | 16 59 05.82 | -42 42 14.80 | 28900461 | B0 | - | Herbig AeBe (off pointing) |
| CD-42 11721
|
B0 | - | Herbig AeBe | ||||
| - | 01(2) | 16 59 06.82 | -42 42 07.60 | 08402527 | |||
| - | 01(2) | 16 59 06.80 | -42 42 07.99 | 64701904 | |||
| IRAS 17047-5650
|
WC10 | 5E6 | PN | ||||
| - | 01(3) | 17 09 00.91 | -56 54 47.20 | 13602083 | |||
| - | 01(1) | 17 09 00.91 | -56 54 48.10 | 27301339 | |||
| HB 5 | 01(3) | 17 47 56.11 | -29 59 39.70 | 49400104 | 120 000 |
- | PN |
| NGC 6537 | 01(3) | 18 05 13.14 | -19 50 34.51 | 70300475 | A0 | - | PN |
| GGD 27-ILL
|
B1 | 3E6 | Star forming region | ||||
| - | 01(2) | 18 19 12.04 | -20 47 30.98 | 14802136 | |||
| - | 01(2) | 18 19 12.03 | -20 47 30.59 | 14900323 | |||
| IRAS 18240-0244 | 01(1) | 18 26 40.00 | -02 42 56.99 | 14900804 | WC8 | - | PN |
| IRAS 18317-0757 | 01(2) | 18 34 24.94 | -07 54 47.92 | 47801040 | O8 | - | H II |
| IRAS 18416-0420 | 01(2) | 18 44 15.19 | -04 17 56.40 | 13402168 | O5.5 | - | H II |
| IRAS 18502+0051 | 01(2) | 18 52 50.21 | +00 55 27.59 | 15201645 | O7 | - | H II |
| TY CRA
|
B9 | 6E3 | Herbig AeBe | ||||
| - | 01(3) | 19 01 40.71 | -36 52 32.48 | 33400603 | |||
| - | 01(1) | 19 01 40.70 | -36 52 32.59 | 34801419 | |||
| - | 01(3) | 19 01 40.71 | -36 52 32.48 | 71502003 | |||
| BD +30 3639 | 01(3) | 19 34 45.20 | +30 30 58.79 | 86500540 | WC9 | 1E5 | PN |
| IRAS 19442+2427 | 01(2) | 19 46 20.09 | +24 35 29.40 | 15000444 | O7 | 6E6 | H II |
| BD+40 4124 | 01(3) | 20 20 28.31 | +41 21 51.41 | 35500693 | B2 | 1E4 | Herbig AeBe |
| S106 IRS4 | 01(2) | 20 27 26.68 | +37 22 47.89 | 33504295 | 08 | 1E5 | H II |
| NGC 7023
|
B3 | 5E2 | Refl. Nebula | ||||
| - | 01(4) | 21 01 31.90 | +68 10 22.12 | 20700801 | |||
| - | 01(2) | 21 01 30.40 | +68 10 22.12 | 48101804 | |||
| NGC 7027
|
200 000 |
2E5 | PN | ||||
| - | 01(4) | 21 07 01.71 | +42 14 09.10 | 02401183 | |||
| - | 01(1) | 21 07 01.70 | +42 14 09.10 | 23001356 | |||
| - | 01(2) | 21 07 01.70 | +42 14 09.10 | 23001357 | |||
| - | 01(3) | 21 07 01.70 | +42 14 09.10 | 23001358 | |||
| - | 06 | 21 07 01.50 | +42 14 10.00 | 33800505 | |||
| - | 01(4) | 21 07 01.63 | +42 14 10.28 | 55800537 | |||
| IRAS 21190+5140 | 01(2) | 21 20 44.85 | +51 53 26.59 | 15901853 | - | 2E5 | H II |
| IRAS 21282+5050
|
O9 | 1E5 | PN | ||||
| - | 01(2) | 21 29 58.42 | +51 03 59.80 | 05602477 | |||
| - | 01(3) | 21 29 58.42 | +51 03 59.80 | 15901777 | |||
| - | 01(2) | 21 29 58.42 | +51 03 59.80 | 36801940 | |||
| IRAS 22308+5812 | 01(2) | 22 32 45.95 | +58 28 21.00 | 17701258 | O7.5 | 3E3 | H II |
| IRAS 23030+5958 | 01(2) | 23 05 10.57 | +60 14 40.60 | 22000961 | O6.5 | 7E3 | H II |
| IRAS 23133+6050 | 01(2) | 23 15 31.44 | +61 07 08.51 | 22001506 | O9.5 | 7E5 | H II |
The data were processed using SWS interactive analysis product; IA3(see de Graauw et al. 1996) using calibration files and procedures equivalent to pipeline version 7.0. If a source has been observed multiple times and these observations are of similar quality and of comparable flux-level these data are co-added after the pipeline reduction. Since the features we discuss here are fully resolved in all observing modes, we combine the data obtained in all different modes to maximise the S/N. Further data processing consisted of bad data removal, rebinning on a fixed resolution wavelength grid, removing fringes and splicing of the sub-bands to form a continuous spectrum.
For all spectra the amount of shifting between sub-bands required
falls well within the calibration uncertainties in the region of
interest: 7 to 16 ![]() m. Any jumps between bands are due to
flux calibration and dark current uncertainties. The effect of dark
current is most important in low flux cases while the flux calibration
uncertainties will dominate in bright sources. Below 20 Jy we apply
offsets to correct for dark current uncertainties. In these low
signal cases the typical noise level in the dark current measurements
of 1-2 Jy introduces offset uncertainties >5-10 per cent
dominating the flux calibration uncertainties. Above 20 Jy we apply
scaling factors to correct for flux calibration uncertainties. The
splicing introduces little uncertainty in the measured strengths since
most features fall completely within one ISO/SWS sub-band. An
exception to this is the band strength of the 12.7
m. Any jumps between bands are due to
flux calibration and dark current uncertainties. The effect of dark
current is most important in low flux cases while the flux calibration
uncertainties will dominate in bright sources. Below 20 Jy we apply
offsets to correct for dark current uncertainties. In these low
signal cases the typical noise level in the dark current measurements
of 1-2 Jy introduces offset uncertainties >5-10 per cent
dominating the flux calibration uncertainties. Above 20 Jy we apply
scaling factors to correct for flux calibration uncertainties. The
splicing introduces little uncertainty in the measured strengths since
most features fall completely within one ISO/SWS sub-band. An
exception to this is the band strength of the 12.7 ![]() m feature.
This feature is sensitive to the way band 2C (7 to 12.5
m feature.
This feature is sensitive to the way band 2C (7 to 12.5 ![]() m) and 3A
(12 to 16.5
m) and 3A
(12 to 16.5 ![]() m) are combined. This introduces an extra uncertainty
of the band strength of typically 20-30 per cent for the weakest
features.
m) are combined. This introduces an extra uncertainty
of the band strength of typically 20-30 per cent for the weakest
features.
Some SWS data, especially in band 3A, are affected by fringes. We have corrected for fringes in those sources where they occur, using the aarfringe tool of IA3 on the rebinned spectrum. In the method we apply fringes are fitted with sine functions with periods in the range where fringes are known to occur and divided out. Note that the features we study here are much broader than any of fringe periods, therefore the intensities we measure are not directly affected by the fringes. However in some cases after fringe removal the continuum is more easily determined.
SWS spectra of many sources, including stars enshrouded in both
carbon-rich and oxygen-rich dust and sources without any circumstellar
material show very weak structure around 13.5 and 14.2 ![]() m at the 3
to 4 per cent level relative to the continuum possibly due to residual
instrumental response. The emission features discussed here are all
stronger than this with a maximum of 85 per cent of the continuum in
the reflection nebula NGC 7023. Near 11.03
m at the 3
to 4 per cent level relative to the continuum possibly due to residual
instrumental response. The emission features discussed here are all
stronger than this with a maximum of 85 per cent of the continuum in
the reflection nebula NGC 7023. Near 11.03 ![]() m there is a residual
instrumental feature which coincides with the weak 11.0
m there is a residual
instrumental feature which coincides with the weak 11.0 ![]() m feature
that we observe in our spectra. We have included the effect of this
feature in the uncertainty on the intensities in
Table 2.
m feature
that we observe in our spectra. We have included the effect of this
feature in the uncertainty on the intensities in
Table 2.
Many sources in this sample have strong narrow emission lines in their
spectrum, in particular the strong [Ne II] line at 12.81 ![]() m
is perched on top of the 12.7
m
is perched on top of the 12.7 ![]() m UIR band. This line and the UIR
band are easily separated at the resolution of the SWS instrument. We
remove the contribution from this line by fitting a Gaussian profile
to the line and subtracting that profile prior to rebinning. The
spectrum of NGC 7027 has a very strong
[Ne V] emission line at 14.32
m UIR band. This line and the UIR
band are easily separated at the resolution of the SWS instrument. We
remove the contribution from this line by fitting a Gaussian profile
to the line and subtracting that profile prior to rebinning. The
spectrum of NGC 7027 has a very strong
[Ne V] emission line at 14.32
![]() m. We have removed the part of the spectrum which contains this
line.
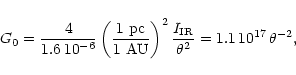
We also include in Table 1 the spectral type of the
illuminating source and an estimate of the flux density at the
location where the PAH emission originates from in units of the
average interstellar UV field (Habing 1968). We have
derived these estimates from the observed IR flux (
m. We have removed the part of the spectrum which contains this
line.
We also include in Table 1 the spectral type of the
illuminating source and an estimate of the flux density at the
location where the PAH emission originates from in units of the
average interstellar UV field (Habing 1968). We have
derived these estimates from the observed IR flux (
![]() )
and the angular size of the PAH emission region
(Wolfire et al. 1989). This estimate is based on the assumption
that all the UV light is absorbed in a spherical shell with the
angular size of the object and re-emitted in the IR. The flux density
at the shell is given by:
)
and the angular size of the PAH emission region
(Wolfire et al. 1989). This estimate is based on the assumption
that all the UV light is absorbed in a spherical shell with the
angular size of the object and re-emitted in the IR. The flux density
at the shell is given by:
 |
(1) |
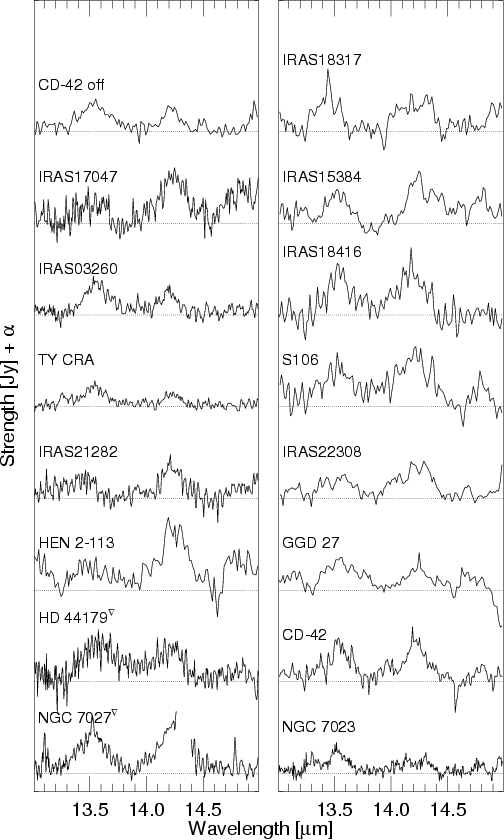 |
Figure 3:
An overview of the observed features near 13.5 and 14.2
|
| (1) | (2) | (3) | (4) | (5) | (6) | (7) | (8) | (9) | (10) | (11) |
| Source |
|
|
|
|
|
|
|
|
|
|
|
|
|
|
||||||||
| IRAS 03260 | 0.9(0.1) | 15.8(0.4) | 6.4(0.4) | 13.57(2) | 1.7(0.1) | 14.19(2) | 0.9(0.1) | 0.8(0.1) | n | 22 |
| HD 44179 | 12.6(0.5) | 118.1(6.4) | 26.3(1.4) | 13.61(2) | 13.4(0.5) | 14.21(2) | 8.6(1.3) | 4.8(2.3) | 5 | 112 |
| HEN 2-113 | 2.7(0.3) | 17.0(1.0) | 5.6(1.0) | - | - | 14.26(5) | 4.7(1.8) | 0.5(0.5) | d | 30 |
| IRAS 15384 | 0.0(0.6) | 14.5(0.8) | 13.5(0.6) | 13.52(2) | 1.5(0.3) | 14.30(2) | 2.7(0.1) | 0.6(0.1) | 2 | 66 |
| CD -42(off) | -6.5(0.2) | 22.2(0.6) | 11.3(0.5) | 13.55(2) | 1.7(0.5) | 14.22(2) | 0.8(0.2) | 1.0(0.1) | 2 | 25 |
| CD -42 | -8.2(0.8) | 31.7(1.5) | 16.7(1.0) | 13.53(2) | 1.6(0.6) | 14.22(2) | 1.6(0.3) | 1.9(0.3) | 1 | 58 |
| IRAS 17047 | 11.8(0.4) | 25.1(1.0) | 11.6(1.0) | 13.50(3) | 1.8(1.3) | 14.23(3) | 2.2(1.0) | 1.3(0.8) | n | 145 |
| GGD 27 | 2.6(0.6) | 8.9(0.6) | 5.4(0.5) | 13.57(2) | 2.1(0.2) | 14.27(4) | 1.5(0.9) | 1.4(0.1) | d | 3 |
| IRAS 18317 | 6.5(0.1) | 10.5(0.2) | 15.6(0.3) | 13.44(2) | 2.0(0.3) | 14.22(2) | 2.2(0.2) | 0.2(0.1) | 1 | 83 |
| IRAS 18416 | -2.3(0.3) | 12.8(0.9) | 9.8(0.5) | 13.55(2) | 2.4(0.4) | 14.18(3) | 3.1(1.2) | 1.2(0.3) | n | 52 |
| TY CRA | -5.0(0.3) | 15.5(0.1) | 4.7(0.2) | 13.54(2) | 1.3(0.3) | 14.21(2) | 0.5(0.1) | 0.8(0.1) | n | 13 |
| S 106 | -4.1(0.1) | 19.7(0.9) | 15.6(1.0) | 13.56(2) | 2.7(1.2) | 14.19(2) | 3.6(0.2) | 1.1(0.3) | 2 | 61 |
| NGC 7023 | -3.9(0.2) | 9.6(0.8) | 4.3(0.3) | 13.50(2) | 1.1(0.2) | 14.21(2) | 0.7(0.3) | 0.5(0.1) | n | 11 |
| NGC 7027 | 2.8(0.2) | 142.7(5.4) | 35.9(2.5) | 13.52(2) | 9.7(1.5) | 14.26(2) | 11.1(1.5) | 4.0(1.7) | 6 | 451 |
| IRAS 21282 | 4.2(1.4) | 20.4(0.7) | 6.2(0.2) | 13.40(2) | 1.5(0.4) | 14.22(2) | 1.7(0.6) | 0.6(0.3) | y | 104 |
| IRAS 22308 | -3.2(0.5) | 8.9(0.4) | 5.8(0.6) | 13.55(4) | 1.3(0.6) | 14.23(2) | 2.1(0.1) | 0.7(0.1) | n | 9 |
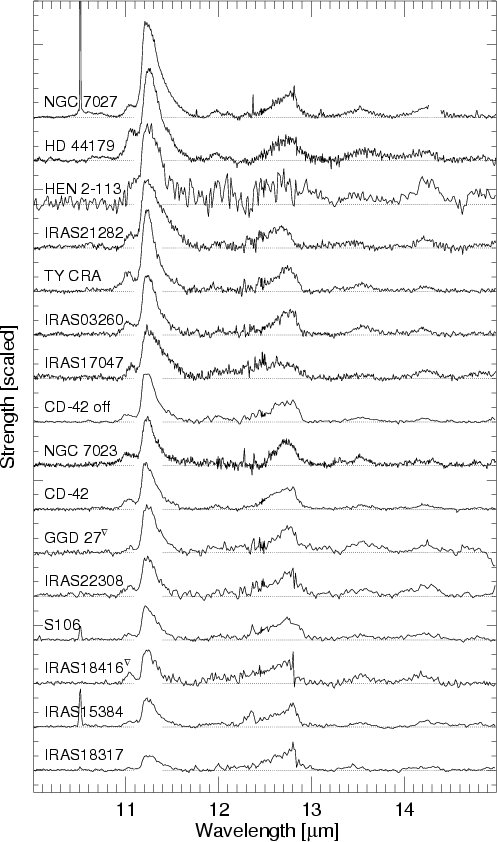
In Fig. 2 we show the continuum subtracted spectra after
normalising to the integrated strength of the 12.7 ![]() m feature. The
sources are ordered according to the strength of the 11.2
m feature. The
sources are ordered according to the strength of the 11.2 ![]() m
feature relative to the 12.7
m
feature relative to the 12.7 ![]() m band. Relative to the 12.7
m band. Relative to the 12.7 ![]() m
band, the sources with the weakest 11.2
m
band, the sources with the weakest 11.2 ![]() m feature are the H
II regions (at the bottom of Fig. 2), while the
evolved stars show the strongest 11.2
m feature are the H
II regions (at the bottom of Fig. 2), while the
evolved stars show the strongest 11.2 ![]() m band.
m band.
The spectral characteristics of the features are summarised in
Table 2. Note that the uncertainties quoted
in the table reflect the noise level and the freedom in drawing the
continuum within the methodology used to measure these bands.
Other ways of decomposing the broad, blended bands and the underlying
continuum will give other results
(e.g. Boulanger et al. 1998; Uchida et al. 2000; Verstraete et al. 2001).
However these differences are systematic differences and do not
affect the source-to-source variations we observe. The intensities of
the 11.2 and 12.7 ![]() m features are obtained by direct integration
above the chosen continuum. We measure the peak position of the 11.2
and 12.7
m features are obtained by direct integration
above the chosen continuum. We measure the peak position of the 11.2
and 12.7 ![]() m bands by fitting them with template spectra of these
features. The template spectrum for the 11.2(12.7)
m bands by fitting them with template spectra of these
features. The template spectrum for the 11.2(12.7) ![]() m feature is
constructed by adding the continuum subtracted spectra with each
11.2(12.7)
m feature is
constructed by adding the continuum subtracted spectra with each
11.2(12.7) ![]() m feature normalised to have the same integrated
intensity. This way each source has equal contribution to the template
spectrum. We use a
m feature normalised to have the same integrated
intensity. This way each source has equal contribution to the template
spectrum. We use a ![]() -minimisation routine to fit the template
to the sources, allowing for both a wavelength shift and scaling in
strength. The shifts that we determine for the 11.2
-minimisation routine to fit the template
to the sources, allowing for both a wavelength shift and scaling in
strength. The shifts that we determine for the 11.2 ![]() m band are
very small except for HD 44179 and IRAS 17047 where this band is much
broader than the template spectrum (cf.,
Table 2, see also Peeters et al. 2001, in
prep.). Although there are differences between the detailed profiles
of the 12.7
m band are
very small except for HD 44179 and IRAS 17047 where this band is much
broader than the template spectrum (cf.,
Table 2, see also Peeters et al. 2001, in
prep.). Although there are differences between the detailed profiles
of the 12.7 ![]() m band we detect no significant shift of the band as
a whole. For the weak features near 13.5 and 14.2
m band we detect no significant shift of the band as
a whole. For the weak features near 13.5 and 14.2 ![]() m, the
parameters have been determined through fitting of Gaussian profiles.
We adopted a local linear continuum for the very weak 11.0
m, the
parameters have been determined through fitting of Gaussian profiles.
We adopted a local linear continuum for the very weak 11.0 ![]() m
feature because of the severe blending of this band with the 11.2
m
feature because of the severe blending of this band with the 11.2
![]() m band. The weak 12.0
m band. The weak 12.0 ![]() m band is close to both the 11.2 and
the 12.7
m band is close to both the 11.2 and
the 12.7 ![]() m band. For only a few sources we measure the intensity
of this band, for the other sources we refrained from detailed
analysis. However Table 2 does note whether
we detect this band.
m band. For only a few sources we measure the intensity
of this band, for the other sources we refrained from detailed
analysis. However Table 2 does note whether
we detect this band.
The profile of the 11.2 ![]() m feature is asymmetric with a sharp blue
rise and a more gradual decline to longer wavelengths
(Roche et al. 1989; Witteborn et al. 1989). This will be
discussed in more detail for this sample by Peeters et al. (2001, in
prep.). The 12.7
m feature is asymmetric with a sharp blue
rise and a more gradual decline to longer wavelengths
(Roche et al. 1989; Witteborn et al. 1989). This will be
discussed in more detail for this sample by Peeters et al. (2001, in
prep.). The 12.7 ![]() m band is also asymmetric but in the opposite
way with a slow blue rise and a sharp red decline between 12.8 and
12.9
m band is also asymmetric but in the opposite
way with a slow blue rise and a sharp red decline between 12.8 and
12.9 ![]() m. Because of their intrinsic weakness, the profiles of the
10.6, 11.0, 12.0, 13.5, and 14.2
m. Because of their intrinsic weakness, the profiles of the
10.6, 11.0, 12.0, 13.5, and 14.2 ![]() m features in the individual
sources are not well determined however in the averaged spectrum,
these features appear symmetric (cf. Fig. 7).
m features in the individual
sources are not well determined however in the averaged spectrum,
these features appear symmetric (cf. Fig. 7).
Because here we want to study variations in the relative
strength of the UIR bands to each other, not differences in absolute
intensities differences due to intrinsic luminosity and distance of
the source, we use 3-feature intensity ratio correlations. Although
we observe variations in all ratios, we find only three that correlate
and these are shown in Figs. 4-6.
First, we find that the CH stretch mode at 3.3 ![]() m correlates with
the 11.2
m correlates with
the 11.2 ![]() m band (cf. Fig. 4). Note that the slope
of the trend is roughly 1, which means that the
m band (cf. Fig. 4). Note that the slope
of the trend is roughly 1, which means that the
![]() /
/
![]() is on the average constant at a
value of 3-4.
is on the average constant at a
value of 3-4.
Second, the 12.7 ![]() m band correlates with the CC stretch mode at
6.2
m band correlates with the CC stretch mode at
6.2 ![]() m, albeit with more scatter (cf. Fig. 5) than
the 11.2/3.3 ratio. The 7-9
m, albeit with more scatter (cf. Fig. 5) than
the 11.2/3.3 ratio. The 7-9 ![]() m complex is well correlated with
the 6.2
m complex is well correlated with
the 6.2 ![]() m band and similar plots can be made with these
interchanged. Inspection of Fig. 2 and
Table 2 shows that there is some indication
for both the
m band and similar plots can be made with these
interchanged. Inspection of Fig. 2 and
Table 2 shows that there is some indication
for both the
![]() /
/
![]() and the
and the
![]() /
/
![]()
![]() m band to be higher in H
II regions, however only about half the sources have such high S/N
that these intensities can be reliably measured and this trend is not
statistically significant.
m band to be higher in H
II regions, however only about half the sources have such high S/N
that these intensities can be reliably measured and this trend is not
statistically significant.
Lastly, we show in Fig. 6 the correlation between the
ratio of the flux emitted in the PAH bands relative to the total flux
emitted in the IR (
![]() )
and the changing
)
and the changing
![]() /
/
![]() ratio. We measure the
ratio. We measure the
![]() by integrating the SWS data and Long Wavelength
Spectrometer (LWS) data if available. For those sources without LWS
data we use a blackbody fitted to IRAS measurements in the wavelength
region from 45-200
by integrating the SWS data and Long Wavelength
Spectrometer (LWS) data if available. For those sources without LWS
data we use a blackbody fitted to IRAS measurements in the wavelength
region from 45-200 ![]() m. We do not apply corrections for aperture
differences between the instruments. We estimate an uncertainty of 15
per cent on the
m. We do not apply corrections for aperture
differences between the instruments. We estimate an uncertainty of 15
per cent on the
![]() .
Again different classes of objects
occupy different parts in this diagram.
.
Again different classes of objects
occupy different parts in this diagram.
We also checked for correlations between band strength ratios and the
flux density; ![]() ,
however we do not detect any
correlations.
,
however we do not detect any
correlations.
We emphasise that, while all UIR bands show a loose correlation in the
absolute intensity (see also Cohen et al. 1986, 1989), these three are the only tight correlations
present in this sample.
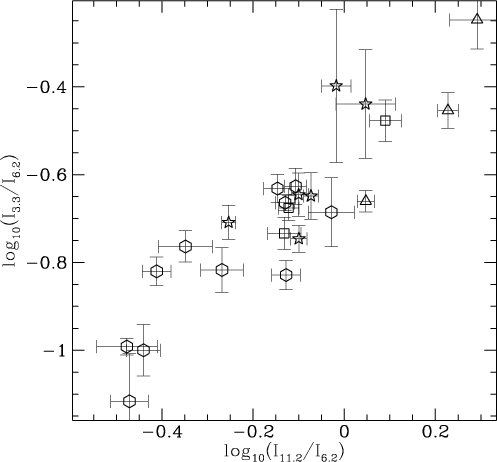 |
Figure 4: Bands strength ratios as derived from the SWS spectra. Hexagons are H II regions, stars intermediate mass star forming regions, squares RNe and triangles are PNe |
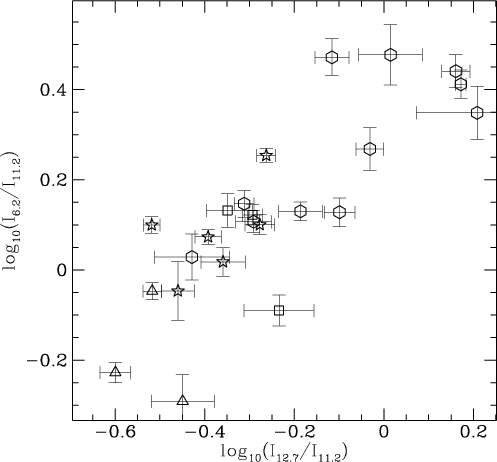 |
Figure 5: Bands strength ratios as derived from the SWS spectra. Plotting symbols are the same as in Fig. 4 |
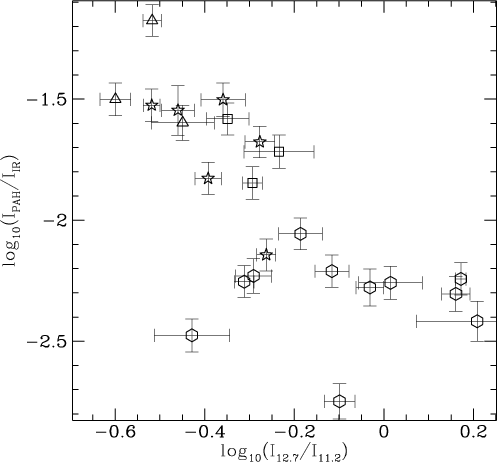 |
Figure 6:
The ratio between the flux emitted in the PAH bands over
the total amount of IR radiation against the
|
|
|
|
|
|
| |
|
|
| [km/mol] | [km/mol] | [km/mol] | |
| Solo | 10.6 | 11.4 | 24.8(13.5) | 25.7(14.2) | 24.1(12.9) |
| Duo | 11.35 | 12.8 | 4(2.5) | 4.4(2.4) | 3.7(2.5) |
| Trio | 12.5 | 13.3 | 9.6(5.9) | 10.1(5.3) | 9.0(6.5) |
| Quartet | 13.0 | 13.9 | 12.0(4.8) | 11.5(5.5) | 12.6(3.9) |
Summary of the laboratory results on CH out-of-plane bending
modes for solo, duo, trio and quartet hydrogens on matrix isolated
neutral polycyclic aromatic hydrocarbons and their cations. (Adapted from Hudgins
et al. 2000b).
![]() is the lower limit of the region in
is the lower limit of the region in
![]() m.
m.
![]() is the upper limit of the region in
is the upper limit of the region in
![]() m.
m.
![]() The cross-section values for the solo, trio, and quartet
modes per hydrogen are the averages over the spectra in the database.
However, the A values for the duo mode per hydrogen decreases rapidly
with size and settles to slightly less than 4 km/mole for PAHs with
more than 24 carbon atoms. This value is more appropriate to use in
determining the edge structures of PAHs that dominate emission in
this wavelength region.
The cross-section values for the solo, trio, and quartet
modes per hydrogen are the averages over the spectra in the database.
However, the A values for the duo mode per hydrogen decreases rapidly
with size and settles to slightly less than 4 km/mole for PAHs with
more than 24 carbon atoms. This value is more appropriate to use in
determining the edge structures of PAHs that dominate emission in
this wavelength region.
![]() Total average cross-sections over both neutrals and cations in
the database.
Total average cross-sections over both neutrals and cations in
the database.
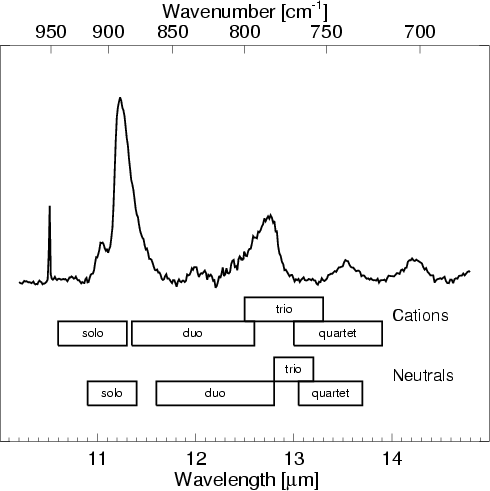
There are two points that emerge from an analysis of the laboratory database that are of particular importance to the observational data presented here. The first involves the effect of ionisation on the characteristic wavelength regions of the various CH adjacency classes. The second is the intrinsic integrated absorption strengths (A values) which are derived for the various adjacency classes. Together these results provide the tools to not only qualitatively infer the sorts of PAH edge structures present, but also quantitatively determine their relative amounts. As shown below, this allows one to place stringent constraints on the emitting interstellar PAH family.
Perusal of Fig. 7 and the wavelength limits listed in
Table 3 shows that, while the ranges for neutral PAHs
are not modified substantially compared to Bellamy (1958),
ionisation causes some important changes in region boundaries. These
data expand on the initial report that the PAH cation solo hydrogen
position is substantially blue shifted with respect to the wavelength
for its neutral counterpart while the domains indicative of the other
types of hydrogen are less affected by ionisation
(Hudgins & Allamandola 1999). Considering these modified domains and
taking into account the roughly 0.1 ![]() m redshift in the peak
position for PAHs emitting at temperatures of
m redshift in the peak
position for PAHs emitting at temperatures of ![]() 500-1000 K
(Flickinger et al. 1991; Brenner & Barker 1992; Colangeli et al. 1992; Joblin et al. 1995; Cook & Saykally 1998) allows us to draw the
following conclusions.
500-1000 K
(Flickinger et al. 1991; Brenner & Barker 1992; Colangeli et al. 1992; Joblin et al. 1995; Cook & Saykally 1998) allows us to draw the
following conclusions.
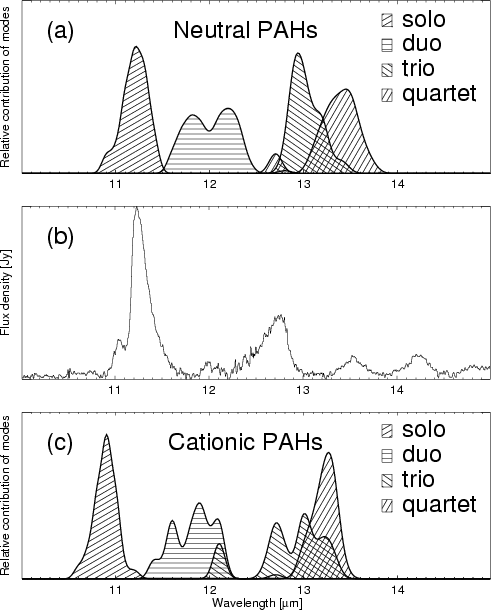 |
Figure 8: Comparison between the mean interstellar spectrum (panel b)) and synthetic PAH spectra showing the distribution over peak positions of the OOP modes in the Hudgins database (Hudgins et al. 2000b). The shaded surfaces in panels a) and c) represent the contributions per mode for neutral and positively charged PAHs respectively. Each area represents the average absorption cross-section per functional group |
 |
(2) |
One should bear in mind, that the measured species are probably smaller than those that dominate the interstellar population and that, for stability reasons, the interstellar PAH family might be skewed to a few of these molecules or the edges structures they represent (cf. Sect. 5). Comparing the interstellar spectrum (Fig. 8b) with these averaged laboratory spectra (Figs. 8a,c) allows us to further refine the discussion:
It is also immediately clear from Fig. 8 that the interstellar spectrum does not reflect an equal distribution over the different functional groups but is dominated by the contribution of solo modes. This reflects the molecular structure of the emitting PAHs.
| s/d | s/t | s/q | |
| NGC 7207 | 7.7 | 4.6 | 28.5 |
| IRAS 18317 | 3.4 | 0.8 | 10.2 |
The ratio of the number of solo to duo (s/d), solo
to trio (s/t) and solo to quartet (s/q) groups
for NGC 7027 and IRAS 18317 as deduced from their 10 to 15 ![]() m
spectra.
m
spectra.
Examples of the types of PAHs which simultaneously satisfy these
different structural constraints are shown in
Fig. 9. In constructing these structures one
should keep in mind that solo H's represent long straight edges, while
the corners in the structures give rise to duos or trios. To match the
dominance of the 11.2 ![]() m feature in NGC 7027 one is naturally
driven towards rather large molecules with at least
m feature in NGC 7027 one is naturally
driven towards rather large molecules with at least ![]() 100-200
carbon atoms and long straight edges. This is entirely in keeping with
previous theoretical calculations of the molecular sizes of the PAH
species which account for most of the emission in these features
(Schutte et al. 1993). As illustrated in
Fig. 9 structure 1 approximates the ratios listed
in Table 4 for NGC 7027, these ratios requires a
preponderance of solo hydrogens over duos and trios. The extreme
quartet to solo group ratio observed for NGC 7027 is not well
reproduced even by Fig. 9 structure 1. In order
to reproduce that ratio in one single molecule one has to go to
even larger molecules. Rather, we surmise the extreme ratio reflects
the presence of molecules without any quartet groups. Quartet
groups represent pendant rings on the molecule, which can be taken off
without altering the other ratios strongly. Of course many other PAH
structures that match the observed ratios are possible. However these
structures are all very similar to this and the conclusion is the
same: in NGC 7027 the PAH family is dominated by large compact PAHs.
100-200
carbon atoms and long straight edges. This is entirely in keeping with
previous theoretical calculations of the molecular sizes of the PAH
species which account for most of the emission in these features
(Schutte et al. 1993). As illustrated in
Fig. 9 structure 1 approximates the ratios listed
in Table 4 for NGC 7027, these ratios requires a
preponderance of solo hydrogens over duos and trios. The extreme
quartet to solo group ratio observed for NGC 7027 is not well
reproduced even by Fig. 9 structure 1. In order
to reproduce that ratio in one single molecule one has to go to
even larger molecules. Rather, we surmise the extreme ratio reflects
the presence of molecules without any quartet groups. Quartet
groups represent pendant rings on the molecule, which can be taken off
without altering the other ratios strongly. Of course many other PAH
structures that match the observed ratios are possible. However these
structures are all very similar to this and the conclusion is the
same: in NGC 7027 the PAH family is dominated by large compact PAHs.
In contrast, for IRAS 18317 the situation is very different. The observed ratios force one to include more corners or uneven edges. Structure 4 in Fig. 9 illustrates one way of achieving this. Of course this effect can also be achieved by going to smaller compact structures of the type shown in structure 1 or by breaking up structure 4 in two or more fragments. Structures 2 and 3 shown in Fig. 9 are intermediate between these two extremes and have solo/duo, solo/trio, and solo/quartet ratios consistent with the relative interstellar band intensities shown in Fig. 2 for the objects which lie between the extremes, NGC 7027 and the IRAS 18317. Thus we observe a structural evolution where closed, compact species dominate the emission in some regions, while open, uneven structures are more important in others. We surmise that this structural evolution as revealed by the smooth spectral evolution shown in Fig. 2 reflects the variations in chemical history and excitation environment in these regions.
The spectral identification of the 12.7 band is much less clear and it
is not possible at this time to assign this band unambiguously to
either neutral or cationic PAHs. In the existing database there is
only one species with a strong band that matches well in position,
which "happens'' to be a cation. Furthermore the strength of the
interstellar 12.7 ![]() m band correlates with the strength of the 6.2
m band correlates with the strength of the 6.2
![]() m feature (see Sect. 3.4). The strength of the modes
between 6 and 9
m feature (see Sect. 3.4). The strength of the modes
between 6 and 9 ![]() m are greatly enhanced upon ionisation, and thus,
one way to understand this correlation is to assume that the 12.7 is
also predominantly carried by cations.
m are greatly enhanced upon ionisation, and thus,
one way to understand this correlation is to assume that the 12.7 is
also predominantly carried by cations.
Thus, seemingly, the 11.2 ![]() m and 12.7
m and 12.7 ![]() m bands represent a
dichotomy of interstellar PAHs with the former carried mainly by
neutral and the latter by positively charged PAHs. The origin of this
interrelation between charge and spectral characteristics in unclear.
There is no indication in the laboratory experiments for a causal
relation between, for example, charge state and the relative strength
of the solo to trio modes. Considering also the discussion on the
molecular structures implied by the relative fraction of the solos to
duos and trios (Sect. 5;
Fig. 9) we are forced to conclude that the good
correlation between the 11.2 and 3.3
m bands represent a
dichotomy of interstellar PAHs with the former carried mainly by
neutral and the latter by positively charged PAHs. The origin of this
interrelation between charge and spectral characteristics in unclear.
There is no indication in the laboratory experiments for a causal
relation between, for example, charge state and the relative strength
of the solo to trio modes. Considering also the discussion on the
molecular structures implied by the relative fraction of the solos to
duos and trios (Sect. 5;
Fig. 9) we are forced to conclude that the good
correlation between the 11.2 and 3.3 ![]() m bands and between the 12.7
and the 6.2
m bands and between the 12.7
and the 6.2 ![]() m bands reflects a correlation of molecular
structure and charge state with environment. Indeed when using
PAHs containing some 50 C-atoms (Leger & Puget 1984) the
correlation between the
m bands reflects a correlation of molecular
structure and charge state with environment. Indeed when using
PAHs containing some 50 C-atoms (Leger & Puget 1984) the
correlation between the
![]() /
/
![]() and
and
![]() /
/
![]() is well reproduced by model
calculations of Bakes et al. (2000) by only varying the degree of
ionisation. Thus, those environments which favour large PAHs and the
11.2
is well reproduced by model
calculations of Bakes et al. (2000) by only varying the degree of
ionisation. Thus, those environments which favour large PAHs and the
11.2 ![]() m band (structure 1 in Fig. 9) also
favour neutral PAHs. While in regions where open uneven molecular
structures and the 12.7
m band (structure 1 in Fig. 9) also
favour neutral PAHs. While in regions where open uneven molecular
structures and the 12.7 ![]() m band (structure 4 in
Fig. 9) dominate, PAHs are predominantly charged.
m band (structure 4 in
Fig. 9) dominate, PAHs are predominantly charged.
This is probably also the origin of the correlation between the
![]() /
/
![]() ratio and the
ratio and the
![]() /
/
![]() (cf. Fig. 6). The
(cf. Fig. 6). The
![]() /
/
![]() measures the PAH/dust abundance
ratio. The loose correlation suggests that for the ISM sources the PAH
abundance is lower. We recognise that PNe inject freshly synthesised
PAHs into the ISM where they are mixed and processed by FUV photons
and shocks. This processing will lead to a slow destruction of the
PAHs.
measures the PAH/dust abundance
ratio. The loose correlation suggests that for the ISM sources the PAH
abundance is lower. We recognise that PNe inject freshly synthesised
PAHs into the ISM where they are mixed and processed by FUV photons
and shocks. This processing will lead to a slow destruction of the
PAHs.
The dominant molecular structure reflects the integrated history of
the PAH family and we note that all sources with a strong 11.2 ![]() m
band are PNe, which have formed their PAHs within the last some 1000
years. Because open uneven molecular structures are kinetically more
reactive to the addition of carbon atoms than compact structures, the
predominance of the latter in chemically reactive regions where PAHs
have recently formed can be rationalised
(Frenklach & Feigelson 1989; Cherchneff et al. 1992). In contrast regions
with relatively strong 12.7
m
band are PNe, which have formed their PAHs within the last some 1000
years. Because open uneven molecular structures are kinetically more
reactive to the addition of carbon atoms than compact structures, the
predominance of the latter in chemically reactive regions where PAHs
have recently formed can be rationalised
(Frenklach & Feigelson 1989; Cherchneff et al. 1992). In contrast regions
with relatively strong 12.7 ![]() m bands are all H II regions
where luminous stars illuminate material which has been processed in
the ISM for some 109 years. This processing irreversibly leads to a
breaking down of the molecular structure because reformation is
prohibited by the low temperature of the ISM.
m bands are all H II regions
where luminous stars illuminate material which has been processed in
the ISM for some 109 years. This processing irreversibly leads to a
breaking down of the molecular structure because reformation is
prohibited by the low temperature of the ISM.
This does not directly explain why the 11.2 ![]() m band correlates
with the neutral PAH indicator while the 12.7
m band correlates
with the neutral PAH indicator while the 12.7 ![]() m emission feature
correlates with bands attributed to ions. The charge state is rapidly
set by the charge balance, which is dominated by local physical
conditions, or more specifically the ionisation parameter,
m emission feature
correlates with bands attributed to ions. The charge state is rapidly
set by the charge balance, which is dominated by local physical
conditions, or more specifically the ionisation parameter,
![]() ,
where
,
where
![]() is the FUV radiation field,
is the FUV radiation field,
![]() is the
gas-temperature and
is the
gas-temperature and ![]() the electron density. Thus rather
than history, ionisation reflects the present. Possibly most of the
destruction is occurring presently and is also driven by local
physical conditions.
the electron density. Thus rather
than history, ionisation reflects the present. Possibly most of the
destruction is occurring presently and is also driven by local
physical conditions.
Observationally, our analysis also argues against dehydrogenation.
First, we observe a constant ratio of the 3.3 ![]() m band (all CH
oscillation) to the 11.2
m band (all CH
oscillation) to the 11.2 ![]() m band (only solo CH oscillation).
However, we would expect a non-linear behaviour since, when
dehydrogenation commences the number of solo H increases as duos and
trios are converted to solo's and only at high dehydrogenation does
the relation between the 3.3 and the 11.2
m band (only solo CH oscillation).
However, we would expect a non-linear behaviour since, when
dehydrogenation commences the number of solo H increases as duos and
trios are converted to solo's and only at high dehydrogenation does
the relation between the 3.3 and the 11.2 ![]() m bands become linear
(Schutte et al. 1993). Secondly, if the variation in
m bands become linear
(Schutte et al. 1993). Secondly, if the variation in
![]() /
/
![]() reflects dehydrogenation than we
would expect that decreasing H coverage (i.e. decreasing
reflects dehydrogenation than we
would expect that decreasing H coverage (i.e. decreasing
![]() /
/
![]() )
would correlate with increasing
CC/CH mode emission (i.e.
)
would correlate with increasing
CC/CH mode emission (i.e.
![]() /
/
![]() ). The
opposite is actually observed (cf. Fig. 5). We
conclude therefore that dehydrogenation has little influence on the
observed interstellar UIR spectrum.
). The
opposite is actually observed (cf. Fig. 5). We
conclude therefore that dehydrogenation has little influence on the
observed interstellar UIR spectrum.
We have summarised new laboratory spectroscopy results for the CH
out-of-plane bending vibrations on isolated neutral and cationic
PAHs. Different number of adjacent CH bonds give rise to vibrations
in distinctly different wavelength regions. The modes are therefore
good diagnostics of the molecular structure of the emitting species.
Upon ionisation the solo CH vibrations are shifted to shorter
wavelength compared to the solo modes in neutral. The cross-sections
per mode are not strongly modified upon ionisation. We attribute the
weak bands at 10.6 and 11.0 ![]() m to solo modes in positively charged
PAHs, the strong 11.2
m to solo modes in positively charged
PAHs, the strong 11.2 ![]() m band the solo modes in neutral. The weak
12.0
m band the solo modes in neutral. The weak
12.0 ![]() m band we assign to the duo modes, the 12.7
m band we assign to the duo modes, the 12.7 ![]() m to trio
modes and the 13.5
m to trio
modes and the 13.5 ![]() m feature to quartet vibrations.
m feature to quartet vibrations.
From the average cross-sections per mode we have constrained the
relative numbers of solo, duo, trio and quartet CH groups in different
sources for the PAH species that effectively emit in this wavelength
region. The spectra of PNe with a dominant 11.2 ![]() m feature arises
from large (
m feature arises
from large (![]() 100-150 C-atom) compact PAHs with long straight
edges. In contrast the H II region spectra are due to smaller or
more irregular PAHs.
100-150 C-atom) compact PAHs with long straight
edges. In contrast the H II region spectra are due to smaller or
more irregular PAHs.
We propose a scenario in which large compact PAHs are formed in the
winds around evolved stars. These PAHs are consequently degraded in
the ISM. From the correlations between charge indicators, which are
set by the local physical conditions, and the 11.2/12.7 ![]() m band
strength ratio, which is determined by the molecular structure, we
conclude that much of this degradation happens on a short timescale in
the emission objects themselves.
m band
strength ratio, which is determined by the molecular structure, we
conclude that much of this degradation happens on a short timescale in
the emission objects themselves.
Acknowledgements
The authors wish to thank the referee dr. L. Verstraete whose comments have helped to improve the paper. SH acknowledges the support from an NWO program, grant 616-78-333. EP acknowledges the support from an NWO program, grant 783-70-000. CVK is a Research Assistant of the Fund for Scientific Research. DMH and LJA gratefully acknowledge support under NASA's IR Laboratory Astrophysics (344-02-06-01) and Long Term Space Astrophysics programs (399-20-01). IA3 is a joint development of the SWS consortium. Contributing institutes are SRON, MPE, KUL and the ESA Astrophysics Division. This work was supported by the Dutch ISO Data Analysis Center(DIDAC). The DIDAC is sponsored by SRON, ECAB, ASTRON and the universities of Amsterdam, Groningen, Leiden and Leuven.