A&A 370, 479-487 (2001)
DOI: 10.1051/0004-6361:20010216
On the X-ray fast-time variability of Sco X-2
(GX 349+2)
P. M. O'Neill1 -
E. Kuulkers2,3 -
R. K. Sood1 - T. Dotani4
1 - School of Physics, Australian Defence Force Academy, University
of New South Wales, Canberra ACT 2600, Australia
2 -
Space Research Organization Netherlands, Sorbonnelaan 2, 3584 CA
Utrecht, The Netherlands
3 -
Astronomical Institute, Utrecht University, PO Box 80000, 3507
TA Utrecht, The Netherlands
4 -
Institute of Space and Astronautical Science,
1-1 Yoshinodai 3-chome, Sagamihara-shi, Kanagawa 229-8510,
Japan
Received 11 October 2000 / Accepted 2 February 2001
Abstract
We have analysed archived Ginga data on the Z source Sco X-2
(GX 349+2). We present the first detailed investigation of its
X-ray fast-time variability, as a function of position in the Z track.
During the two-day observation over the period 5-7 March 1989, the source
was in the so-called flaring branch, and the lower part of the so-called
normal branch. We found broad peaked noise with a centroid frequency and
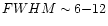
width of  4-7 Hz and 6-12 Hz respectively. The peaked noise
was strongest in the lower flaring branch, with a maximum fractional rms
amplitude of 3%. We conclude that it is not a manifestation of
atoll source high frequency noise, as had been suggested, and compare it
with the power spectral features seen in other Z sources. We find that the
peaked noise is markedly different to the quasi-periodic oscillations found
in the normal and flaring branches of Sco X-1; however it bears
some resemblance to that seen in the flaring branch of Cyg X-2 at
low overall intensities.
4-7 Hz and 6-12 Hz respectively. The peaked noise
was strongest in the lower flaring branch, with a maximum fractional rms
amplitude of 3%. We conclude that it is not a manifestation of
atoll source high frequency noise, as had been suggested, and compare it
with the power spectral features seen in other Z sources. We find that the
peaked noise is markedly different to the quasi-periodic oscillations found
in the normal and flaring branches of Sco X-1; however it bears
some resemblance to that seen in the flaring branch of Cyg X-2 at
low overall intensities.
Key words: accretion, accretion disks - stars: binaries: close - stars:
individual: Sco X-2; GX 349+2 -
stars: neutron -
X-rays: stars
1 Introduction
Sco X-2 (GX 349+2) is a neutron star low-mass X-ray
binary and Z source. Z sources trace out a characteristic "Z'' shaped track
in an X-ray colour-colour diagram (CD) or hardness-intensity diagram (HID)
consisting of a "horizontal'' branch (HB), "normal'' branch (NB) and
"flaring'' branch (FB) (Hasinger & van der Klis 1989; hereafter HK;
van der Klis 1995). The orientation of each branch in a CD or HID
depends upon the choice of energy bands. Mass-accretion rate ( )
is thought to increase from the HB, down the NB and up the FB. The other
traditional Z sources are: Sco X-1, GX 17+2,
GX 340+0, Cyg X-2, and GX 5-1.
)
is thought to increase from the HB, down the NB and up the FB. The other
traditional Z sources are: Sco X-1, GX 17+2,
GX 340+0, Cyg X-2, and GX 5-1.
A class of objects that are related to Z sources are the "atoll'' sources.
Atoll sources trace out a curved track in a CD, with inferred
mass-accretion rate increasing along the track. Atoll sources are thought
to have lower magnetic field strengths, and lower mass-accretion rates than
Z sources (HK).
The X-ray fast timing properties of Z and atoll sources are different, yet
related. The features observed in the power spectra of both classes are
normally correlated with the position of the source in a CD or HID. Z
sources exhibit very low frequency noise (VLFN), low frequency noise (LFN),
high frequency noise (HFN), and quasi-periodic oscillations (QPOs). QPOs
with frequencies in the range 15-60 Hz (called HBOs) and 200-1200 Hz (kHz
QPOs; these typically occur in pairs) are present in the HB and upper part
of the NB. Atoll sources exhibit VLFN, HFN, 1-70 Hz QPOs and kHz QPOs.
Atoll source HFN can sometimes be peaked, and resemble broad QPOs (HK and
references therein). A recent review of the fast-time variability of Z and
atoll sources, with a discussion of various models, has been given by
van der Klis (2000).
In Z sources, narrow QPOs (called NBOs) with centroid frequencies in the
range 5-8 Hz have been observed in the NB. NBOs typically become
detectable halfway down the NB, and their properties differ between
objects. In Sco X-1 the frequency of the NBO is
5.5-8 Hz
in the NB, and jumps to 12 Hz as the source enters the FB (the QPO is
then referred to as an FBO) (Dieters & van der Klis 2000). As the
source moves up the FB, the frequency and full width at half maximum (FWHM)
increase; eventually, at 10% of the way up the FB, the FBO
becomes so broad as to be indistinguishable from the underlying noise (but
the relative width never exceeds 0.5). In Sco X-1 the
fractional rms increases with increasing
and is greater at higher
energies; and there is no time lag between low and high energy bands
(Dieters et al. 2000). The N/FBO seen in GX 17+2 behaves
in a similar fashion to Sco X-1 (Penninx et al. 1990). In
the other Z sources NBOs have also been observed but are generally less
prominent (e.g. Kuulkers et al. 1994).
Sco X-2 is seemingly very similar to Sco X-1. The
Z tracks have nearly identical shapes (except for the absence of an HB in
Sco X-2) and the lightcurves of both objects exhibit strong
flaring behaviour (Schultz et al. 1989;
Kuulkers & van der Klis 1995a). The orbital periods are also
similar: 18.9 h for Sco X-1 (Cowley & Crampton 1975); and
22 h for Sco X-2 (Wachter 1997). One might therefore
expect the X-ray fast-time variability in Sco X-2 to resemble that
seen in Sco X-1; but this is not the case.
EXOSAT observations of Sco X-2 reported by
Ponman et al. (1988) showed a complete FB. No narrow NBO was
found; however broad peaked noise was detected with a centroid frequency
and FWHM of about 5 Hz and 10 Hz respectively. The peaked noise was
strongest in the lower FB, with a fractional rms of
 %.
There was no significant change in the frequency or width of the peaked
noise, and there was no time lag between the low and high energy bands. We
note that the authors divided their data into four segments on the basis of
intensity, and not according to position in the Z track. By using that
method they could not differentiate between the NB and the lower FB.
%.
There was no significant change in the frequency or width of the peaked
noise, and there was no time lag between the low and high energy bands. We
note that the authors divided their data into four segments on the basis of
intensity, and not according to position in the Z track. By using that
method they could not differentiate between the NB and the lower FB.
A small set of Rossi X-ray Timing Explorer observations were reported by
Kuulkers & van der Klis (1998; hereafter KK), when Sco X-2
was near the NB/FB vertex. In the lower NB they found peaked noise with a
centroid frequency, FWHM and fractional rms of
 Hz,
Hz,  Hz
and
Hz
and
 % respectively. In the lower region of the FB they
measured these values as
% respectively. In the lower region of the FB they
measured these values as
 Hz,
Hz,
 Hz and
 %. There was a small but significant decrease in frequency
when the source moved through the NB/FB vertex. They commented that the
peaked noise resembled the peaked HFN sometimes seen in atoll sources.
They found that the peaked noise fractional rms was stronger at higher
energies.
%. There was a small but significant decrease in frequency
when the source moved through the NB/FB vertex. They commented that the
peaked noise resembled the peaked HFN sometimes seen in atoll sources.
They found that the peaked noise fractional rms was stronger at higher
energies.
Even though there have been clear indications that Sco X-2
exhibits marked differences to Sco X-1, it has remained largely
ignored. This is perhaps due to the fact that it looks so similar to
Sco X-1 in a CD and HID.
We present results obtained from an analysis of archived data from the
Ginga satellite; these data have not previously been presented. This work
is the first detailed analysis of the power spectral properties of
Sco X-2 as a function of position in the Z track. This analysis
method is extremely useful because it allows us to unambiguously
distinguish between the NB and lower FB, and is helpful when making
comparisons between different objects. We further highlight the
differences between Sco X-2 and Sco X-1, and conclude
that the observed peaked noise is not the same as atoll source peaked HFN,
as had been suggested. We compare our results with the power spectral
features seen in other Z sources.
2 Observations
The Ginga Large Area Counter (LAC) (Makino & ASTRO-C Team 1987;
Turner et al. 1989) observed Sco X-2 between 5 and 7 March
1989. We retrieved the data from the Leicester Database and Archive
Service![[*]](/icons/foot_motif.gif) . In
Table 1 we present a log of observations.
. In
Table 1 we present a log of observations.
The LAC consisted of eight detectors, and was sensitive to X-rays in the
range 1-37 keV. Several modes were available, with differing time and
energy resolutions (higher time resolution sacrifices energy resolution).
The observations discussed here were done in the so-called MPC3 and PC
modes. For the MPC3 mode the coarse gain setting was high, providing an
energy range 1-19 keV over twelve channels. The time resolution was
7.8 ms and 62.5 ms for high (MPC3-H) and medium (MPC3-M) bit rates
respectively. In the PC mode, the LAC was divided into two groups of four
detectors each. The coarse gain setting was low, giving an energy range
1.5-24.3 keV for one detector group, and 1.2-17.9 keV for the other.
Each detector group had two energy channels, so the PC mode observations
had four overlapping energy bands. In the high bit rate mode (PC-H), the
time resolutions were 0.98 ms and 1.95 ms for the lower and higher energy
bands respectively. Our 0.98 ms data were rebinned with a time resolution
of 1.95 ms, to obtain lightcurves for the full energy range.
During the observations in Sect. C (see Table 1) the high
voltages in detectors 5 and 6 were accidently changed. The energy range
for the MPC3 observations stated above is therefore only approximate for
Sect. C.
Table 1:
Observation Log
| Section |
Start Time (UT) |
End Time (UT) |
Usable Data (s) |
Modes |
Time Res (ms) |
A |
5 Mar. 1989 20:58 |
6 Mar. 1989 00:17 |
4512 |
PC-H |
0.98/1.95 |
| B |
6
Mar. 1989 00:27 |
6 Mar. 1989 19:13 |
2880 |
MPC3-H |
7.8 |
| |
|
|
12928 |
MPC3-M |
62.5 |
| C |
7 Mar. 1989 02:13 |
7 Mar. 1989 14:30 |
12928 |
MPC3-M |
62.5 |
| D |
7 Mar. 1989 18:12 |
7 Mar. 1989 19:14 |
1184 |
PC-H |
0.98/1.95 |
3 Analysis
The counting rates were corrected for detector deadtime and collimator
response. During the observations in Sects. A-C, the collimator response
was 0.96. In Sect. D the response was 0.73. The data were
not corrected for collimator reflection. The effect of collimator
reflection was to overestimate counting rates below 6 keV by a few
percent (Turner et al. 1989; see also Hasinger et al. 1990;
Wijnands et al. 1997).
Hardness-intensity diagrams were constructed using 64 s averages. For the
MPC3 data we defined the hardness as the counting rate ratio between
8.2-16.7 keV and 5.8-8.2 keV. The intensity was defined as the counting
rate in the range 1.1-16.7 keV. For the PC data we defined the hardness
as the counting rate ratio between 5.7-17.9 keV and 1.2-5.7 keV. The
intensity was defined as the counting rate, from one detector group only
(i.e. four detectors), in the range 1.2-17.9 keV.
Timing analysis was performed on the raw (i.e. not corrected for deadtime
and collimator response) data. Power spectra were calculated from 16 s
intervals in several energy bands, and then averaged according to either
corrected counting rate or rank number.
Rank number was introduced by Hasinger et al. (1990) (see also Lewin
et al. 1992; Hertz et al. 1992;
Dieters & van der Klis 2000) and is a one-dimensional measure of
the position of the source in a CD or HID. Rank number increases smoothly
with increasing inferred mass-accretion rate. To measure the rank numbers,
a spline was fitted through the Z track, and each point was projected onto
it. Rank number was then determined by measuring the distance of each
point along the spline. We defined the NB/FB vertex as rank number 1, and
the top of the observed FB as rank number 2.
We calculated the expected deadtime-affected white-noise levels and then
subtracted the white-noise from each average power spectrum. The procedure
to calculate white-noise levels in sum channel power spectra is well known,
and is described by van der Klis (1989) and
Mitsuda & Dotani (1989). The full procedure to calculate
white-noise levels in energy resolved power spectra is not explicity stated
in those references; we therefore describe our procedure in the Appendix.
After the deadtime-affected white-noise levels had been subtracted, the
spectra were normalised to fractional-rms-squared per Hz and functional
 fits were performed. Very low frequency noise (VLFN) was
modelled using a power law
fits were performed. Very low frequency noise (VLFN) was
modelled using a power law
 and integrated over the range
0.01-1 Hz. Peaked noise was modelled using a Lorentzian. All power
spectra were initially fitted with only a power law. The significance of
adding a Lorentzian component to the fit was then estimated via an F-test.
If the inclusion of a peaked noise component was not significant
(
and integrated over the range
0.01-1 Hz. Peaked noise was modelled using a Lorentzian. All power
spectra were initially fitted with only a power law. The significance of
adding a Lorentzian component to the fit was then estimated via an F-test.
If the inclusion of a peaked noise component was not significant
( )
we measured 90% confidence upper limits by using
)
we measured 90% confidence upper limits by using
 .
Errors on all parameters were measured using
.
Errors on all parameters were measured using
 .
When a fit was not sensitive to the centroid or FWHMof the Lorentzian (or was not significantly improved by its inclusion) we
fixed those parameters at values measured from other power spectra (the
actual values are shown in Table 2). We fitted each PC mode
power spectrum both with and without an extra free constant component. The
reasons for doing this are discussed in Sect. 4.3.
.
When a fit was not sensitive to the centroid or FWHMof the Lorentzian (or was not significantly improved by its inclusion) we
fixed those parameters at values measured from other power spectra (the
actual values are shown in Table 2). We fitted each PC mode
power spectrum both with and without an extra free constant component. The
reasons for doing this are discussed in Sect. 4.3.
All fractional rms amplitudes were corrected for channel cross-talk
(Lewin et al. 1992). We assumed variations at all energies were in
phase. Finally, the fractional rms values were multiplied by a binning
correction factor (van der Klis 1989).
4 Results
4.1 Hardness-intensity diagrams
Figure 1 shows a HID for all Sect. B data. The small,
approximately vertical NB is clearly visible. Sco X-2 is known to
flare to intensities roughly twice the level of the persistent emission.
The highest intensity in Fig. 1 is a factor of 2.2 greater
than the lowest intensity: we conclude therefore, that we have observed a
fully developed flaring branch. The results from Sect. C are compatible
with those from Sect. B; however due to the uncertain energy ranges of
those data, we will not discuss them any further.
![\begin{figure}
\par\includegraphics[angle=-90,width=8.8cm,clip]{H2493F1.ps}\end{figure}](/articles/aa/full/2001/17/aah2493/Timg15.gif) |
Figure 1:
HID of Sect. B, with 64 s averages.
The intensity is the counting rate in the range 1.1-16.7 keV. The
hardness is thecounting rate ratio between 8.2-16.7 keV and 5.8-8.2 keV.
The error bars are slightly larger than the dots |
| Open with DEXTER |
A HID of sections A and D is shown in Fig. 2. The lowest
and highest intensities in Fig. 2 differ by a factor of
2; therefore (in comparison with Fig. 1), nearly all of
the FB was traced out. No clear NB/FB vertex is apparent (but we were able
to estimate where it might lie; see Sect. 4.3). When we
constructed a HID from MPC3 mode data using energy bands similar to those
available in PC mode, the presence of the NB was much less pronounced; the
NB became more like a "blob'', rather than a clear branch. Therefore we
caution that in Fig. 2 we cannot confidently distinguish
between data points from the lower NB (if there are any) and those actually
in the lower FB. However, as will be seen in Sect. 4.3, our main
interest (with the PC data) is with the top half of the FB, so this
ambiguity is not a major problem.
![\begin{figure}
\par\includegraphics[angle=-90,width=8.8cm,clip]{H2493F2.ps}\end{figure}](/articles/aa/full/2001/17/aah2493/Timg16.gif) |
Figure 2:
HID of Sects. A and D, with 64 s averages.
The intensity is the counting rate in the range 1.2-17.9 keV. The
hardness is the counting rate ratio between 5.7-17.9 keV and
1.2-5.7 keV. The error bars are slightly larger than the dots |
| Open with DEXTER |
4.2 Timing analysis of section B MPC3 mode data
During the observations in MPC3-H mode, the source was found only in the
lower FB. We divided the data into two segments with mean ranks
 and
and
 .
An example of a power spectrum
(1.1-16.7 keV) is shown in Fig. 3, with mean rank number
1.09. The results of fitting the MPC3-H data (1.1-16.7 keV) are shown in
Table 2. The FWHM of the best-fit Lorentzian is greater than
half its centroid frequency, so the feature cannot be formally described as
a QPO. The MPC3-H data show that there is no significant change in the
centroid frequency or FWHM of the peaked noise, as the source moves up the
FB (the decrease in the centroid frequency between rank numbers 1.09 and
1.26 is significant only at the 2
.
An example of a power spectrum
(1.1-16.7 keV) is shown in Fig. 3, with mean rank number
1.09. The results of fitting the MPC3-H data (1.1-16.7 keV) are shown in
Table 2. The FWHM of the best-fit Lorentzian is greater than
half its centroid frequency, so the feature cannot be formally described as
a QPO. The MPC3-H data show that there is no significant change in the
centroid frequency or FWHM of the peaked noise, as the source moves up the
FB (the decrease in the centroid frequency between rank numbers 1.09 and
1.26 is significant only at the 2  level). The fractional
rms amplitude of the peaked noise is also consistent with remaining
constant.
level). The fractional
rms amplitude of the peaked noise is also consistent with remaining
constant.
![\begin{figure}
\par\includegraphics[angle=-90,width=8.8cm,clip]{H2493F3.ps}\end{figure}](/articles/aa/full/2001/17/aah2493/Timg20.gif) |
Figure 3:
MPC3-H power spectrum from the energy range1.1-16.7 keV. The
mean rank is 1.09 (lower FB). The solid line shows the best fit |
| Open with DEXTER |
Table 2:
Results from fits to the Sect. B MPC3 power spectra from the
energy range 1.1-16.7 keV
|
![\begin{threeparttable}\begin{tabular}{ccccccc} \hline\\ [-3mm]
Mean Rank & \mul...
...begin{tablenotes}
\item[a] Fixed parameter.
\end{tablenotes}\end{threeparttable}](/articles/aa/full/2001/17/aah2493/img21.gif) |
We investigated the energy dependence of the peaked noise fractional rms,
by calculating energy resolved power spectra from the MPC3-H data. We used
four energy bands: 1.1-3.4-5.8-8.2-16.7 keV. All power spectra from a
particular band were averaged together, giving a mean power spectrum from
the lower FB; the mean rank number was
 .
We determined the
centroid frequency and FWHM of the peaked noise feature from an average
power spectrum from the 1.1-16.7 keV band: they were 6.7
.
We determined the
centroid frequency and FWHM of the peaked noise feature from an average
power spectrum from the 1.1-16.7 keV band: they were 6.7 0.4 Hz and
8.3
+1.2-1.1 Hz respectively. The centroid and width were fixed at
those values when fitting the power spectra from the other four energy
bands. The energy dependence of peaked noise fractional rms is shown in
Table 3. The peaked noise is clearly stronger at higher
energies and is consistent with being constant above 6 keV.
0.4 Hz and
8.3
+1.2-1.1 Hz respectively. The centroid and width were fixed at
those values when fitting the power spectra from the other four energy
bands. The energy dependence of peaked noise fractional rms is shown in
Table 3. The peaked noise is clearly stronger at higher
energies and is consistent with being constant above 6 keV.
The MPC3-M data from the track shown in Fig. 1 were
divided into eight segments. Power spectra were averaged on the basis of
rank number. An example (1.1-16.7 keV) is shown in Fig. 4,
with mean rank number 1.09. Table 2 shows the results of
fitting the MPC3-M power spectra (1.1-16.7 keV) from Sect. B. It was
only in the lower FB that we could meaningfully constrain the centroid and
width of the peaked noise, which were 4 Hz and 6 Hz
respectively. There is no significant change in those values between mean
ranks 1.09 and 1.27 (Table 2). The centroid frequency is
lower in the MPC3-M data than in the MPC3-H data. This discrepancy is
probably due to a lack of information above 8 Hz in the MPC3-M data.
![\begin{figure}
\par\includegraphics[angle=-90,width=8.8cm,clip]{H2493F4.ps}\end{figure}](/articles/aa/full/2001/17/aah2493/Timg24.gif) |
Figure 4:
MPC3-M power spectrum from the energy range1.1-16.7 keV. The
mean rank is 1.09 (lower FB). The solid line shows the best fit |
| Open with DEXTER |
The dependence of peaked noise and VLFN fractional rms on rank number is
shown in Figs. 5 and 6 respectively.
The peaked noise fractional rms is greatest in the lower FB and becomes
undetectable (upper limit 1.3%) by about halfway up the FB. Of note is
the fact that it is actually detectable up to a mean rank of 1.41.
(This is important because N/FBO typically become undetectable by
10% of the way up the FB.) The drop in power as the source moves
further up the FB or into the NB may be due to the feature moving above the
Nyquist frequency of these data; however we can exclude this effect with
respect to movement up the FB (see Sect. 4.3). The VLFN
fractional rms is seen to increase as the source moves up the FB, as
expected for Z sources (HK). The slope of the power law appears to be
uncorrelated with rank number.
![\begin{figure}
\par\includegraphics[angle=-90,width=8.8cm,clip]{H2493F5.ps}\end{figure}](/articles/aa/full/2001/17/aah2493/Timg25.gif) |
Figure 5:
Peaked noise fractional rms values as a function of rank number
for the MPC3-M data (solid dots, 1.1-16.7 keV), and PC data (open squares,
1.2-17.9 keV). The fractional rms values of the PC data are from fits
which included a constant component |
| Open with DEXTER |
Table 3:
Energy dependence of peaked noise fractional rms amplitude
| Energy Range (keV) |
rms (%) |
1.1-3.4 |
<2.8 |
| 3.4-5.8 |
<2.6 |
| 5.8-8.2 |
4.2
+0.3-0.4 |
| 8.2-16.7 |
4.8
+0.4-0.5 |
![\begin{figure}
\par\includegraphics[angle=-90,width=8.8cm,clip]{H2493F6.ps}\end{figure}](/articles/aa/full/2001/17/aah2493/Timg26.gif) |
Figure 6:
VLFN fractional rms values as a function of rank number for the
MPC3-M data (solid dots, 1.1-16.7 keV), and PC data (open squares,
1.2-17.9 keV). The fractional rms values of the PC data are from fits
which included a constant component |
| Open with DEXTER |
4.3 Timing analysis of PC mode data
The NB/FB vertex was not unambiguously observed, so we did not calculate
rank numbers for each individual interval; averaging was done on the basis
of intensity. The track was divided into four segments; the intensity
ranges were: 2800-3200, 3200-3900, 4500-5200 and 5200-5900 count/s
(four detectors only). The mean intensities of those four segments were:
 ,
,
 ,
,
 and
and
 counts/s. We could,
however, estimate rank numbers by comparing Fig. 2 with
Fig. 1 (assuming the intensities are derived from the same
energy band). As stated in Sect. 4.1, the track shown in
Fig. 2 is not quite a complete FB. The lowest intensity
observed in Fig. 2 is 2900 counts/s; this can be
taken as the upper limit of the intensity of the NB/FB vertex.
Alternatively, if we assume the highest intensity present in
Fig. 2 is actually the top of the FB, then the unseen
NB/FB vertex can be placed at 2780 counts/s; this can be considered
to be the lower limit. By considering these two extremes we calculated the
approximate rank numbers of the four segments as: 1.06, 1.20, 1.68, and
1.80 (0.03). We stress that these rank numbers are only a rough
guide, and that the lower FB in Fig. 2 may in fact contain
data from the NB.
counts/s. We could,
however, estimate rank numbers by comparing Fig. 2 with
Fig. 1 (assuming the intensities are derived from the same
energy band). As stated in Sect. 4.1, the track shown in
Fig. 2 is not quite a complete FB. The lowest intensity
observed in Fig. 2 is 2900 counts/s; this can be
taken as the upper limit of the intensity of the NB/FB vertex.
Alternatively, if we assume the highest intensity present in
Fig. 2 is actually the top of the FB, then the unseen
NB/FB vertex can be placed at 2780 counts/s; this can be considered
to be the lower limit. By considering these two extremes we calculated the
approximate rank numbers of the four segments as: 1.06, 1.20, 1.68, and
1.80 (0.03). We stress that these rank numbers are only a rough
guide, and that the lower FB in Fig. 2 may in fact contain
data from the NB.
An example power spectrum is shown in Fig. 7
(1.2-17.9 keV), with mean intensity 3041 counts/s (mean rank number
1.06). The results from fitting the PC power spectra (1.2-17.9 keV)
are shown in Table 4, where we present the fits from models
both with and without a constant. The results from fits with a constant
are shown also in Figs. 5 and 6. The
most important thing to note is the nondetection of peaked noise in the
upper FB (upper limit 1.6%). The PC data Nyquist frequency is 256 Hz;
therefore the nondetection of peaked noise in these data is not due only to
the feature moving to higher frequencies. From this, we conclude that the
nondetection of peaked noise in the MPC3-M data (Table 2) is
also a real weakening of the peak.
Table 4:
Results from fits to the PC power spectra from the energy range
1.2-17.9 keV
|
![\begin{threeparttable}\begin{tabular}{cccccccc} \hline\\ [-2mm]
Mean Intensity&...
...begin{tablenotes}
\item[a] Fixed parameter.
\end{tablenotes}\end{threeparttable}](/articles/aa/full/2001/17/aah2493/img31.gif)
|
The reduced s of the fits without a constant in
Table 4 are formally acceptable; however visual inspection
of the power spectra revealed excess power above about 100 Hz (e.g. see
Fig. 7), and the best-fit VLFN indices found in the two
lowest intensity segments are unusually flat. Given these indications, we
attempted to account for a possible high frequency feature. We added a
cut-off power law to our model and attempted to fit the spectrum from the
lowest intensity segment. We could not constrain the index or cut-off
frequency of this component. When we fitted a Lorentzian (instead of the
cut-off power law) to the same spectrum we could constrain neither the
width nor centroid frequency. The fits were improved with the addition of
the extra component, but were not sensitive to the exact form of that
component. We fitted the spectrum with a constant (instead of a cut-off
power law or Lorentzian) and the fit also improved. None of the best-fit
values of the peaked noise or VLFN were sensitive to the type of model that
we used to describe the excess power; for simplicity, we therefore chose to
use a constant.
In the three highest intensity segments, the inclusion of a constant
significantly improved the fits (determined via an F-test for the inclusion
of the extra component). Furthermore, in the segment with mean intensity
3458 counts/s, fitting without a constant resulted only in determining an
upper limit on the peaked noise of <3.1% (Table 4).
This upper limit is rather large, and a visual inspection of the power
spectrum showed peaked noise to be present. Therefore, it seems justified
to include an extra component in the fits, without needing (nor being able)
to describe the actual form of the possible higher frequency feature. We
note that: HFN was reported in Sco X-2, with cut-off frequencies
of 66 Hz and 41 Hz in the NB and FB respectively (HK); also a QPO with a
frequency of 125 Hz and FWHM of 30 Hz was detected by
Penninx et al. (1990), in the FB of GX 17+2.
The fact that we cannot determine the form of the higher frequency feature
is not a major problem. The main result we obtained from the PC data is
this: the peaked noise feature experienced a real weakening in the upper
FB. This result is not sensitive to the presence or otherwise of a higher
frequency feature.
![\begin{figure}
\par\includegraphics[angle=-90,width=8.8cm,clip]{H2493F7.ps}\end{figure}](/articles/aa/full/2001/17/aah2493/Timg32.gif) |
Figure 7:
PC power spectrum from the energy range1.2-17.9 keV. The
mean intensity is 3041 counts/s (mean rank number 1.06; lower FB).
The solid line shows the best fit, and includes a constant component |
| Open with DEXTER |
5 Discussion
5.1 Observed properties of Sco X-2
We were able to trace the power spectral features of Sco
X-2 as a
function of position in the Z track, in the energy range 1-17 keV.
At no time did we detect a narrow N/FBO as found in Sco X-1.
Broad peaked noise was present at 4-7 Hz, with
 Hz.
We will subsequently refer to this feature as flaring branch noise (FBN).
FBN was detected in the lower NB and reached a maximum at rank number 1.09
(10% of the way up the FB). At its maximum, the fractional rms
was 3%. It then became weaker and was undetectable by rank
number 1.5 (the middle of the FB; upper limit 1.3%). We found no
significant change (more than a few Hz) in the centroid frequency or FWHMas the source moved up the FB. The FBN was stronger at higher energies.
Hz.
We will subsequently refer to this feature as flaring branch noise (FBN).
FBN was detected in the lower NB and reached a maximum at rank number 1.09
(10% of the way up the FB). At its maximum, the fractional rms
was 3%. It then became weaker and was undetectable by rank
number 1.5 (the middle of the FB; upper limit 1.3%). We found no
significant change (more than a few Hz) in the centroid frequency or FWHMas the source moved up the FB. The FBN was stronger at higher energies.
The behaviour we have observed is very similar to that reported by
Ponman et al. (1988). In addition, we have been able to
unambiguously separate NB data from lower FB data. The increase in the
fractional rms that accompanied movement from the NB through to the lower
FB, was also seen in the RXTE data of KK. We have not been able to confirm
the decrease that they observed in the centroid frequency and FWHM, which
accompanied that transition.
5.2 Comparison with other power spectral features
The fast-time variability of Sco X-2 is different to that seen in
the other Z sources. Most obvious is the low coherence of FBN when
compared with N/FBOs. The FBN has a relative width of 1-2, compared
with the N/FBO in Sco X-1 which has a relative width of less than
0.5 (Dieters & van der Klis 2000). Also in Sco X-1,
the frequency and FWHM of the NBO increase with increasing inferred mass
accretion rate, and there is a sudden jump in frequency at the NB/FB
vertex. In Sco X-2 on the other hand, there is a decrease in the
FBN centroid frequency and FWHM with movement through the vertex (KK). In
Sco X-1 the NBO strength increases with increasing rank number;
the NBO becomes indistinguishable from the underlying noise (by
10% of the way up the FB) because the FWHM increases. In
comparison, FBN is strongest at about 10% of the way up the FB, and
becomes undetectable because of a subsequent decrease in the fractional
rms.
Even given the marked differences, there are some similarities between FBN
and the N/FBO seen in Sco X-1: the centroid frequencies are
similar, both the N/FBO and FBN are hard, and there is no time lag between
the soft and hard energies in either phenomenon. In Sco X-1, the
NB/FB vertex is a critical position in the Z track. In Sco X-2
there are hints that this may also be true, although in a different sense
(i.e. frequency jump for NBOs compared with a frequency fall
for FBN). FBN and Z source N/FBOs may still be related, as already
suggested by KK.
In the scheme of the unified model, radiation pressure drives matter up out
of the disc, forming an inner disc corona, resulting in a radial inflow
(Lamb 1991; Psaltis et al. 1995). When
rises to
within 20% of the Eddington limit, radial oscillations in the
optical depth of the inflowing material produce a rocking of the X-ray
spectrum; this gives rise to NBOs (Fortner et al. 1989;
Miller & Park 1995). This model may explain the evolution of the
N/FBO seen in Sco X-1, but it does not do well in explaining FBN.
The FBN centroid frequency does not increase as predicted by the model.
Furthermore, we have detected it 40% of the way up the FB;
oscillations are predicted to be suppressed at such high accretion rates.
QPOs at super-Eddington accretion rates have been observed before:
Kuulkers & van der Klis (1995b) observed a 26 Hz QPO in the
upper FB of Cyg X-2. The QPO was observed during an intensity dip
in the FB, and it was stronger at lower energies. They suggested that it
is produced by oscillations in an inner disc torus, and it is observable
because Cyg X-2 is viewed at a high inclination (see
Sect. 5.3). Sco X-2, on the other hand, is thought to
be viewed at a low inclination (see Sect. 5.3); therefore it is
unlikely that FBN is related to the 26 Hz QPO.
KK pointed out that the FBN seen in Sco X-2 looks similar to
peaked HFN sometimes seen in atoll sources. We observed a decrease
in the FBN fractional rms as the source moved up the NB, which is opposite
to what would be expected if the FBN was infact atoll source HFN. The low
Nyquist frequency is no problem here as the break frequency of HFN
decreases with decreasing inferred mass-accretion rate
(Wijnands & van der Klis 1999). The phenomenology of FBN is thus
significantly different to atoll source HFN; therefore we propose that FBN
is unrelated to atoll source HFN.
5.3 Two types of Z sources: A clue to the origin of FBN?
In order to understand why Sco X-2 behaves so differently, it is
worthwhile to investigate the general relationships that exist between the
Z sources. On the basis of their Z track morphology and fast-time
variability, they can be divided into two groups: Cyg X-2,
GX 5-1, GX 340+0 (Cyg-like objects); and
Sco X-1, Sco X-2, GX 17+2 (Sco-like objects)
(e.g. Kuulkers et al. 1997). The Cyg-like sources have much larger
HBs and smaller FBs than the Sco-like sources. The HBs in the Sco-like
objects are slanted, while the HBs in the Cyg-like sources are horizontal.
Most importantly, in the Cyg-like objects the intensity is seen to fall in
the middle and upper FB, while the Sco-like objects really do flare in the
FB.
At high accretion rates an inner disc torus may be produced, which in high
inclination sources can partly obscure the X-ray emitting region. The
Cyg-like objects have thus been interpreted as being viewed at higher
inclinations, and the Sco-like objects at lower inclinations
(Kuulkers et al. 1997). In support of this, optical observations
place Cyg X-2 at an inclination of
 (Orosz & Kuulkers 1999), Sco X-1 at 15
 -40
(Crampton et al. 1976), and also suggest that Sco X-2 is
viewed at a low inclination (Wachter & Margon 1996).
Psaltis et al. (1995) have modelled the X-ray spectra of Z sources.
They suggested that the Sco-like objects have weaker magnetic fields than
the Cyg-like objects.
-40
(Crampton et al. 1976), and also suggest that Sco X-2 is
viewed at a low inclination (Wachter & Margon 1996).
Psaltis et al. (1995) have modelled the X-ray spectra of Z sources.
They suggested that the Sco-like objects have weaker magnetic fields than
the Cyg-like objects.
The most obvious difference between Sco X-2 and the other Z
sources is the absence of an HB, so it is tempting to think that either:
Sco X-2 has a weaker magnetic field than Sco X-1, while
also (perhaps incidentally) being viewed at a low inclination; or simply
that Sco X-2 never reaches a low enough mass-accretion rate to
trace out an HB.
A close investigation of the timing properties of Cyg X-2 may
provide hints as to the origin of FBN. In Cyg X-2 long-term
variations in the mean X-ray intensity have been discovered (e.g.
Paul et al. 2000). Ginga observations of Cyg X-2 showed
that the Z track was more Sco-like at medium level intensities, and more
Cyg-like at high level intensities (Wijnands et al. 1997). RXTE
observations of Cyg X-2 at low intensities revealed no NBO (upper
limit 1%) in the NB; however a peaked noise feature was detected
in the lower FB, with a frequency and fractional rms of 6-7 Hz and
3% respectively (Kuulkers et al. 1999). This is (perhaps
only superficially) similar to the FBN seen in Sco X-2.
It is vital to have more observations of Cyg X-2 at low
intensities so that we can better understand the properties of the peaked
noise feature. Only then can we make any conclusions about the
relationship between FBN and the Cyg X-2 peaked noise. But if the
two features are the same phenomenon, we must ask: what are the physical
characteristics of Cyg X-2 when it is at low level intensities?
The low level may be due to obscuration by the outer
accretion disc, possibly caused by a precessing disc
(e.g. Kuulkers et al. 1996).
Wijnands & van der Klis (2001) have argued against the precessing
disc model on the basis of differing kHz QPO properties at different
intensity levels. Kuulkers et al. (1999) showed that the relative
VLFN properties at different intensity levels were also inconsistent with
obscuration. Instead, they preferred a model in which the overall
intensity level is sensitive to the properties of the inner mass flow.
Whatever the case, if FBN and Cyg X-2 peaked noise are produced by
the same process, then that process will be largely insensitive to orbital
inclination. In this way, Sco X-2 may prove to be a useful tool
in discerning between models trying to explain the behaviour of
Cyg X-2, and ultimately the other Z sources.
6 Conclusions
We have carried out the first detailed study of the X-ray fast-time
variability of the Z source Sco X-2, as a function of position in
the Z track. We found broad peaked noise with centroid frequency and FWHMin the range 4-7 Hz and 6-12 Hz respectively. We find it
difficult to attribute FBN to the same processes which are able to explain
typical Z source N/FBOs. We also conclude that it is not a manifestation
of atoll source HFN. FBN resembles the peaked noise seen in the FB of
Cyg X-2 at low overall intensities. If these are later confirmed
to be the same phenomena, then the process responsible for FBN must be
largely insensitive to orbital inclination.
Acknowledgements
This research has made use of data obtained from the Leicester Database and
Archive Service at the Department of Physics and Astronomy, Leicester
University, UK. The reduction of raw data was carried out with support
from the Cooperative Research Centre for Advanced Computational Systems
established under the Australian Government's Cooperative Research Centres
Program. PMO wishes to thank the Space Research Organization Netherlands
for its hospitality, and is currently being supported by the Australian
Postgraduate Award scheme.
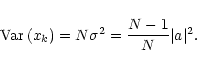
In the absence of deadtime, the white-noise level in a Leahy normalised
power spectrum, due to Poisson noise in the data, is equal to 2
(Leahy et al. 1983). The effect of deadtime is to decrease the
variance of the data and thus lower the white-noise level. The
deadtime-affected white-noise level for the sum channel
 ,
can be calculated for each frequency
,
can be calculated for each frequency  in the power
spectrum
in the power
spectrum
| |
|
  |
(A.1) |
where
 is the observed counting rate per detector,
 is the time resolution of the lightcurve,
 is the deadtime per event, and
 is the Nyquist frequency of each transform
(Weisskopf 1985).
is the Nyquist frequency of each transform
(Weisskopf 1985).
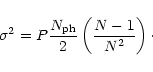
The deadtime-affected white-noise level for any particular energy band
 ,
can be calculated as a function of
.
For an arbitrary time interval, the ratio of the
total number of counts k in the particular energy band, to the total
number of counts n in the sum channel is denoted by r. The mean
variance of the data is denoted as
,
can be calculated as a function of
.
For an arbitrary time interval, the ratio of the
total number of counts k in the particular energy band, to the total
number of counts n in the sum channel is denoted by r. The mean
variance of the data is denoted as
 and
and
 for the sum channel and the particular energy
band respectively. These are related by (Mitsuda & Dotani 1989)
for the sum channel and the particular energy
band respectively. These are related by (Mitsuda & Dotani 1989)
 |
(A.2) |
Each transform is calculated from a time series xk (
k = 0,...,N-1)
consisting of N arbitrary time intervals. By employing Parseval's
theorem, we can relate the total variance
 (or the
mean variance
(or the
mean variance
 )
of the time series, and the Fourier amplitude
a
)
of the time series, and the Fourier amplitude
a
 |
(A.3) |
Here, we have considered only situations where the dependence of
Fourier amplitude on frequency is negligible (i.e. white-noise). The
factor of N-1 originates from the fact that the sum used in the expression
for the total variance does not include a term for a frequency of zero.
The mean variance
and Leahy power P can then be related via
 |
(A.4) |
Nph is equal to Nn for the sum channel or Nk for the
particular energy band. We can express
Pb as a function of
Ps by substituting Eq. (A.4) into Eq. (A.2)
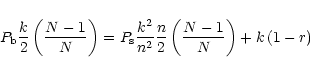 |
(A.5) |
or
 |
(A.6) |
which in the case of large N reduces to
 |
(A.7) |
- Cowley, A. P., & Crampton, D. 1975, ApJ, 201, L65
In the text
NASA ADS
- Crampton, D., Cowley, A. P., & Hutchings, J. B., et al.
1976, ApJ, 207, 907
In the text
NASA ADS
- Dieters, S. W., & van der Klis, M. 2000, MNRAS, 311, 201
In the text
NASA ADS
- Dieters, S. W., Vaughan, B. A., Kuulkers, E., et al.
2000, A&A, 353, 203
In the text
NASA ADS
- Fortner, B., Lamb, F. K., & Miller, G. S. 1989, Nature, 342,
775
In the text
NASA ADS
- Hasinger, G., & van der Klis, M. 1989, A&A, 225, 79
In the text
NASA ADS
- Hasinger, G., van der Klis, M., & Ebisawa, K. 1990,
A&A, 235, 131
In the text
NASA ADS
- Hertz, P., Vaughan, B., Wood, K. S., et al. 1992, ApJ,
396, 201
In the text
NASA ADS
- Kuulkers, E., & van der Klis, M. 1995a, Ann. New York
Ac. Sci., 759, 344
In the text
NASA ADS
- Kuulkers, E., & van der Klis, M. 1995b, A&A, 303, 801
In the text
NASA ADS
- Kuulkers, E., & van der Klis, M. 1998, A&A, 332, 845
In the text
NASA ADS
- Kuulkers, E., van der Klis, M., Oosterbroek, T., et al. 1994, A&A, 289, 795
In the text
NASA ADS
- Kuulkers, E., van der Klis, M., & Vaughan, B. A. 1996,
A&A, 311, 197
In the text
NASA ADS
- Kuulkers, E., van der Klis, M., Oosterbroek, T., et al. 1997, MNRAS, 287, 495
In the text
NASA ADS
- Kuulkers, E., Wijnands, R., & van der Klis, M. 1999,
MNRAS, 308, 485
In the text
NASA ADS
- Lamb, F. K. 1991, in Unified Model of X-ray Spectra and
QPOs in Low Mass Neutron Star Binaries,
Neutron Stars: Theory and Observation,
ed. J. Ventura, & D. Pines (Dordrecht, Kluwer Academic
Publishers), 445
In the text
- Leahy, D. A., Darbo, W., Elsner, R. F., et al. 1983,
ApJ, 266, 160
In the text
NASA ADS
- Lewin, W., Lubin, L., Tan, J., et al. 1992, MNRAS,
256, 545
In the text
NASA ADS
- Makino, F., & ASTRO-C Team 1987,
Astrophys. Lett. Communic., 25, 223
In the text
- Miller, G. S., & Park, M.-G. 1995, ApJ, 440, 771
In the text
NASA ADS
- Mitsuda, K., & Dotani, T. 1989, PASJ, 41, 557
In the text
NASA ADS
- Orosz, J. A., & Kuulkers, E. 1999, MNRAS, 305, 132
In the text
NASA ADS
- Paul, B., Kitamoto, S., & Makino, F. 2000, ApJ, 528,
410
In the text
NASA ADS
- Penninx, W., Lewin, W. H. G., & Mitsuda, K., et al.
1990, MNRAS, 243, 114
In the text
NASA ADS
- Ponman, T. J., Cooke, B. A., & Stella, L. 1988, MNRAS,
231, 999
In the text
NASA ADS
- Psaltis, D., Lamb, L., & Miller, G. 1995, ApJ, 454,
L137
In the text
NASA ADS
- Schultz, N. S., Hasinger, G., & Trümper, J. 1989,
A&A, 225, 48
In the text
NASA ADS
- Turner, M., Thomas, H., Patchett, B., et al. 1989,
PASJ, 41, 345
In the text
NASA ADS
- van der Klis, M. 1989, in Fourier Techniques in X-ray
Timing, Timing Neutron
Stars, ed. H. Ögelman, & E. van den Heuvel (Kluwer Academic Publishers, Dordrecht), 27
In the text
- van der Klis 1995, in Rapid Aperiodic Variability in
X-ray Binaries, ed. W. H. G. Lewin, J. van Paradijs, & E. P. J. van den Heuvel
(Cambridge University Press, Cambridge), 252
In the text
- van der Klis 2000, ARA&A, 38, 717 [astro-ph/0001167]
In the text
- Wachter, S. 1997, BAAS, 191, 4411
In the text
- Wachter, S., & Margon, B. 1996, AJ, 112, 2684
In the text
NASA ADS
- Weisskopf, M. C. 1985, talk presented at workshop on
Time Variability in X-ray and Gamma-Ray Sources, Taos, New Mexico
In the text
- Wijnands, R., & van der Klis, M. 1999, ApJ, 514, 939
In the text
NASA ADS
- Wijnands, R., & van der Klis, M. 2001, MNRAS, 321, 537
In the text
NASA ADS
- Wijnands, R. A. D., van der Klis, M., & Kuulkers, E., et al. 1997, A&A, 323, 399
In the text
NASA ADS
Copyright ESO 2001
![\begin{figure}
\par\includegraphics[angle=-90,width=8.8cm,clip]{H2493F1.ps}\end{figure}](/articles/aa/full/2001/17/aah2493/img15.gif)
![\begin{figure}
\par\includegraphics[angle=-90,width=8.8cm,clip]{H2493F2.ps}\end{figure}](/articles/aa/full/2001/17/aah2493/img16.gif)
![\begin{figure}
\par\includegraphics[angle=-90,width=8.8cm,clip]{H2493F3.ps}\end{figure}](/articles/aa/full/2001/17/aah2493/img20.gif)
![\begin{figure}
\par\includegraphics[angle=-90,width=8.8cm,clip]{H2493F4.ps}\end{figure}](/articles/aa/full/2001/17/aah2493/img24.gif)
![\begin{figure}
\par\includegraphics[angle=-90,width=8.8cm,clip]{H2493F5.ps}\end{figure}](/articles/aa/full/2001/17/aah2493/img25.gif)
![\begin{figure}
\par\includegraphics[angle=-90,width=8.8cm,clip]{H2493F6.ps}\end{figure}](/articles/aa/full/2001/17/aah2493/img26.gif)
![\begin{figure}
\par\includegraphics[angle=-90,width=8.8cm,clip]{H2493F7.ps}\end{figure}](/articles/aa/full/2001/17/aah2493/img32.gif)