A&A 370, L35-L38 (2001)
DOI: 10.1051/0004-6361:20010331
K. Szegö 1 - J. F. Crifo 2 - L. Földy 1 - J. S. V. Lagerros 3 - A. V. Rodionov 4
1 - KFKI Research Institute for Particle and
Nuclear Physics, PO Box 49, 1525 Budapest, Hungary
2 -
Service d'Aéronomie du CNRS, BP 3, 91371 Verrières le Buisson
Cedex, France
3 -
Institute for Astronomy and Space Physics, Box 515, 75237 Uppsala, Sweden
4 -
Central Research Institute on Machine Building
(TsNIIMASCH), Pionyerskaya St., 4 Korolev,
Moscow Region 141070, Russia
Received 12 February 2001 / Accepted 7 March 2001
Abstract
We revisit the rotation of P/Halley taking into account the most
essential observational constraints, as well as the external
torques affecting the nucleus, in particular the outgassing
torque. We solve the dirty ice sublimation equations at each point
of the sunlit surface, using, for the first time, the surface
shape derived from the 1986 flybys imaging data. We assume that
the nuclear surface is homogeneous in composition, thus reducing
the number of model free parameters to one only: the dust-to-ice
ratio on the surface. Our derived rotation model is a short-axis
mode; it is consistent both with the 1986 nucleus
imaging data, with the estimated non gravitational force, and with
the observed time variations of the nucleus production rates. The
outgassing torque results in a significant variation of the angular
momentum vector - for the assumed nucleus density of 0.5 g/cm3.
Key words: comets: P/Halley - rotation mode - data analysis
The rotation of comet P/Halley has been a matter of debate since its last apparition in 1986. Different data sets and methods of analysis have led to the derivation of conflicting modes of rotation, with conflicting dominant periods, one centred around 2.2 d, the other around 7.4 d or its harmonics, see e.g. Julian (1990, 2000) and references therein. These discrepancies have never been resolved; the authors of the different publications simply dismissed observational evidences that did not support their views. Even though the shape of the nucleus and the orientation of its long axis were derived quite precisely from the images taken during the encounter of the VEGA-1 space probe with comet Halley, these constraints were neglected in many works dedicated to the nucleus rotation. Similarly, it was not investigated whether the postulated nucleus activity is in agreement with the near-nucleus dust patterns observed during the flybys. Finally, the effect of the torque due to the outgassing of the nucleus and to the solar tide were seldom considered. In this brief report we revisit the rotation of the nucleus of comet P/Halley based on the approach of Crifo (1997) and Rodionov et al. (2001), which takes into account these effects self-consistently.
We solve numerically the equations of motion of P/Halley's nucleus, taken to be an asymmetric rigid top, and taking into account the torque due to the gas rocket forces (Rodionov et al. 2001), and the solar tidal torque (Schutz 1981). To compute the value of the torque due to outgassing, we solve the dirty ice sublimation equations at each point of the sunlit surface, with the assumption that the icy area fraction, that is the ratio between the dust and ice on the surface, is everywhere f = 0.6(Crifo 1997). This assumption that the nuclear surface is homogeneous is consistent with that of internal homogeneity done when computing the nucleus inertia. Furthermore, as reported in Rodionov et al. (2001), it has proven successful in accounting quantitatively for the positions of the dust "jets'' seen in Halley's coma by the Giotto and VEGA cameras: these "jets'' are found to be in fact the consequences of topography-induced azimuthal gas density gradients. Our model also yields the water production rates in a self consistent manner. The assumption that the nucleus is rigid has no effect on our results, because it has been shown that the damping of the rotation due to non-rigidity goes on a time scale of 106 years (Harris 1994).
We use the nucleus shape model derived by Merenyi et al.
(1990) to calculate the nucleus inertia and torque. This
nucleus model is based on the 63 images obtained during the
closest portion of the VEGA-1 flyby; their most important
parameters are listed in Szegö et al. (1995). The
one-pixel resolution on the images varies between
![]() m
to
m
to
![]() m. Realistically, however, a two-pixel
resolution must be used, taking
into account uncertainties due to dust contamination; accordingly,
the size determination is not more accurate than
0.5 km. The three-dimensional nucleus model derived has the following major
characteristics: the overall dimensions are 7.2 km, 7.22 km, 15.3 km, its
volume is 365 km3, the ratios of the inertial momenta are 3.4:3.3:1
assuming a homogeneous mass distribution inside. The longest inertial axis
is slightly inclined to the geometrical axis of the body,
m. Realistically, however, a two-pixel
resolution must be used, taking
into account uncertainties due to dust contamination; accordingly,
the size determination is not more accurate than
0.5 km. The three-dimensional nucleus model derived has the following major
characteristics: the overall dimensions are 7.2 km, 7.22 km, 15.3 km, its
volume is 365 km3, the ratios of the inertial momenta are 3.4:3.3:1
assuming a homogeneous mass distribution inside. The longest inertial axis
is slightly inclined to the geometrical axis of the body,
![]() in
latitude and
in
latitude and
![]() in longitude, but this deviation is within the
limit of the accuracy of the model. For its mass, assuming about 0.5 g/cm3 density, we take
in longitude, but this deviation is within the
limit of the accuracy of the model. For its mass, assuming about 0.5 g/cm3 density, we take
![]() kg, hence the magnitude of the
inertial momenta Ii are of the order of 1021 kgm2. The
torque
kg, hence the magnitude of the
inertial momenta Ii are of the order of 1021 kgm2. The
torque ![]() is a function of the position of the subsolar
point, its magnitude is of the order of
is a function of the position of the subsolar
point, its magnitude is of the order of ![]() kgm2s-2.
kgm2s-2.
In our analysis of the rotation we use a cometocentric ecliptic
coordinate system: its x-y plane is parallel to the ecliptic
plane, its x-axis is parallel to the vernal equinox line, and
its z-axis points to the ecliptic north. The angles l and bare the longitude and latitude angles, respectively; l is
measured in the ecliptic plane, from the x-axis
counterclockwise; b is measured from the ecliptic plane. We
define a third angle, the roll, denoted by r, as the rotation
angle around the l, b direction. We have solved
Eqs. (1) and (2)
that govern the rotation of an asymmetric top (Landau & Lifshitz 1976).
The first set of Eq. (1) is
written in the body frame system of reference of the nucleus (ISN) in which the
unit vectors ![]() of the inertial system are oriented along the
axes of the inertial ellipsoid in such a way that
of the inertial system are oriented along the
axes of the inertial ellipsoid in such a way that ![]() is along the
direction of smallest inertia momentum and
is along the
direction of smallest inertia momentum and ![]() along that of largest;
along that of largest; ![]() points towards the "bigger end'' of the nucleus. The second set of
Eqs. (2) describes the motion of the inertial triad (i.e. the set
of the
points towards the "bigger end'' of the nucleus. The second set of
Eqs. (2) describes the motion of the inertial triad (i.e. the set
of the ![]() vectors) in the cometocentric ecliptic system of
reference (CES):
vectors) in the cometocentric ecliptic system of
reference (CES):
The outgassing torque ![]() acting on the nucleus is defined
by:
acting on the nucleus is defined
by:
 |
(3) |
Equation (2) can be written in a simpler form using the fact that
[![]() ,
,
![]() ,
,
![]() ]
form an orthonormal
system, that is only 3 variables are independent; these can be
conveniently the b, l, r angular parameters described above.
However, the numerical solution appears to be more stable if
Eq. (2) is integrated directly for all nine components of
]
form an orthonormal
system, that is only 3 variables are independent; these can be
conveniently the b, l, r angular parameters described above.
However, the numerical solution appears to be more stable if
Eq. (2) is integrated directly for all nine components of
![]() ,
making sure at the same time that the system
remains orthonormal.
,
making sure at the same time that the system
remains orthonormal.
It would have been easy to solve these equations had we had
appropriate initial conditions (
![]() or b, l, r). Instead we
used as constraints the
orientations of the nucleus long axis as derived from the flyby images
(Sagdeev et al. 1989); and we tried different initial conditions
or b, l, r). Instead we
used as constraints the
orientations of the nucleus long axis as derived from the flyby images
(Sagdeev et al. 1989); and we tried different initial conditions
![]() for a 20 days long period starting on March 4.34, 1986,
centred close to the Vega 2 encounter; we
varied the ratios of the inertial momenta as well.
To illustrate this, for the initial value
for a 20 days long period starting on March 4.34, 1986,
centred close to the Vega 2 encounter; we
varied the ratios of the inertial momenta as well.
To illustrate this, for the initial value
![]() ,
-0.2, -2.8)
and inertial ratios (1:3.4:3.5) the
,
-0.2, -2.8)
and inertial ratios (1:3.4:3.5) the ![]() values obtained for the
VEGA 1 and Giotto encounters were (78.3, 16.1, 0.9) and (275.6, -13.6,
28.4), respectively; whereas for
values obtained for the
VEGA 1 and Giotto encounters were (78.3, 16.1, 0.9) and (275.6, -13.6,
28.4), respectively; whereas for
![]() (-.44, -0.3, -2.8) and
inertia ratios (1.3:2.7:2.83) we got for
(-.44, -0.3, -2.8) and
inertia ratios (1.3:2.7:2.83) we got for ![]() (79.7, 14.0, -1.6) and (272.7, -15.6,
15.3), respectively. We selected the second one, the best approximation to the
imaging data. All solutions were short-axis mode
rotations; the rotation period about the short axis was very
stable, about 1% variation could be
seen during one period. The change in the periodicity of b and
r was larger, about 10% during one period. In the magnitude
of the production rate these variations caused not more than 5%
changes, and the variation of the initial conditions did not have
sizeable effects on the results presented below.
(79.7, 14.0, -1.6) and (272.7, -15.6,
15.3), respectively. We selected the second one, the best approximation to the
imaging data. All solutions were short-axis mode
rotations; the rotation period about the short axis was very
stable, about 1% variation could be
seen during one period. The change in the periodicity of b and
r was larger, about 10% during one period. In the magnitude
of the production rate these variations caused not more than 5%
changes, and the variation of the initial conditions did not have
sizeable effects on the results presented below.
The variation of the angular momentum vector in the cometocentric
ecliptic coordinate system is shown in Fig. 1. The first
important conclusion is that the torque has a significant effect
on the motion. The magnitude of the angular momentum
changes in 20 days by about 0.5%, its direction in l changes from about
![]() to
to
![]() ,
in b from
,
in b from
![]() to
to
![]() .
These variations are of the same order as those
reported in Julian (1990), with the important difference
that in previous publications this effect was attributed to gas
jets placed arbitrarily on the surface, whereas in our approach
this is the effect of the deterministically computed gas emission. It
follows from the rate of change of the longitudinal component of
.
These variations are of the same order as those
reported in Julian (1990), with the important difference
that in previous publications this effect was attributed to gas
jets placed arbitrarily on the surface, whereas in our approach
this is the effect of the deterministically computed gas emission. It
follows from the rate of change of the longitudinal component of
![]() that the stability of the spin vector of P/Halley should
be considered with certain reservations. The corollary is that the
analysis of the rotation of small but active cometary nuclei also
require certain care, especially in the case of small but active
nuclei such as e.g. comet Wirtanen: in such cases, the rotation
can easily be chaotic. In the current calculation the ratio of the
average torque to the inertial momenta is about 10-11. As the
inertial momenta scales with the size of the nucleus as r5 and
the torque as r2, this ratio can be huge for a Wirtanen-size
comet e.g. on Halley's orbit, and the effects of outgassing must
be dominant in setting the rotation mode. This is also true for
many other comets as was pointed out by Samarasinha et al.
(1996); we shall return to this problem in a separate
publication.
that the stability of the spin vector of P/Halley should
be considered with certain reservations. The corollary is that the
analysis of the rotation of small but active cometary nuclei also
require certain care, especially in the case of small but active
nuclei such as e.g. comet Wirtanen: in such cases, the rotation
can easily be chaotic. In the current calculation the ratio of the
average torque to the inertial momenta is about 10-11. As the
inertial momenta scales with the size of the nucleus as r5 and
the torque as r2, this ratio can be huge for a Wirtanen-size
comet e.g. on Halley's orbit, and the effects of outgassing must
be dominant in setting the rotation mode. This is also true for
many other comets as was pointed out by Samarasinha et al.
(1996); we shall return to this problem in a separate
publication.
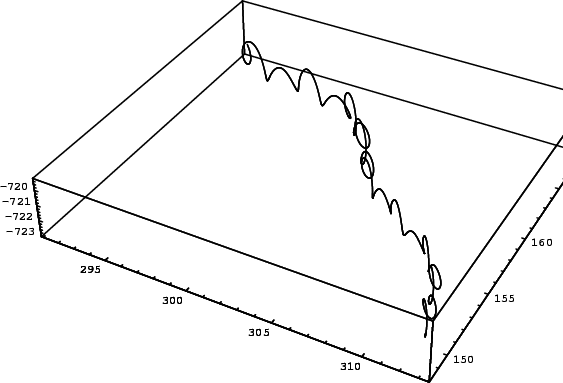 |
Figure 1:
Variation of the end-point of |
| Open with DEXTER | |
To investigate whether our outgassing model is compatible with the
non-gravitational perturbations of P/Halley's orbit, we have calculated the
non-gravitational forces acting on the nucleus due to this outgassing.
This is illustrated in Fig. 2 for the force acting along the orbit
(force associated with A2), the average deceleration/acceleration is ![]() N. Taking the above model parameters, this corresponds to A2
N. Taking the above model parameters, this corresponds to A2
![]() m s-2 for this orbital segment. From astronomical
observations, calculating A2 for the whole orbit, Rickman et al.
(1987) for P/Halley have derived A2 =
m s-2 for this orbital segment. From astronomical
observations, calculating A2 for the whole orbit, Rickman et al.
(1987) for P/Halley have derived A2 =
![]() m s-2.
m s-2.
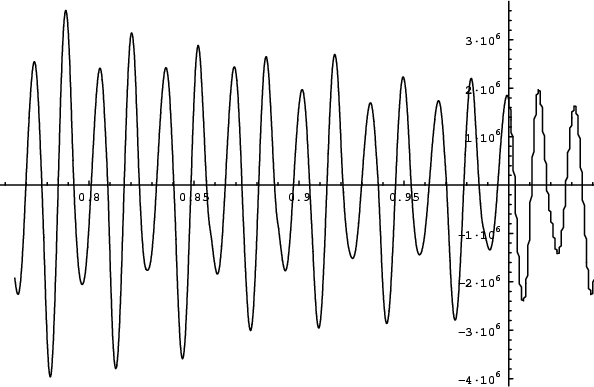 |
Figure 2: Non-gravitational force along orbital motion. The horizontal axis shows the heliocentric distance of the nucleus in AU, the vertical axis shows the force in N |
| Open with DEXTER | |
Next, we have investigated whether the computed H2O production
rate is compatible with the production rate observed from ground.
In the absence of water production rate data we use other
coma species. A compilation of the ground based narrowband
photometry data was published by Schleicher et al.
(1998) for OH, NH, CN, C3, C2 production
rates, and for dust using ![]() values in two spectral
intervals. This data set overlaps for a 14 day long period with
our calculations. In Fig. 3 we plot these OH, C2,
and dust production rates, normalised to the same average value.
Whereas there is a scatter in the numerical values, the major
tendencies are similar, the normalised correlations between
OH-dust, OH-C2, and C2-dust data are 0.78, 0.93, and 0.87,
respectively. (We have specifically selected C2, because
Millis & Schleicher 1986, in their
famous paper identified a 7.4 d period in the C2 emission
band.) The large scatter in the observed production rates shown in
Fig. 4 might be due to the different physical and chemical
processes involved in the production of these species; we suspect,
however, that the major problem is the use of a time-independent,
spherically symmetric, collisionless model (i.e. the Haser model)
for data reduction, which introduces large uncertainties in the
interpretation.
During the time interval we are interested in, the
phase angle changed from
values in two spectral
intervals. This data set overlaps for a 14 day long period with
our calculations. In Fig. 3 we plot these OH, C2,
and dust production rates, normalised to the same average value.
Whereas there is a scatter in the numerical values, the major
tendencies are similar, the normalised correlations between
OH-dust, OH-C2, and C2-dust data are 0.78, 0.93, and 0.87,
respectively. (We have specifically selected C2, because
Millis & Schleicher 1986, in their
famous paper identified a 7.4 d period in the C2 emission
band.) The large scatter in the observed production rates shown in
Fig. 4 might be due to the different physical and chemical
processes involved in the production of these species; we suspect,
however, that the major problem is the use of a time-independent,
spherically symmetric, collisionless model (i.e. the Haser model)
for data reduction, which introduces large uncertainties in the
interpretation.
During the time interval we are interested in, the
phase angle changed from
![]() to
to
![]() ,
this may
affect slightly the dust data, but we neglect this in our
analysis.
,
this may
affect slightly the dust data, but we neglect this in our
analysis.
To compare our model with the data, in Fig. 4 we simply overplot the time variation of the calculated water production rate on top of the data shown before. The difficult question how the different species patterns mentioned above are related to the water production pattern is beyond reach in this brief report. Assuming that these patterns are closely similar, let us try to judge the result of Fig. 4. There exist well known statistical methods for such a purpose; their essence is to analyse whether the difference between the model and the measurements follow some well-known statistical distribution. We cannot apply directly these techniques because in our case the measurements are not random in time, and this would introduce a certain bias; and also because time is not a simple model parameter but actually a random variable as well. (This means that the time variable also has an intrinsic uncertainty, since in all data acquisitions - both for the production rates and for the nucleus positions - an unspecified time averaging is involved.)
It is not a trivial question how to define the difference between model values and data; after comparing various techniques we have associated to any data point that model point which is the closest to the given data point in the simple geometrical sense in the plot of Fig. 4. With this association, the normalised correlation between our model and the data for OH, C2, and the dust components are 0.5, 0.58, and 0.44, respectively. We have checked that modifying the image coordinate scales slightly does not change significantly these correlations.
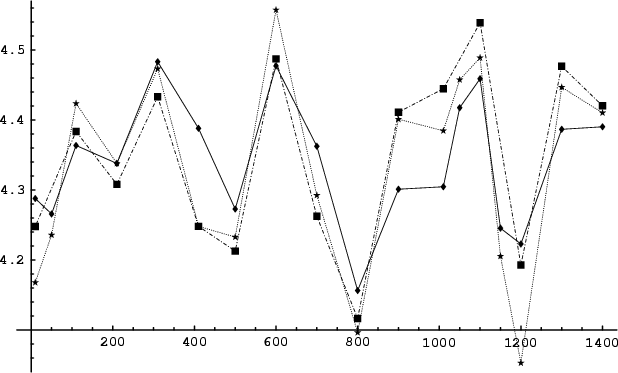 |
Figure 3:
Logarithms of the production rates derived by Schleicher et al. (1998) normalised arbitrarily:
|
| Open with DEXTER | |
Recently Julian et al. (2000) explained the secular behaviour and diurnal amplitude of the observed gas production, assuming five active regions on an ellipsoidal nucleus, and a long-axis mode rotation. Whereas the long-term thermal variation and short term periodic variations are correctly reproduced, we have certain reservations, because a) there are over 20 freely adjustable parameters, b) the location of the active regions differ from those suggested by the 1986 flyby observations (Sagdeev et al. 1987), c) the nucleus shape and orientations during the flybys differ considerably from the observed ones. We think that our model, having only one adjustable parameter - the dust-to-ice surface ratio - and complying with more observational constraints, provides a more satisfactory interpretation of the observations.
The main limitations of the present work are (1) it did not address to the famous cyanogen jets observations of A'Hearn et al. (1986); as the physical source of these structures is unclear to us, we cannot model them yet; (2) while our model has the capability of providing an accurate time-dependent dust emission profile (light curve), the considerable computer resources needed have forced us to delay this achievement to a future phase of our work.
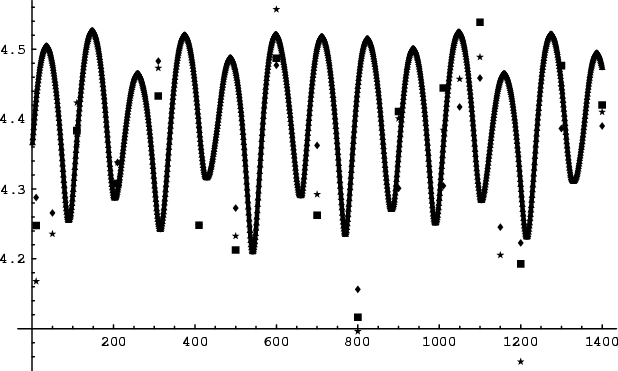 |
Figure 4: Comparison between logarithm of the model H2O production rate (continuous line) and the observations of Fig. 3 (same symbol meanings). The horizontal axis is time in 0.01 d units, starting from 4.34 March, 1986 |
| Open with DEXTER | |
Acknowledgements
Useful discussions with Dr. I. Toth is acknowledged. The work of K. Sz. was supported by the Hungarian OTKA T-32634 grant.