A&A 370, 43-52 (2001)
DOI: 10.1051/0004-6361:20010204
The external shear in the gravitationally lensed
system Q 2237+0305: A two-plane lens modelling
B. M. Mihov
Institute of Astronomy, Bulgarian Academy of Sciences
and Isaac Newton Institute of Chile, Bulgarian Branch
72 Tsarigradsko Chausse Blvd., 1784 Sofia, Bulgaria
Received 13 July 1998 / Accepted 2 February 2001
Abstract
We present one-plane lens models (with and without an external
shear added) and a two-plane lens model for the gravitationally lensed
system Q 2237+0305. The first (the main) lens plane is at z=0.0394and the second lens plane is at z=0.5664. We found the best lens
solutions for this system up to now -
 for the
external shear model and
for the
external shear model and
 for the two-plane model.
Generally, we found a nearly singular (with an upper limit on the core radius
of
for the two-plane model.
Generally, we found a nearly singular (with an upper limit on the core radius
of  36 pc) pseudoisothermal mass distribution for the central part
of the main lens that is consistent with the available observations of the
Q 2237+0305 system (except the misalignment of about
36 pc) pseudoisothermal mass distribution for the central part
of the main lens that is consistent with the available observations of the
Q 2237+0305 system (except the misalignment of about
 between the mass
and the light distributions). Furthermore, the main source of the external shear
is possibly the object connected with the Mg II absorption. In any case
the external perturbations should be taken into account in the future models of
the gravitationally lensed system Q 2237+0305. For the two-plane lens model the
blue mass-to-light ratio for the central
between the mass
and the light distributions). Furthermore, the main source of the external shear
is possibly the object connected with the Mg II absorption. In any case
the external perturbations should be taken into account in the future models of
the gravitationally lensed system Q 2237+0305. For the two-plane lens model the
blue mass-to-light ratio for the central
 of the SBb galaxy-lens is
estimated to be
of the SBb galaxy-lens is
estimated to be
 ,
and the mass of the SBb galaxy inside
the mean ring of the images is
,
and the mass of the SBb galaxy inside
the mean ring of the images is
 .
The introduction of the second lens plane leaves the core
radius, the axis ratio and the position angle of the mass distribution in the
main lens almost unchanged but decreases the mass inside the mean ring of the
images with 1.2% and increases the total magnification of the images by a
factor of 1.5. The parameters of the mass distribution in the second
lens are not very well constrained. If the second lens is a single galaxy we set
a lower limit on the radius of the Mg II absorbing halo of 14 kpc.
The probability for the two-plane lens model is estimated to be
8.0 10-9.
.
The introduction of the second lens plane leaves the core
radius, the axis ratio and the position angle of the mass distribution in the
main lens almost unchanged but decreases the mass inside the mean ring of the
images with 1.2% and increases the total magnification of the images by a
factor of 1.5. The parameters of the mass distribution in the second
lens are not very well constrained. If the second lens is a single galaxy we set
a lower limit on the radius of the Mg II absorbing halo of 14 kpc.
The probability for the two-plane lens model is estimated to be
8.0 10-9.
Key words: quasars: absorption lines - quasars: individual: Q 2237+0305 -
gravitational lensing
The gravitationally lensed system Q 2237+0305 (hereafter GLS Q 2237+0305)
was found accidentally by Huchra et al. (1985) during the Center
for Astrophysics Redshift Survey and looks like a cross - the four images
of the flat-spectrum radio-quiet quasar Q 2237+0305 (z=1.695) are situated
nearly symmetrically around the bright nucleus of the nearby (z=0.0394)
SBb galaxy 2237+0305 (Zwicky et al. 1965; Huchra et al. 1985;
Yee 1988; Falco et al. 1996). According to Huchra et al. (1985)
the lensing galaxy 2237+0305 is located in the outskirts of Pegasus II cluster
of galaxies. One moderate redshift (z=0.5664) and three high redshift (z=0.9674,
z=0.9709 and z=0.9713) Mg II absorption line systems have been
detected in the spectrum of the lensed quasar Q 2237+0305 (Hintzen et al.
1990; Foltz et al. 1992). Mediavilla et al. (1998)
detected an arc of extended emission (C III]) connecting the A, B and D
quasar images.
Keeton et al. (1997) and Witt & Mao (1997) pointed out
the need of a second, independent, external shear axis (in addition to the
main lens ellipticity) in order to get an acceptable fit to the observations
of the gravitationally lensed systems. This external shear could be produced
by a mass distribution correlated with the main lens and/or by massive objects
along the line of sight![[*]](/icons/foot_motif.gif) . In the case of the GLS
Q 2237+0305 there are three possible sources of an external shear perturbation
that could contribute to the lensing of the quasar: the galaxy bar (Yee 1988;
Kent & Falco 1988; Schmidt et al. 1998), the mass connected
with Pegasus II galaxy cluster (Webster et al. 1991) and the mass
associated with the Mg II absorption (Kochanek & Apostolakis 1988;
Webster et al. 1991; Foltz et al. 1992; Rix et al. 1992).
So, it is quite reasonable to try a lens solution with the external perturbation
taken into account. Another reason to try more complicated models is the failure
of the one-component models published so far to fit satisfactorily the observations
of the GLS Q 2237+0305. Moreover, the explicit modelling of the perturbers provides
for us the parameters of their mass distribution (e.g. Schmidt et al. 1998).
. In the case of the GLS
Q 2237+0305 there are three possible sources of an external shear perturbation
that could contribute to the lensing of the quasar: the galaxy bar (Yee 1988;
Kent & Falco 1988; Schmidt et al. 1998), the mass connected
with Pegasus II galaxy cluster (Webster et al. 1991) and the mass
associated with the Mg II absorption (Kochanek & Apostolakis 1988;
Webster et al. 1991; Foltz et al. 1992; Rix et al. 1992).
So, it is quite reasonable to try a lens solution with the external perturbation
taken into account. Another reason to try more complicated models is the failure
of the one-component models published so far to fit satisfactorily the observations
of the GLS Q 2237+0305. Moreover, the explicit modelling of the perturbers provides
for us the parameters of their mass distribution (e.g. Schmidt et al. 1998).
The GLS Q 2237+0305 has been modelled many times (Huchra et al. 1985;
Schneider et al. 1988; Kent & Falco 1988; Kochanek 1991;
Minakov & Shalyapin 1991; Rix et al. 1992; Wambsganss &
Paczynski 1994; Witt et al. 1995; Williams & Saha
1995; Petrov et al. 1996; Falco et al. 1996;
Schmidt et al. 1998; Chae et al. 1998; Mediavilla et al. 1998;
see also Kassiola & Kovner 1995; Witt 1996; Witt & Mao 1997)
but only Witt & Mao (1997) and Schmidt et al. (1998)
made an attempt to include a second, independent shear axis in the models
of this lensed system. Witt & Mao (1997) used a general analytical
approach and found a minimal shear required to fit the observed positions
of 0.0099  0.0063 (see also Witt 1996). Schmidt et al. (1998)
assumed that the source of the external shear is the galaxy bar.
Modelling the galaxy mass distribution as a singular power-law ellipsoid
aligned with the disk+bulge light distribution and the bar - as a Ferrers bar
(and fitting only the positions) they found quite a good fit -
0.0063 (see also Witt 1996). Schmidt et al. (1998)
assumed that the source of the external shear is the galaxy bar.
Modelling the galaxy mass distribution as a singular power-law ellipsoid
aligned with the disk+bulge light distribution and the bar - as a Ferrers bar
(and fitting only the positions) they found quite a good fit -
 - 3.4, and were able to derive the mass of the bar.
In the framework of the above discussion we put the following problems to be
solved in this paper. The first problem is to find a general external shear
solution for the GLS Q 2237+0305. The next problems are to model the GLS Q
2237+0305 by means of a two-plane lens taking explicitly into account the
lensing effect of the object associated with the Mg II absorption and
to extract some information about the second lens. Finally, we use the most
accurate (up to now) ultraviolet image positions combined with realistic radio
flux ratios of the images as observational constraints on our models.
In order to solve the above problems we construct a one-plane model with an
external shear added and a two-plane model. One-plane models without an
external shear are added in order to be compared with more complicated models.
In the two-plane model the first (the main) lens plane is at z=0.0394 and
the second lens plane is at z=0.5664, whereas the one-plane models include
only the main lens plane. We are forced to use only two planes in order to
build a well constrained detailed lens model (the use of multiple lens plane
approach increases the number of the free parameters). We choose the second
plane to be at z=0.5664 not at
 because of the fact that an
object at z=0.5664 has larger convergence and therefore, it has stronger
lensing effect than at
.
because of the fact that an
object at z=0.5664 has larger convergence and therefore, it has stronger
lensing effect than at
.
The paper is organized as follows. In Sect. 2 we describe the observational
constraints, the lens mass models and the modelling procedure used. The
results from the computations are presented and discussed in Sect. 3. Finally,
in Sect. 4 we summarize the findings in this paper and discuss some aspects
of the future observations and modelling of the GLS Q 2237+0305.
Throughout the paper we use the angular diameter distances
 given in Blandford & Narayan (1992) and
Einstein - de Sitter (
given in Blandford & Narayan (1992) and
Einstein - de Sitter (
 ,
,
 )
Universe with Hubble
parameter
)
Universe with Hubble
parameter
 .
.
We use the coordinates and the flux ratios of the
quasar images relative to the A quasar image (taken as a reference image) as
observational constraints on the model free parameters. So, we have a total of
9 observational constraints.
Among the published astrometry for the GLS Q 2237+0305 (Yee 1988; Irwin
et al. 1989; Crane et al. 1991; Racine 1991; Rix et al.
1992; Teuber et al. 1994; Østensen et al. 1996;
Falco et al. 1996; Vakulik et al. 1997; Burud et al. 1998;
Blanton et al. 1998), the most accurate image positions (and less
affected by systematical errors) are those derived by Blanton et al. (1998)
with the post-repaired Hubble Space Telescope (HST) in the ultraviolet band.
We shall use these image positions (listed in Table 1) as observational
constraints on the macromodels. Using the image and the SBb galaxy positions
we derive the radius of the mean ring formed by the images to be
 (=631.5 pc).
Racine (1991) claims a discovery of the fifth (E) quasar image in the
GLS Q 2237+0305 at a position
 )
but this discovery has not been confirmed yet (Crane et al. 1991;
Fitte & Adam 1994; Falco et al. 1996; Blanton et al. 1998).
)
but this discovery has not been confirmed yet (Crane et al. 1991;
Fitte & Adam 1994; Falco et al. 1996; Blanton et al. 1998).
According to Falco et al. (1996) (see also Witt et al. 1995) the
radio observations are more likely to determine the real flux ratios. So, we
assume that despite their low accuracy the radio flux ratios determined by
Falco et al. (1996) at
 with the Very Large Array
(VLA) are very close to the real ratios and we shall use them as observational
constraints on the macromodels (Table1).
with the Very Large Array
(VLA) are very close to the real ratios and we shall use them as observational
constraints on the macromodels (Table1).
Furthermore, according to Falco et al. (1996) the fifth quasar image
should have a flux density less than one fifth of the A image flux density,
i.e.
 .
.
We investigate three classes of lens models for the GLS Q 2237+0305 based
on the isothermal mass distribution.
The standard (one-plane one-component) class of lens models contains
a SIE model (a singular isothermal elliptical mass distribution model) and a
PIE model (a pseudoisothermal elliptical mass distribution model). The shear
class of lens models contains a PIE+XS model (a PIE model with an external
shear added). For both classes of lens models the lens plane is at z=0.0394and includes the SBb galaxy (referred to as the main lens).
The two-plane class of lens models contains a PIE+SIS model (a PIE model for
the main lens and a singular isothermal spherical mass distribution model for
the second lens). The first (the main) lens plane is at z=0.0394 and includes
the SBb galaxy, and the second lens plane is at z=0.5664 and includes the
object associated with the Mg II absorption.
The convergence
of the pseudoisothermal elliptical mass distribution (PIE, Kassiola & Kovner
1993) has the following form:
![\begin{displaymath}k\,({\vec \theta})=k(0)\,\biggl[1+{\theta^{2}_{1} \over \varp...
...{2}_{2} \over \varpi^{2}\,(1-\varepsilon)^{2}}
\biggr]^{-1/2},
\end{displaymath}](/articles/aa/full/2001/16/aah1099/img39.gif) |
(1) |
where k(0) is the central convergence of the lens. The parameters which
characterize the PIE model are the model velocity dispersion

 ,
the core radius
,
the core radius  ,
the elliptical parameter
,
the elliptical parameter

 ,
the
polar angle
,
the
polar angle
 of the major axis and the position
 .
The elliptical parameter is connected with the
minor-to-major axis ratio f of the lens mass distribution via the
relationship
.
The elliptical parameter is connected with the
minor-to-major axis ratio f of the lens mass distribution via the
relationship
 .
In the case of the SIE
model we set
.
In the case of the SIE
model we set  and for the PIE+SIS model we set
 for the second lens.
The lensing potential of the external shear perturbation reads
 |
(2) |
where  is the shear magnitude and
 is the shear
orientation. In the framework of the multipole-Taylor expansion (Trotter
et al. 2000) the angle
(and
is the shear
orientation. In the framework of the multipole-Taylor expansion (Trotter
et al. 2000) the angle
(and
 )
is the angle to the mass deficit, whereas the angle
)
is the angle to the mass deficit, whereas the angle
 (and
(and
 )
is the angle to
the mass excess.
)
is the angle to
the mass excess.
For the two-plane PIE+SIS model the lens equations are taken from Erdl &
Schneider's (1993) paper. The second lens is described by its model
velosity dispersion
 and by its
position
and by its
position
 .
.
In all models we suppose that the centre of the main lens mass
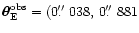
distribution coincides with the centre of brightness of the SBb galaxy, i.e.
 (see Table1), in order to avoid the use of the main lens coordinates
as free parameters.
(see Table1), in order to avoid the use of the main lens coordinates
as free parameters.
We use the backward ray-shooting algorithm proposed by Kayser (1990)
for the lens equation inversion. As a  function we use Kochanek's
(1991)
function we use Kochanek's
(1991)
 function modified by us to include
the flux ratios, to take into account the variances of the observational
constraints (see Table1) and to use the source position
corresponding to the A image as a model source position. So, our
function has the following form:
function modified by us to include
the flux ratios, to take into account the variances of the observational
constraints (see Table1) and to use the source position
corresponding to the A image as a model source position. So, our
function has the following form:
 |
(3) |
where
![\begin{displaymath}\chi^{2}_{\theta,i}= \biggl[{{\vec \mu}_{i} \cdot
({\vec \be...
...{\vec \beta}_{\rm A})
\over \sigma_{\theta,\it i}}\biggr]^{2},
\end{displaymath}](/articles/aa/full/2001/16/aah1099/img62.gif) |
(4) |
![\begin{displaymath}\chi^{2}_{\mu,i}=\biggl[{\mu^{\rm obs}_{i\rm A}-
\vert \mu^{\rm calc}_{i\rm A} \vert \over \sigma_{\mu,\it i}}\biggr]^{2},
\end{displaymath}](/articles/aa/full/2001/16/aah1099/img63.gif) |
(5) |
 ,
C, D,
,
C, D,
 and
and
 are the
standard deviations of the position and of the flux ratio of the ith image,
respectively,
are the
standard deviations of the position and of the flux ratio of the ith image,
respectively,
 is the magnification tensor at the position
of the ith image,
is the magnification tensor at the position
of the ith image,
 is the model source
position corresponding to the ith image and
is the model source
position corresponding to the ith image and
 is the flux
ratio (observed and calculated) of the ith image relative to the A
image. In order to minimize this
function we use a downhill simplex
method (Press et al. 1986 - their routine amoeba). We
estimate the quality of the fit making use of the
value at the
minimum (
is the flux
ratio (observed and calculated) of the ith image relative to the A
image. In order to minimize this
function we use a downhill simplex
method (Press et al. 1986 - their routine amoeba). We
estimate the quality of the fit making use of the
value at the
minimum (
 )
divided by the degrees of freedom (
)
divided by the degrees of freedom (
 )
for the particular model, i.e.
)
for the particular model, i.e.
 .
.
The finding of the global minimum in the multidimensional
surface
is an arduous task. In general, the multidimensional
surface has
many local minima together with the global one and the minimization
schemes frequently converge on local minima. However, there are cases (simple
models with few (2-3) free parameters) when the minimization programme
converges stably on the global minimum. We use the following technique in
order to find the global minimum of the
function.
We must choose an initial simplex in the parameter space in order to work with
the downhill simplex method. When there is a single minimum the final result
is independent of the initial simplex choice and we have no problems. When there
are many minima in the
surface, the final result will depend on the
initial simplex choice, i.e. the programme will converge on different minima
with different initial conditions. The more different initial simplexes we
use, the bigger the probability to find the global minimum gets in the
latter case. Clearly, for different problems a different number of cycles will
be required before we can have confidence in the results. Applying this
technique, we define an appropriate interval for each parameter in the
begining of the modelling. In each minimization cycle we choose the vertices
of the initial simplex randomly in these intervals and then minimize .
After some number of minimization cycles we could change the parameters'
intervals. At the end of each cycle we write the final result in a data file
and then we use these data in the determination of the joint confidence region
for all n parameters of the model - we find all successful models which increase
the
function up to the desirable confidence level P% (i.e. we find
all models with
 )
and we choose the most deviant parameters of these models as confidence limits
on the best model parameters. When we have a well defined minimum it is
possible to use the standard procedure to find the confidence limits instead of
the data file generated, i.e. we vary the parameter of interest until we get
)
and we choose the most deviant parameters of these models as confidence limits
on the best model parameters. When we have a well defined minimum it is
possible to use the standard procedure to find the confidence limits instead of
the data file generated, i.e. we vary the parameter of interest until we get
 while the
remaining parameters are adjusted to minimize
(some values of
while the
remaining parameters are adjusted to minimize
(some values of
 are given in Press et al. 1986). Each minimum
we suspect to be the global one is checked via the squared deviation function
(SDF) method (Schramm & Kayser 1987; Kayser & Schramm 1988)
in order to search for extra images produced by the model; these images could be
real but too faint to be detected or could be unreal ones. Recently, Keeton et al.
(2000) showed that in the presence of a strong tidal perturbation oriented
near the lens minor axis six or eight highly magnified images could be produced
but this is not our case (see Table2); in fact, we could not find extra
images having brightness comparible to or smaller than the brightness of the
observed images. In order to draw the caustics and the critical curves
we find the points where the Jacobian of the mapping
are given in Press et al. 1986). Each minimum
we suspect to be the global one is checked via the squared deviation function
(SDF) method (Schramm & Kayser 1987; Kayser & Schramm 1988)
in order to search for extra images produced by the model; these images could be
real but too faint to be detected or could be unreal ones. Recently, Keeton et al.
(2000) showed that in the presence of a strong tidal perturbation oriented
near the lens minor axis six or eight highly magnified images could be produced
but this is not our case (see Table2); in fact, we could not find extra
images having brightness comparible to or smaller than the brightness of the
observed images. In order to draw the caustics and the critical curves
we find the points where the Jacobian of the mapping
 changes its sign. As the mass model of the main lens is
nonsingular the central (fifth, E) image will be created. In order to predict
the position and the flux ratio of the E quasar image we use the following
approach. We cover the central part of the modelled region (where the fifth E
image is expected to be) with an equally spaced two dimensional grid. Each
grid point is then traced back to the source plane via the gravitational lens
equation and the corresponding source position is found. The grid point
corresponding to the source point having smallest distance to the derived source
position is selected. A new and more closely spaced grid is then constructed in
the outskirts of the selected point and the entire procedure is repeated until
the desired accuracy is achieved. After that the magnification of the E
image is computed. Finally, in order to derive the lens mass inside a given
radius we integrate the lens convergence within the selected radius.
changes its sign. As the mass model of the main lens is
nonsingular the central (fifth, E) image will be created. In order to predict
the position and the flux ratio of the E quasar image we use the following
approach. We cover the central part of the modelled region (where the fifth E
image is expected to be) with an equally spaced two dimensional grid. Each
grid point is then traced back to the source plane via the gravitational lens
equation and the corresponding source position is found. The grid point
corresponding to the source point having smallest distance to the derived source
position is selected. A new and more closely spaced grid is then constructed in
the outskirts of the selected point and the entire procedure is repeated until
the desired accuracy is achieved. After that the magnification of the E
image is computed. Finally, in order to derive the lens mass inside a given
radius we integrate the lens convergence within the selected radius.
We first calculate two standard (one-plane one-component) lens models.
In this way we can follow the changes in the fit quality and in the parameters
of the main lens mass distribution due to the use of a shear or of a two-plane
instead of a standard lens model. We can also test the standard models using
the highest accuracy image positions ever used.
In the shear models we assume that the standard model is perturbed by the
mass distribution correlated with the main lens and/or by massive objects
along the line of sight.
In the two-plane model we assume that the object connected with the
Mg II absorption has nonvanishing lensing effect thereby it
influences the formation of the images.
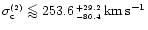
We found the best lens solution for the GLS Q 2237+0305 up to now - the PIE+XS
and the PIE+SIS models with
and
,
respectively. The results from the computations are summarized in Table 2.
The errors quoted are 68.3% confidence limits on the parameters. The
error of the mass accounts only for the error of the model velocity dispersion.
In Table3 we list the terms
 (Eqs. (4), (5)) for each image in order to get an overview on the ability the
given model to fit the observations. The observed and predicted image
positions and magnifications by the PIE+XS model are plotted in Fig.1, and
the caustics and the critical curves for the PIE+SIS model are plotted in
Fig.2 along with the direction to the mass excess found by the PIE+XS model.
(Eqs. (4), (5)) for each image in order to get an overview on the ability the
given model to fit the observations. The observed and predicted image
positions and magnifications by the PIE+XS model are plotted in Fig.1, and
the caustics and the critical curves for the PIE+SIS model are plotted in
Fig.2 along with the direction to the mass excess found by the PIE+XS model.
The position and flux ratio of the fifth quasar image predicted by the PIE
model are
 .
The PIE+XS and the PIE+SIS models are nearly singular
and the fifth image is strongly demagnified. For the PIE+XS model we found the
mass excess angle to be
.
The PIE+XS and the PIE+SIS models are nearly singular
and the fifth image is strongly demagnified. For the PIE+XS model we found the
mass excess angle to be
 .
The polar coordinates of the second lens relative to the
main lens are
.
The polar coordinates of the second lens relative to the
main lens are
 (PIE+SIS model). Before calculating the polar coordinates we made the transformation
 ,
where
is the position of the SBb galaxy relative to the A image.
The polar coordinates of Pegasus II cluster relative to the main lens are
,
where
is the position of the SBb galaxy relative to the A image.
The polar coordinates of Pegasus II cluster relative to the main lens are
 (Chincarini & Rood 1976).
Finally, we found the B magnitudes of the unlensed quasar to be
 and
and
 for the PIE+XS and the PIE+SIS models, respectively. We have
used the B magnitudes (the PSF fitting method) of the images derived by
Burud et al. (1998) - the total B magnitude of the lensed quasar
is
for the PIE+XS and the PIE+SIS models, respectively. We have
used the B magnitudes (the PSF fitting method) of the images derived by
Burud et al. (1998) - the total B magnitude of the lensed quasar
is
 .
.
The common feature of the standard models published so far is their failure
in the fitting of the observations - typically one has
 .
Our models are not an exception (Table2). Our worst model - the
SIE model (Table3), leads to differences between the observed and the
calculated image positions that are up to 10 times the standard
deviations of the observed image positions. The flux ratios for this model
are fitted within their observational errors but the last ones are too large
to say that the ratios are fitted well (this is true for all other models
computed in the paper except for the D image in the PIE model). One can see that
the introduction of the core radius in the PIE model leads to a better fit of
the positions and to a worse fit of the flux ratios compared to the singular
SIE model - in particular, the flux ratio of the D image is fitted rather badly
despite the large observational error (Table3). Note that the models
presented by Schmidt et al. (1998) and by Chae et al. (1998)
fit most badly the D image flux ratio whereas our best models fit most badly
the B image flux ratio.
.
Our models are not an exception (Table2). Our worst model - the
SIE model (Table3), leads to differences between the observed and the
calculated image positions that are up to 10 times the standard
deviations of the observed image positions. The flux ratios for this model
are fitted within their observational errors but the last ones are too large
to say that the ratios are fitted well (this is true for all other models
computed in the paper except for the D image in the PIE model). One can see that
the introduction of the core radius in the PIE model leads to a better fit of
the positions and to a worse fit of the flux ratios compared to the singular
SIE model - in particular, the flux ratio of the D image is fitted rather badly
despite the large observational error (Table3). Note that the models
presented by Schmidt et al. (1998) and by Chae et al. (1998)
fit most badly the D image flux ratio whereas our best models fit most badly
the B image flux ratio.
Adding an external shear perturbation (PIE+XS model) we got the best fit up
to now:
- the positions are fitted within their
errors which are small enought to say that the positions are fitted well.
Note that the flux ratios are fitted almost with the same accuracy as in
the SIE model, and that the low
comes from the accurate fitting
of the positions (Table3). Our result confirms the finding of Keeton
et al. (1997) that the independent source of shear is more fundamental
variable than the changes in the radial mass distribution (see also Schmidt et al.
1998). Furhermore, Witt & Mao (1997) using an analytical
approach found the minimal shear required to fit the position to be quite
small -
 .
Our numerical result for the shear magnitude
.
Our numerical result for the shear magnitude
 is consistent with this lower limit but slightly larger than it
(we try to fit the positions and the magnifications simultaneously).
is consistent with this lower limit but slightly larger than it
(we try to fit the positions and the magnifications simultaneously).
Table 3:
The contribution of the position and flux ratio
terms
to the
final
for each image and for each model
 |
 |
 |
 |
|
|
SIE |
73.00,0.43 |
53.55,0.16 |
92.00,0.12 |
219.26 |
| PIE |
10.80,0.72 |
11.89,0.31 |
14.68,3.02 |
41.42 |
| PIE+XS |
0.080,0.52 |
0.110,0.14 |
0.040,0.17 |
1.06 |
| PIE+SIS |
0.010,0.49 |
0.006,0.15 |
0.004,0.22 |
0.88 |
We made some further experiments with the SIE, the PIE and the PIE+XS models
(in Table4 we show the results from the experiments for the PIE+XS
model). Firstly, we minimized these models removing the constraints that come
from the flux ratios. The PIE+XS model was run for several different model
velocity dispersions while minimizing over the remaining parameters (the
solution for the PIE+XS model is the one with the lowest
 ).
For all three models we found that the parameters of the lens models were very
close to those listed in Table2 (see Table4). The corresponding
values of
).
For all three models we found that the parameters of the lens models were very
close to those listed in Table2 (see Table4). The corresponding
values of
 for the SIE, the PIE and the PIE+XS models
are: 218.52/3, 37.33/2 and 0.23/1, respectively (cf. Table3). Secondly,
we decreased the errors of the radio flux ratios by a factor of 100 in order the
accuracy of the positions and of the ratios to be comparable, i.e. we simulated high
accurate flux ratios. Then we minimized the above three models again. We found
slightly different parameters compared with those listed in Table2
(see Table4) but a very poor fit -
for the SIE, the PIE and the PIE+XS models
are: 218.52/3, 37.33/2 and 0.23/1, respectively (cf. Table3). Secondly,
we decreased the errors of the radio flux ratios by a factor of 100 in order the
accuracy of the positions and of the ratios to be comparable, i.e. we simulated high
accurate flux ratios. Then we minimized the above three models again. We found
slightly different parameters compared with those listed in Table2
(see Table4) but a very poor fit -
 for all three models. So, the high accurate flux ratios make our models
unacceptable from the
point of view. However, to be sure in this
conclusion high accurate observed but not simulated ratios should be used.
From these experiments we could conclude that with the present accuracy
of the flux ratios the model parameters are determined mainly by the
constraints coming from the observed image positions. Despite this, we
are forced to use the flux ratios in order to ensure enough observational
constraints for the PIE+XS and for the PIE+SIS models. Furthermore, high
accurate flux ratios are needed for the future modelling in order tightly
to constrain the range of the acceptable models of the GLS Q 2237+0305
(Agol et al. 2000; see also Chae et al. 1998).
for all three models. So, the high accurate flux ratios make our models
unacceptable from the
point of view. However, to be sure in this
conclusion high accurate observed but not simulated ratios should be used.
From these experiments we could conclude that with the present accuracy
of the flux ratios the model parameters are determined mainly by the
constraints coming from the observed image positions. Despite this, we
are forced to use the flux ratios in order to ensure enough observational
constraints for the PIE+XS and for the PIE+SIS models. Furthermore, high
accurate flux ratios are needed for the future modelling in order tightly
to constrain the range of the acceptable models of the GLS Q 2237+0305
(Agol et al. 2000; see also Chae et al. 1998).
-

- the parameter was fixed during the minimization (see the text).
The introduction of the second deflecting mass (at z=0.5664; PIE+SIS model)
along with the main lens gives an excellent fit too
 - the
slightly larger
compared to the PIE+XS model is due to
the worse fitting of the C and D images flux ratio. Note however, that under
the present observational constraints the PIE+XS and the PIE+SIS models are
formally undistinguishable from the
point of view - both models
fit the observations within their observational errors. The parameters of the
mass distribution are in very close agreement with those of the PIE+XS model
(Table2), and the direction to the second lens and the direction to the mass
excess inferred from the PIE+XS model are aligned up to
- the
slightly larger
compared to the PIE+XS model is due to
the worse fitting of the C and D images flux ratio. Note however, that under
the present observational constraints the PIE+XS and the PIE+SIS models are
formally undistinguishable from the
point of view - both models
fit the observations within their observational errors. The parameters of the
mass distribution are in very close agreement with those of the PIE+XS model
(Table2), and the direction to the second lens and the direction to the mass
excess inferred from the PIE+XS model are aligned up to
 (Fig.2; we should point out that the orientation of the shear and the
position of the second lens are not well constrained by the models).
The mass excess angle is far away from the directions to the galaxy bar and
to Pegasus II cluster. These results together with the better fit compared to
that of Schmidt et al. (1998) mean that the main source of the shear can
be the object connected with the Mg II absorption and not the bar, nor
the mass of Pegasus II cluster. In any case one must include perturbations
(either expanding or explicitly taking into account the perturbers' potentials)
in order to get a satisfactory fit to the GLS Q 2237+0305 observations.
(Fig.2; we should point out that the orientation of the shear and the
position of the second lens are not well constrained by the models).
The mass excess angle is far away from the directions to the galaxy bar and
to Pegasus II cluster. These results together with the better fit compared to
that of Schmidt et al. (1998) mean that the main source of the shear can
be the object connected with the Mg II absorption and not the bar, nor
the mass of Pegasus II cluster. In any case one must include perturbations
(either expanding or explicitly taking into account the perturbers' potentials)
in order to get a satisfactory fit to the GLS Q 2237+0305 observations.
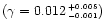
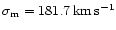
Our discussion on the parameters of the SBb galaxy mass distribution will
start with the core radius. The PIE model has a core radius of 260
16 pc
that is close to the approximate upper limit of 200 pc inferred from a
statistical study by Wallington & Narayan (1993). Note that the calculated
position of the fifth quasar image is in good agreement with Racine's (1991)
position of the probable fifth image and that the calculated flux ratio
 is below the upper limit set by Falco et al. (1996).
If the feature observed by Racine (1991) is indeed the fifth quasar
image then a strong constraint on the core radius will be imposed. The
problem is the poor fit obtained by the PIE model. Taking into account the
lensing effect of the external perturbations or the effect of the second lens
we improve the fit and get the mass profiles that are consistent with the
singular profile. Accounting for the PIE+SIS model we can set an approximate
upper limit on the core radius of
is below the upper limit set by Falco et al. (1996).
If the feature observed by Racine (1991) is indeed the fifth quasar
image then a strong constraint on the core radius will be imposed. The
problem is the poor fit obtained by the PIE model. Taking into account the
lensing effect of the external perturbations or the effect of the second lens
we improve the fit and get the mass profiles that are consistent with the
singular profile. Accounting for the PIE+SIS model we can set an approximate
upper limit on the core radius of
 (=36 pc). The core
radius of 40 pc found by Chae et al. (1998) is consistent with this limit.
Schmidt et al. (1998) achieved a good fit to the observations with a singular
nearly pseudoisothermal elliptical mass distribution plus a Ferrers bar
acting as a perturber. These results point toward a mass model for the GLS
Q 2237+0305 that is nearly singular at the centre.
(=36 pc). The core
radius of 40 pc found by Chae et al. (1998) is consistent with this limit.
Schmidt et al. (1998) achieved a good fit to the observations with a singular
nearly pseudoisothermal elliptical mass distribution plus a Ferrers bar
acting as a perturber. These results point toward a mass model for the GLS
Q 2237+0305 that is nearly singular at the centre.
The standard models tightly constrain the position angle of the model major
axis - averaging over all presented up to now standard models we get
PA =
 .
Fitte & Adam (1994) claim the average position
angle of the major axis of the light distribution inside
.
Fitte & Adam (1994) claim the average position
angle of the major axis of the light distribution inside
 to be
to be
 which leads to about
 misalignment between the light
and the mass distribution. This misalignment could be a real property of the
lensing SBb galaxy (e.g. Keeton et al. 1997) or the model major axis could
represent the resulting shear orientation if there are lensing components
that have not been included in the standard models (Schmidt et al. 1998).
Accounting for the relatively good fit obtained by Schmidt et al. (1998),
we shall furthermore consider only the second possibility. Our best models
increased this misalignment up to
toward the bar. This
misalignment between the model mass distribution and the bulge+disk light
distribution means that the bar has non-neglegible lensing effect (Schmidt et
al. 1998) and should be included in the detailed modelling of the GLS Q
2237+0305.
misalignment between the light
and the mass distribution. This misalignment could be a real property of the
lensing SBb galaxy (e.g. Keeton et al. 1997) or the model major axis could
represent the resulting shear orientation if there are lensing components
that have not been included in the standard models (Schmidt et al. 1998).
Accounting for the relatively good fit obtained by Schmidt et al. (1998),
we shall furthermore consider only the second possibility. Our best models
increased this misalignment up to
toward the bar. This
misalignment between the model mass distribution and the bulge+disk light
distribution means that the bar has non-neglegible lensing effect (Schmidt et
al. 1998) and should be included in the detailed modelling of the GLS Q
2237+0305.
From our best models we get the mean axis ratio to be 0.676 which is
consistent with the result of 0.7 derived by Fitte & Adam (1994)
for the central part of the SBb galaxy.
![\begin{figure}
\par\includegraphics[width=8.4cm,clip]{H1099F1.EPS}\end{figure}](/articles/aa/full/2001/16/aah1099/Timg148.gif) |
Figure 1:
The observed (solid circles) and the predicted (dashed circles)
by the PIE+XS model image positions and ratios. The flux ratio
is equal to the ratio of the area of the ith image circle to the area of
the A image circle |
| Open with DEXTER |
Foltz et al. (1992) measured the central velocity dispersion
 of the lensing SBb galaxy to be
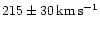 .
Rix et al. (1992) reanalyzed their data and found the central velocity
dispersion (in a
.
Rix et al. (1992) reanalyzed their data and found the central velocity
dispersion (in a
 aperture) to be
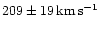 .
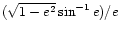
Using Fig. 6 of Rix et al. (1992)
we can make a rough estimate of the central velocity
dispersion for a spherical, nonrotating, isotropic, Hernquist (1990) model.
Taking the SBb galaxy effective radius of
.
Using Fig. 6 of Rix et al. (1992)
we can make a rough estimate of the central velocity
dispersion for a spherical, nonrotating, isotropic, Hernquist (1990) model.
Taking the SBb galaxy effective radius of
 (between
 and
and
 ,
Fitte & Adam 1994) we obtain
,
Fitte & Adam 1994) we obtain
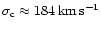 .
On the other hand, Kochanek
(1993) proved that the average velocity dispersion
within
the central few arcseconds is roughly equal to the model velocity dispersion
(see also Breimer & Sanders 1993). We
straightforward assume that
.
On the other hand, Kochanek
(1993) proved that the average velocity dispersion
within
the central few arcseconds is roughly equal to the model velocity dispersion
(see also Breimer & Sanders 1993). We
straightforward assume that
 for an isotropic,
spherically symmetric model, i.e. our best models predict
for an isotropic,
spherically symmetric model, i.e. our best models predict
 (this value is an average over the PIE+XS and the PIE+SIS
models). Therefore, our estimate of the central velocity dispersion
based on the lens modelling is in agreement with the dynamical estimate for
an isotropic spherical model. If one breaks the spherical symmetry, the
velocity dispersion will be reduced by a factor
(this value is an average over the PIE+XS and the PIE+SIS
models). Therefore, our estimate of the central velocity dispersion
based on the lens modelling is in agreement with the dynamical estimate for
an isotropic spherical model. If one breaks the spherical symmetry, the
velocity dispersion will be reduced by a factor
 ,
where the eccentricity is
,
where the eccentricity is
 and f0 is the edge-on axis ratio
(Kent & Falco 1988). Chae et al. (1998)
obtained
f0=0.835 and therefore, the central velocity dispersion
predicted by our models is
and f0 is the edge-on axis ratio
(Kent & Falco 1988). Chae et al. (1998)
obtained
f0=0.835 and therefore, the central velocity dispersion
predicted by our models is
 .
This value is in agreement with the results of Kent & Falco (1988) who
used different radial mass profiles for the SBb galaxy mass model. Our value
of the central velocity dispersion (for an isotropic model) is smaller than
the measured value of
.
This value is in agreement with the results of Kent & Falco (1988) who
used different radial mass profiles for the SBb galaxy mass model. Our value
of the central velocity dispersion (for an isotropic model) is smaller than
the measured value of
 .
This points to the presence
of some degree of anisotropy in the central part of the lensing galaxy and
that the radial component of the velocity dispersion is greater than the
tangential one (Foltz et al. 1992; see also Fig. 1 of Richstone & Tremaine 1984).
Note that, if there is only slight anisotropy in the galaxy centre, corrections
up to 40% in the isotropic central velocity dispersion are possible (Tonry
1983; see also Foltz et al. 1992), i.e. we obtain
.
This points to the presence
of some degree of anisotropy in the central part of the lensing galaxy and
that the radial component of the velocity dispersion is greater than the
tangential one (Foltz et al. 1992; see also Fig. 1 of Richstone & Tremaine 1984).
Note that, if there is only slight anisotropy in the galaxy centre, corrections
up to 40% in the isotropic central velocity dispersion are possible (Tonry
1983; see also Foltz et al. 1992), i.e. we obtain
 from the lens modelling which result agrees well
at its upper limit with the observations.
from the lens modelling which result agrees well
at its upper limit with the observations.
![\begin{figure}
\par\includegraphics[width=8.4cm,clip]{H1099F2.EPS}\end{figure}](/articles/aa/full/2001/16/aah1099/Timg164.gif) |
Figure 2:
Critical curves for the PIE+SIS model. The images (grey spots), the
SBb galaxy (grey circle labelled G) and the second lens (grey circle labelled
L) are shown. The insert shows the caustics in the source plane together with
the source (grey circle labelled S), the lenses (shown as grey circles), and
the points where the images intersect the second plane (four points marked I).
The dashed line represents the direction to the mass excess found by
the PIE+XS model |
| Open with DEXTER |
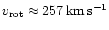
Huchra et al. (1985) made a crude estimate of the rotational
velocity at the position
 to the West of the SBb galaxiy nucleus:
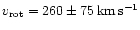 .
The mean rotational
velocity predicted by our PIE+XS and PIE+SIS models at a distance
of
is about
.
The mean rotational
velocity predicted by our PIE+XS and PIE+SIS models at a distance
of
is about
 which is within the
error of the measured value. The asymptotic (at
which is within the
error of the measured value. The asymptotic (at
 )
rotation
velocity is
)
rotation
velocity is
 or about
which is the same as above because of the vanishing core size.
or about
which is the same as above because of the vanishing core size.
The introduction of the second lens plane decreases the mass inside the mean
ring of the images with 1.2% relative to the one plane models (Table2; we
adopt
 ). Schmidt et al. (1998)
obtained the mass inside the circle of
). Schmidt et al. (1998)
obtained the mass inside the circle of
 radius
 (<0
(<0
 .
For the same radius the PIE+XS and the PIE+SIS models give
(<0
.
For the same radius the PIE+XS and the PIE+SIS models give
(<0
 and (<0
 ,
respectively. One can see that the mass obtained by our PIE+SIS model is in
excellent agreement with the results of Schmidt et al. (1998) who used a
different lens model. For the circle of radius
the PIE+XS and the
PIE+SIS models give (<1
,
respectively. One can see that the mass obtained by our PIE+SIS model is in
excellent agreement with the results of Schmidt et al. (1998) who used a
different lens model. For the circle of radius
the PIE+XS and the
PIE+SIS models give (<1
 and (<1
 ,
respectively. The r magnitude of the SBb galaxy inside the same radius is
r(<1
,
respectively. The r magnitude of the SBb galaxy inside the same radius is
r(<1
 (cited in Foltz et al. 1992). Using
the galaxy colour
(cited in Foltz et al. 1992). Using
the galaxy colour
 (Yee 1988) and the transformation equation
 (Corrigan et al. 1991) we get the B magnitude
 .
Adopting the absolute B magnitude of the Sun to be
.
Adopting the absolute B magnitude of the Sun to be
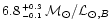
 we obtain the blue mass-to-light ratio for the central
to be
we obtain the blue mass-to-light ratio for the central
to be
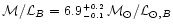 and
and
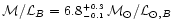 for the PIE+XS and the PIE+SIS models, respectively. For the inner
 of the galaxy Rix et al. (1992) found
 having used a constant mass-to-light ratio model for the SBb galaxy.
Our estimates are in rough agreement with this result as well as with the
results obtained for the spiral galaxies (e.g. Rubin et al. 1985). Finally,
there will be additional uncertainity in the two-plane mass estimation due to
the mass at
.
having used a constant mass-to-light ratio model for the SBb galaxy.
Our estimates are in rough agreement with this result as well as with the
results obtained for the spiral galaxies (e.g. Rubin et al. 1985). Finally,
there will be additional uncertainity in the two-plane mass estimation due to
the mass at
.
For the present, the most popular hypothesis for the origin of the Mg II
absorption lines in the quasars' spectra is that the absorption arises in the
gaseous halos of the field galaxies whose halos intersect the quasars' line-of-sight
(Bergeron & Boissé 1991; Bergeron et al. 1992;
Bechtold & Ellingson 1992; Le Brun et al. 1993).
Under this hypothesis we assume that the object associated
with the Mg II absorption is a single galaxy. Following the discussion in
Sect. 3.2 we obtain the central velocity dispersion of the second galaxy-lens
 with
possible additional uncertainity up to 40%.
This central velocity dispersion is somewhat higher for a spiral
galaxy (see Whitmore et al. 1985), so, we assume that the second lens is an
elliptical galaxy (note however, that the model velocity dispersion of the
second lens is not well constrained by the model, so, we cannot reject the
possibility the second lens to be a spiral galaxy at the lower end of the
confidence interval). Using Faber-Jackson relationship
with
possible additional uncertainity up to 40%.
This central velocity dispersion is somewhat higher for a spiral
galaxy (see Whitmore et al. 1985), so, we assume that the second lens is an
elliptical galaxy (note however, that the model velocity dispersion of the
second lens is not well constrained by the model, so, we cannot reject the
possibility the second lens to be a spiral galaxy at the lower end of the
confidence interval). Using Faber-Jackson relationship
 (Faber & Jackson 1976) with paprameters
 and a=3.6 for ellipticals
(de Vaucouleurs & Olson 1982) we get the luminousity of the second lensing
galaxy
and a=3.6 for ellipticals
(de Vaucouleurs & Olson 1982) we get the luminousity of the second lensing
galaxy
 .
The mean projected angular distance between the
second lens and the points where the quasar images intersect the second plane
is
.
The mean projected angular distance between the
second lens and the points where the quasar images intersect the second plane
is
 (=13.2 kpc). This sets a lower limit on the radius of the
gaseous halo (where the Mg II absorption arises) associated with the
second lens of 14 kpc. Hewett et al. (1994) obtained the lower
limit on the radius of the Mg II absorber of 27 kpc based
on the observations of the gravitationally lensed system Q 1009-0252.
From an imaging study Bergeron & Boissé (1991) found the gaseous halos
to extend up to 50 kpc which is consistent with the results
obtained from lensing. Finally, being given only the velocity dispersion
of the absorber we cannot reject the possibility the object associated
with the Mg II absorption to be a small group of galaxies (Yanny &
York 1992; Drinkwater et al. 1993).
(=13.2 kpc). This sets a lower limit on the radius of the
gaseous halo (where the Mg II absorption arises) associated with the
second lens of 14 kpc. Hewett et al. (1994) obtained the lower
limit on the radius of the Mg II absorber of 27 kpc based
on the observations of the gravitationally lensed system Q 1009-0252.
From an imaging study Bergeron & Boissé (1991) found the gaseous halos
to extend up to 50 kpc which is consistent with the results
obtained from lensing. Finally, being given only the velocity dispersion
of the absorber we cannot reject the possibility the object associated
with the Mg II absorption to be a small group of galaxies (Yanny &
York 1992; Drinkwater et al. 1993).
The introduction of the second lens plane weakens the statistical difficulties
connected with this system (e.g. Schneider et al. 1988) - there is no need of
close alignment between the source and the main lens (the impact parameter, i.e.
the separation between the source and the SBb galaxy, is
 for the
PIE+XS model compared with
for the
PIE+XS model compared with
 for the PIE+SIS one). On the other
hand, we need two lenses at a different redshift to be aligned better than
for the PIE+SIS one). On the other
hand, we need two lenses at a different redshift to be aligned better than
 .
Following Kochanek & Apostolakis (1988) we derive the probability
to find a second lens
.
Following Kochanek & Apostolakis (1988) we derive the probability
to find a second lens
 away from the main SBb lens to be
8.3 10-5. The self-consistent probability (see Ehlers & Schneider
1986) of getting the five image system is
9.6 10-5. To derive the above
probabilities we have used a number density of spiral lenses
away from the main SBb lens to be
8.3 10-5. The self-consistent probability (see Ehlers & Schneider
1986) of getting the five image system is
9.6 10-5. To derive the above
probabilities we have used a number density of spiral lenses
 ,
where
,
where
 (Marzke et al. 1994). Therefore,
the total probability for the PIE+SIS model is
8.0 10-9. This is a very
low probability; the existence and the discovery of the GLS Q 2237+0305 should be
considered as a statistical fluke (see also Kochanek 1992). The low
probability for the PIE+SIS model means that it is unlikely for another lensed system
as GLS Q 2237+0305 to exist among the nearby galaxies - the GLS Q 2237+0305 remains
a unique gravitationally lensed system, an exception among the lensed systems.
(Marzke et al. 1994). Therefore,
the total probability for the PIE+SIS model is
8.0 10-9. This is a very
low probability; the existence and the discovery of the GLS Q 2237+0305 should be
considered as a statistical fluke (see also Kochanek 1992). The low
probability for the PIE+SIS model means that it is unlikely for another lensed system
as GLS Q 2237+0305 to exist among the nearby galaxies - the GLS Q 2237+0305 remains
a unique gravitationally lensed system, an exception among the lensed systems.
For comparison, for the GLS Q 2345+007 the probability for the two-plane lens is
estimated to be
1.2 10-3 or less depending on the solution
type adopted (Subramanian & Chitre 1984). However, the GLS Q 2345+007
is a two image system and the lensing galaxy is a high redshift galaxy (
 ,
Fischer et al. 1994), so one gets higher probability compared with the
GLS Q 2237+0305.
,
Fischer et al. 1994), so one gets higher probability compared with the
GLS Q 2237+0305.
In this paper we have presented one-plane lens models (with and without an
external shear added) and a two-plane lens model for the GLS Q 2237+0305.
The first (the main) lens plane is at z=0.0394 and the second lens plane
is at z=0.5664. All models are based on an isothermal mass distribution
(Kassiola & Kovner 1993).
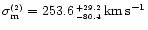
We summarize the findings of this paper as follows:
- 1.
- We modelled the GLS Q 2237+0305 using the most accurate image
positions (HST) up to now and realistic radio flux ratios (VLA) both used
as observational constraints;
- 2.
- We found the best gravitational lens solutions for the GLS Q
2237+0305 up to now -
equals to 0.35 and 0.44 for the
PIE+XS and the PIE+SIS models, respectively, showing that the main source of
the external shear in this system is probably the object associated with
the Mg II absorption at z=0.5664;
- 3.
- We derived the parameters of the pseudoisothermal mass distribution
(averaged over the PIE+XS and the PIE+SIS models unless otherwise specified)
in the central part of the lensing SBb galaxy: a model velocity dispersion
 which translates to a central
velocity dispersion
and to an asymptotic rotational velocity
which translates to a central
velocity dispersion
and to an asymptotic rotational velocity
 ;
an upper limit on the core radius of 36 pc
(PIE+SIS model); a minor-to-major axis ratio f=0.676;
a position angle of the model major axis
;
an upper limit on the core radius of 36 pc
(PIE+SIS model); a minor-to-major axis ratio f=0.676;
a position angle of the model major axis
 ;
;
- 4.
- The introduction of the second lens plane leaves the core radius, the axis
ratio and the position angle of the mass distribution in the main lens almost
unchanged but decreases the mass inside the mean ring of the images with 1.2%
and increases the total magnification of the images by a factor of 1.5;
- 5.
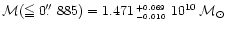
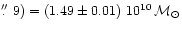
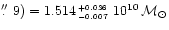
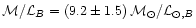
- For the PIE+SIS model the mass of the SBb galaxy inside the mean ring of
the images is
and the blue mass-to-light ratio for the central
of the SBb galaxy is
;
- 6.
- We determined some parameters of the second lens which is
connected with the Mg II absorption (assuming that the second lens
is a single elliptical galaxy) as follows: a model velocity dispersion
 which
translates to a central velocity dispersion
with
possible additional uncertainity up to 40%;
a luminousity
;
radius of the
Mg II absorbing halo greater than 14 kpc;
which
translates to a central velocity dispersion
with
possible additional uncertainity up to 40%;
a luminousity
;
radius of the
Mg II absorbing halo greater than 14 kpc;
- 7.
- The probability for the two-plane lens model PIE+SIS is estimated to be
8.0 10-9.
- 8.
- We found the B magnitudes for the unlensed quasar to be
and
for the PIE+XS and the PIE+SIS models, respectively.
Accounting for the presented models as well as for the models of Schmidt
et al. (1998) and of Chae et al. (1998) we can claim that the mass
distribution in the central part of the SBb galaxy is nearly singular and
nearly isothermal and that the contribution of the bar and of the Mg II
absorbers to the lensing must be taken into account.
To go further in the study of the mass distribution in the GLS G 2237+0305
via gravitational lensing we need more accurate observational constraints.
These could include: HST observations from IR to UV bands in order to get
accurate image and SBb galaxy positions as well as to derive accurately the
light distribution in the central part of the SBb galaxy (where most of the
mass relevant for the lensing is situated); emission line imaging in order
to get constraints from the observed arc of extended emission; radio and
infrared observations in order to determine accurately the flux ratios; spectral
observations in order to determine accurately the velocity dispersion and
the rotation curve of the SBb galaxy. Deep optical, infrared and radio observations
could also set a tight upper limit on the flux ratio of the fifth quasar
image (or even detect it!). Furthermore, we have to explore more complicated
lens mass models - any final model must include perturbations (we have
either to expand or explicitly to take into account the perturbers'
potentials).
It will be interesting to obtain a mass estimation for the SBb galaxy-lens
via other methods - analysis of the rotation curve and of the light
distribution, and to compare the mass obtained through that analysis with its
lensing mass. The proximity of the main lens in the GLS Q 2237+0305 provides
for us this opportunity.
Acknowledgements
The author is thankful to Dr. G. Petrov and Dr. A. Strigachev for useful
discussions and to PhD student L. Slavcheva-Mihova for the help in preparing
the manuscript. Special thanks to the anonymous referee whose critical
comments significantly improved the manuscript.
-
Agol, E., Jones, B., & Blaes, O. 2000, ApJ, 545, 657
In the text
NASA ADS
-
Bechtold, J., & Ellingson, E. 1992, ApJ, 396, 20
In the text
NASA ADS
-
Bergeron, J., & Boissé, P. 1991, A&A, 243, 344
In the text
NASA ADS
-
Bergeron, J., Cristiani, S., & Shaver, P. A. 1992, A&A, 257, 417
In the text
NASA ADS
-
Blandford, R. D., & Narayan, R. 1992, ARA&A, 30, 311
In the text
NASA ADS
-
Blanton, M., Turner, E. L., & Wambsganss, J. 1998, MNRAS, 298, 1223
In the text
NASA ADS
-
Breimer, T. G., & Sanders, R. H. 1993, A&A, 274, 96
In the text
NASA ADS
-
Burud, I., Stabell, R., Magain, P., et al. 1998, A&A, 339, 701
In the text
NASA ADS
-
Chae, K.-H., Turnshek, D. A., & Khersonsky, V. K. 1998, ApJ, 495, 609
In the text
NASA ADS
-
Chincarini, G., & Rood, H. J. 1976, PASP, 88, 388
In the text
NASA ADS
-
Corrigan, R. T., Irwin, M. J., Arnaud, J., et al. 1991, AJ, 102, 34
In the text
NASA ADS
-
Crane, P., Albrecht, R., Barbieri, C., et al. 1991, ApJ, 369, L59
In the text
NASA ADS
-
de Vaucouleurs, G., & Olson, D. W. 1982, ApJ, 256, 346
In the text
NASA ADS
-
Drinkwater, M. J., Webster, R. L., & Thomas, P. A. 1993, AJ, 106, 848
In the text
NASA ADS
-
Ehlers, J., & Schneider, P. 1986, A&A, 168, 57
In the text
NASA ADS
-
Erdl, H., & Schneider, P. 1993, A&A, 268, 453
In the text
NASA ADS
-
Faber, S. M., & Jackson, R. E. 1976, ApJ, 204, 668
In the text
NASA ADS
-
Falco, E. E., Lehár, J., Perley, R. A., Wambsganss, J., & Gorenstein, M. V. 1996, AJ, 112, 897
In the text
NASA ADS
-
Fischer, P., Tyson, J. A., Bernstein, G. M., & Guhathakurta, P. 1994, ApJ, 431, L71
In the text
NASA ADS
-
Fitte, C., & Adam, G. 1994, A&A, 282, 11
In the text
NASA ADS
-
Foltz, C. B., Hewett, P. C., Webster, R. L., & Lewis, G. F. 1992, ApJ, 386, L43
In the text
NASA ADS
-
Hernquist, L. 1990, ApJ, 356, 359
In the text
NASA ADS
-
Hewett, P. C., Irwin, M. J., Foltz, C. B., et al. 1994, AJ, 108, 1534
In the text
NASA ADS
-
Hintzen, P., Maran, S. P., Michalitsianos, A. G., et al. 1990, AJ, 99, 45
In the text
NASA ADS
-
Huchra, J., Gorenstein, M., Kent, S., et al. 1985, AJ, 90, 691
In the text
NASA ADS
-
Irwin, M. J., Webster, R. L., Hewett, P. C., Corrigan, R. T., & Jedrzejewski, R. I. 1989, AJ, 98, 1989
In the text
NASA ADS
-
Kayser, R., & Schramm, T. 1988, A&A, 191, 39
In the text
NASA ADS
-
Kayser, R. 1990, ApJ, 357, 309
In the text
NASA ADS
-
Kassiola, A., & Kovner, I. 1993, ApJ, 417, 450
In the text
NASA ADS
-
Kassiola, A., & Kovner, I. 1995, MNRAS, 272, 363
In the text
NASA ADS
-
Keeton, C. R., Kochanek, C. S., & Seljak, U. 1997, ApJ, 482, 604
In the text
NASA ADS
-
Keeton, C. R., Kochanek, C. S., & Falco, E. E. 1998, ApJ, 509, 561
NASA ADS
-
Keeton, C. R., Mao, S., & Witt, H. J. 2000, ApJ, 537, 697
In the text
NASA ADS
-
Kent, S. M., & Falco, E. E. 1988, AJ, 96, 1570
In the text
NASA ADS
-
Kochanek, C. S., & Apostolakis, J. 1988, MNRAS, 235, 1073
In the text
NASA ADS
-
Kochanek, C. S. 1991, ApJ, 373, 354
In the text
NASA ADS
-
Kochanek, C. S. 1992, ApJ, 397, 381
In the text
NASA ADS
-
Kochanek, C. S. 1993, ApJ, 419, 12
In the text
NASA ADS
-
Le Brun, V., Bergeron, J., Boissé, P., & Christian, C. 1993, A&A, 279, 33
In the text
NASA ADS
-
Marzke, R. O., Geller, M. J., Huchra, J. P., & Corwin, Jr. H. G. 1994, AJ, 108, 437
In the text
NASA ADS
-
Mediavilla, E., Arribas, S., del Burgo, C., et al. 1998, ApJ, 503, L27
In the text
NASA ADS
-
Minakov, A. A., & Shalyapin, V. N. 1991, AZh Lett., 17, 331
In the text
-
Østensen, R., Refsdal, S., Stabell, R., et al. 1996, A&A, 309, 59
In the text
NASA ADS
-
Petrov, G., Strigachev, A., & Mihov, B. 1996, C.r. l'Acad. bulg. Sci., 49, 5
In the text
-
Press, W. H., Flannery, B. P., Teukolski, S. A., & Vetterling, W. T. 1986,
Numerical Recipes (Cambridge Univ. Press, Cambridge)
In the text
-
Racine, R. 1991, AJ, 102, 454
In the text
NASA ADS
-
Richstone, D. O., & Tremaine, S. 1984, ApJ, 286, 27
In the text
NASA ADS
-
Rix, H.-W., Schneider, D. P., & Bahcall, J. N. 1992, AJ, 104, 959
In the text
NASA ADS
-
Rubin, V. C., Burstein, D., Kent Ford, Jr. W., & Thonnard, N. 1985, ApJ, 289, 81
In the text
NASA ADS
-
Schmidt, R., Webster, R. L., & Lewis, G. F. 1998, MNRAS, 295, 488
In the text
NASA ADS
-
Schneider, D. P., Turner, E. L., Gunn, J. E., et al. 1988, AJ, 95, 1619
In the text
NASA ADS
-
Schramm, T., & Kayser, R. 1987, A&A, 174, 361
In the text
NASA ADS
-
Subramanian, K., & Chitre, S. M. 1984, ApJ, 276, 440
In the text
NASA ADS
-
Teuber, J., Østensen, R., Stabell, R., & Florentin-Nilsen, R. 1994, A&AS, 108, 509
In the text
NASA ADS
-
Tonry, J. L. 1983, ApJ, 266, 58
In the text
NASA ADS
-
Trotter, C. S., Winn, J. N., & Hewitt, J. N. 2000, ApJ, 535, 671
In the text
NASA ADS
-
Vakulik, V. G., Dudinov, V. N., Zheleznyak, A. P., et al. 1997, Astron. Nachr., 318, 73
In the text
NASA ADS
-
Wallington, S., & Narayan, R. 1993, ApJ, 403, 517
In the text
NASA ADS
-
Wambsganss, J., & Paczynski, B. 1994, AJ, 108, 1156
In the text
NASA ADS
-
Webster, R. L., Ferguson, A. M. N., Corrigan, R. T., & Irwin, M. J. 1991, AJ, 102, 1939
In the text
NASA ADS
-
Williams, L. L. R., & Saha, P. 1995, AJ, 110, 1471
In the text
NASA ADS
-
Whitmore, B. C., McElroy, D. B., & Tonry, J. L. 1985, ApJS, 59, 1
In the text
NASA ADS
-
Witt, H. J., Mao, S., & Schechter, P. L. 1995, ApJ, 443, 18
In the text
NASA ADS
-
Witt, H. J. 1996, ApJ, 472, L1
In the text
NASA ADS
-
Witt, H. J., & Mao, S. 1997, MNRAS, 291, 211
In the text
NASA ADS
-
Yanny, B., & York, D. G. 1992, ApJ, 391, 569
In the text
NASA ADS
-
Yee, H. K. C. 1988, AJ, 95, 1331
In the text
NASA ADS
-
Zwicky, F., Karpowicz, M., & Kowal, C. 1965, Catalogue of Galaxies
and Clusters of Galaxies (California Institute of Technology, Pasadena), vol. V
In the text
Copyright ESO 2001
![\begin{figure}
\par\includegraphics[width=8.4cm,clip]{H1099F1.EPS}\end{figure}](/articles/aa/full/2001/16/aah1099/img148.gif)
![\begin{figure}
\par\includegraphics[width=8.4cm,clip]{H1099F2.EPS}\end{figure}](/articles/aa/full/2001/16/aah1099/img164.gif)