![[*]](/icons/foot_motif.gif)
A&A 369, 1048-1057 (2001)
DOI: 10.1051/0004-6361:20010163
Ph. Prugniel1 - C. Soubiran2
1 - CRAL-Observatoire de Lyon, CNRS UMR 142, 69561 Saint-Genis Laval, France
2 -
Observatoire de Bordeaux, CNRS UMR 5804, BP 89, 33270 Floirac, France
Received 27 November 2000 / Accepted 26 January 2001
Abstract
We present a database of 908 spectra of 709 stars obtained with the
ELODIE spectrograph at the Observatoire de Haute-Provence.
52 orders of the echelle spectra have been carefully fitted together to provide
continuous, high-resolution spectra in the
wavelength range
 nm. The archive provides a large coverage of the
space of atmospheric parameters:
nm. The archive provides a large coverage of the
space of atmospheric parameters:
 from 3700 K to 13600 K,
  from 0.03 to 5.86
and [Fe/H] from -2.8 to +0.7.
At the nominal resolution,
from 0.03 to 5.86
and [Fe/H] from -2.8 to +0.7.
At the nominal resolution,  ,
the mean signal-to-noise ratio is
150 per pixel. The spectra given at this resolution are normalized to their
pseudo-continuum and are intended to serve for abundance studies, spectral
classification and tests of stellar atmosphere models.
A lower resolution version of the archive, at
,
the mean signal-to-noise ratio is
150 per pixel. The spectra given at this resolution are normalized to their
pseudo-continuum and are intended to serve for abundance studies, spectral
classification and tests of stellar atmosphere models.
A lower resolution version of the archive, at  ,
is calibrated in
physical flux with a broad-band photometric precision of 2.5% and
narrow-band precision of 0.5%. It is well suited to stellar population
synthesis of galaxies and clusters, and to kinematical investigations of
stellar systems.
The archive is distributed in FITS format through the HYPERCAT and CDS databases.
,
is calibrated in
physical flux with a broad-band photometric precision of 2.5% and
narrow-band precision of 0.5%. It is well suited to stellar population
synthesis of galaxies and clusters, and to kinematical investigations of
stellar systems.
The archive is distributed in FITS format through the HYPERCAT and CDS databases.
Key words: atlases - stars: abundances - stars: atmospheres - stars: fundamental parameters - galaxy: stellar content
Spectral libraries covering the HR diagram with medium to high resolution and large spectral range are essential tools in astronomy. We have identified two areas where there will be a special need of such libraries in the coming years: the automated parameterization of stellar spectra and the spectral synthesis of stellar populations of galaxies. New multi-object spectrographs on large telescopes, such as Giraffe on the VLT, will soon make it possible to observe hundreds of objects during the same exposure with an unprecedented resolution and spectral coverage. The challenge will be to extract the maximal information in a reasonable time.
For stars, medium to high resolution spectra are the basis for determining
radial velocities,
atmospheric parameters (
,
,
[Fe/H]) and eventually projected rotational
velocities,  .
A new method, called TGMET, is emerging to make the parameterization
of stellar spectra in terms of temperature, gravity and metallicity fast and
automatic (Katz et al. 1998).
It relies on the direct comparison of a target spectrum to a library of
reference spectra with known atmospheric
parameters (Soubiran et al. 1998). TGMET was originally dedicated to the
measurement of F, G, K
stars observed with ELODIE. The present paper continues the TGMET project.
The two major
points addressed are (1) the extension of the reference library to all spectroscopic
types and luminosity classes and its densification, and (2) to resample the spectra in
wavelength (i.e. remove the instrumental signature in ELODIE spectra and connect the
echelle orders together) in order to enable comparison of spectra
of any origin.
.
A new method, called TGMET, is emerging to make the parameterization
of stellar spectra in terms of temperature, gravity and metallicity fast and
automatic (Katz et al. 1998).
It relies on the direct comparison of a target spectrum to a library of
reference spectra with known atmospheric
parameters (Soubiran et al. 1998). TGMET was originally dedicated to the
measurement of F, G, K
stars observed with ELODIE. The present paper continues the TGMET project.
The two major
points addressed are (1) the extension of the reference library to all spectroscopic
types and luminosity classes and its densification, and (2) to resample the spectra in
wavelength (i.e. remove the instrumental signature in ELODIE spectra and connect the
echelle orders together) in order to enable comparison of spectra
of any origin.
The TGMET project appeared to be also very useful for extragalactic studies where medium resolution libraries with large coverage in stellar parameters are needed. Stellar libraries, calibrated in flux, are used to model composite spectra through stellar population synthesis (e.g. the PEGASE program, Fioc & Rocca-Volmerange 1997). An important issue is to disentangle the effects of age and metallicity and it has been demonstrated that the spectral resolution is a key factor (Worthey & Ottviani 1997, hereafter WO97; Vazdekis 1999). To benefit from a resolution higher than about R=2000both the internal kinematics and the characteristics of the stellar populations must be fitted simultaneously. Making available an extended library of stellar spectra is the first step in this direction.
Current libraries are based on
low resolution spectroscopy (e.g. Jacoby et al. 1984; Serote Roos et al. 1996;
Pickles 1998) or they are
restricted to a limited area of the HR diagram (e.g. Montes et al. 2000 and
Soubiran et al. 1998 for F, G, K
stars). Here we present an homogeneous dataset of spectra which fills the
deficiency of such libraries.
The sample of stars and associated data are presented in Sect. 2.
Sections 3 and 4
describe the two phases of the data processing. In Sect. 5 we evaluate the quality of the archive.
The access to the data through HYPERCAT
or at the Centre de Données astronomiques de Strasbourg
are described in Sect. 6.
The present sample was assembled by merging the stellar library of F, G, K stars
(Soubiran et al. 1998) serving as a basis for the TGMET program
with additional spectra taken from other observing programs and from
the near-to-line ELODIE archive (http://www.obs-hp.fr).
The spectra of the database correspond to stars which have been selected because
they have published values of
or (
,
,
[Fe/H]), or reliable estimations of
the absolute magnitude MV, deduced from Hipparcos parallaxes.
The main source of atmospheric
parameters is the catalogue of [Fe/H] determinations, 1996 and 2001 versions (Cayrel de Strobel
et al. 1997 and
2001) but two other sources have been also used:
Carney et al. (1994) and Thévenin (1998). Effective
temperatures were also taken in the lists published by Blackwell & Lynas-Gray (1998),
Alonso et al. (1996a) and
Alonso et al. (1999a), or calculated from the colour indices V-K or b-y following the relations
 (colour, [Fe/H]) established by
Alonso et al. (1996b) and (1999b) for dwarfs and giants respectively.
Each star had (
,
,
[Fe/H]) estimated by averaging
the determinations found in the literature, giving a half weight to old references and Strömgren
photometry and a double weight to
determined by Blackwell & Lynas-Gray (1998).
As in the TGMET library, the parameters were then labelled according to
their reliability
which was estimated from the
number of determinations and their standard deviation around the mean. The reliability scale runs
from 0 to 4, with the highest reliability 4 corresponding to uncertainties lower than 80 K in
,
and 0.06 dex in [Fe/H]. These uncertainties can reach 115 K and 0.09 dex for reliability 3, and 150 K and
0.11 dex for the reliability 2. Reliability 1 is attributed for parameters based on old determinations or photometry, or
presenting
large discrepancies between references. Reliability 0 means that no reference on atmospheric parameters
was found in the literature.
The database consists of
908 spectra corresponding to 709
different stars which are shown in the plane (
(colour, [Fe/H]) established by
Alonso et al. (1996b) and (1999b) for dwarfs and giants respectively.
Each star had (
,
,
[Fe/H]) estimated by averaging
the determinations found in the literature, giving a half weight to old references and Strömgren
photometry and a double weight to
determined by Blackwell & Lynas-Gray (1998).
As in the TGMET library, the parameters were then labelled according to
their reliability
which was estimated from the
number of determinations and their standard deviation around the mean. The reliability scale runs
from 0 to 4, with the highest reliability 4 corresponding to uncertainties lower than 80 K in
,
and 0.06 dex in [Fe/H]. These uncertainties can reach 115 K and 0.09 dex for reliability 3, and 150 K and
0.11 dex for the reliability 2. Reliability 1 is attributed for parameters based on old determinations or photometry, or
presenting
large discrepancies between references. Reliability 0 means that no reference on atmospheric parameters
was found in the literature.
The database consists of
908 spectra corresponding to 709
different stars which are shown in the plane ( ,
)
in Fig. 1 and in the
plane (
,
[Fe/H]) in Fig. 2.
ranges from 3700 K to 13600 K,
ranges
from 0.03 to 5.86
and [Fe/H] ranges from -2.8 to +0.7. In these two plots, new estimations of (
,
,
[Fe/H]) were used instead of
those from the literature, which are incomplete. These new estimations were obtained with
the current version
of TGMET which is still under development (a paper presenting this new version is in preparation
and a description is given in the electronic version of the archive).
Atmospheric parameters from the literature together with new estimations and measured line indices
from the spectra presented here are
given in Table 1, available only in electronic form (see Sect. 6).
,
)
in Fig. 1 and in the
plane (
,
[Fe/H]) in Fig. 2.
ranges from 3700 K to 13600 K,
ranges
from 0.03 to 5.86
and [Fe/H] ranges from -2.8 to +0.7. In these two plots, new estimations of (
,
,
[Fe/H]) were used instead of
those from the literature, which are incomplete. These new estimations were obtained with
the current version
of TGMET which is still under development (a paper presenting this new version is in preparation
and a description is given in the electronic version of the archive).
Atmospheric parameters from the literature together with new estimations and measured line indices
from the spectra presented here are
given in Table 1, available only in electronic form (see Sect. 6).
![\begin{figure}
\par\includegraphics[width=8.8cm,clip]{MS10505f1.ps}\end{figure}](/articles/aa/full/2001/15/aa10505/img15.gif) |
Figure 1:
vs.
for the 709 stars of the archive. For the sake of homogeneity,
the atmospheric parameters presented here are not from the literature, which is incomplete, but were
estimated with the current version of TGMET (Sect. 5.3.3) |
| Open with DEXTER | |
More information on each star is available in the header of the FITS spectra.
It includes
the absolute magnitude MV from
Hipparcos parallaxes when available. A scale of reliability was also established from the precision of the
parallax and V magnitude from Tycho-2 (Høg et al. 2000), 4 corresponding to parallaxes with a
precision better than 10%. Also available in the FITS headers are the spectral types,
(V, B-V) taken from the Tycho-2
catalogue (converted from the Tycho-2  and
and  )
and radial velocities usually measured at the telescope.
The on-line cross-correlation technique
was used to measure the radial velocity of strong-lined spectra, corresponding to moderate
effective temperatures up to 6500 K but for hotter stars, the radial velocity was estimated using a
least-squares deconvolution technique (Donati et al. 1997).
)
and radial velocities usually measured at the telescope.
The on-line cross-correlation technique
was used to measure the radial velocity of strong-lined spectra, corresponding to moderate
effective temperatures up to 6500 K but for hotter stars, the radial velocity was estimated using a
least-squares deconvolution technique (Donati et al. 1997).
The database includes several stars with line profiles broadened by rotation, macroturbulence or binarity and a few stars with spectral peculiarities (Ap, Am, emission line stars...). These pecularities are indicated in the headers.
![\begin{figure}
\par\includegraphics[width=8.8cm,clip]{MS10505f2new.ps}\end{figure}](/articles/aa/full/2001/15/aa10505/img18.gif) |
Figure 2:
Distribution of the 709 stars of the archive in the plane
vs. [Fe/H] estimated with the current version of TGMET (Sect. 5.3.3) |
| Open with DEXTER | |
ELODIE provides a spectral range of 390-680 nm
recorded in a single
exposure as 67 orders on a 1K CCD at a mean resolving power
of 42000.
Optimal extraction and wavelength calibration are automatically performed
by the on-line reduction software TACOS. Complete information on ELODIE can be found in Baranne et al.
(1996) and in the TACOS user manual by Queloz (1996).
The global efficiency of the
instrument drops in the blue by a factor 5 at 440 nm for a
solar-type star and by a factor 50 at 390 nm. Hence we decided to
limit the spectral range to
nm.
The typical signal-to-noise (S/N) ratio per pixel at 550 nm is 150 (it is higher than 80 for more than 90% of the spectra). Several spectra with a lower S/N, down to 35, correspond generally to faint deficient stars which have been included in the database for a better sampling of the parameter space.
For the present purpose, the 908 spectra of the database were processed to provide 1D spectra rebinned in wavelength and calibrated in absolute fluxes. Since the main goal of the archive was to construct a library of spectra representative of the various stellar types and an interpolated grid of spectra covering the parameter space, all the spectra were reduced to the rest-frame. The archive was prepared from the flat-fielded and order-extracted TACOS spectra in two main steps. (1) The orders were de-blazed, the spikes due to cosmic rays and telluric lines were masked, all the orders were connected in one spectrum, and the pseudo-continuum normalization was computed. (2) The spectra were calibrated into "physical'' flux, i.e. above the atmosphere.
This phase of the data processing takes the TACOS spectra and delivers order-connected spectra with a constant wavelength step. Both the instrumental and continuum fluxes are evaluated.
The operations follow these steps:
and )
to 1D spectra.
The instrument, hard- and soft-ware, was mostly designed as a "velocimeter" and hence the spectrophotometric quality was not optimized. The standard flat-field correction and order extraction was applied as described in Baranne et al. (1996). However, the procedure is not sufficient to connect the orders into a single spectrum, because the blaze function is imperfectly corrected. Actually, after the standard correction, each order presents a residual "curvature'' of about 2%. This effect is certainly due to diffuse light within the spectrograph which is imperfectly subtracted by the TACOS program, this is a common difficulty with echelle spectrographs.
To solve this problem we had to analyze this residual curvature on the actual spectra and correct it. Obviously, it is a risky approach since the spectrum itself is used to determine the correction. To minimize possible biases, the residual curvature is modeled with only a few parameters: each order is represented by a second degree polynomial whose coefficients are not independent from order to order, but are themselves second degree polynomials of the order number. The total effect of the diffuse light is modeled by only 3 coefficients.
Practically, we divide the TACOS spectrum by a de-blazing function determined from a tungsten-lamp spectrum (internal flat-field) and corrected using 3 metal-deficient stars (because the blaze function appears to have slight systematic differences between internal flat-field and star).
To analyze the "residual'' curvature of each order,
we normalized the spectrum to its
pseudo-continuum, defined as a
 degree spline interpolation
from one point in each order.
Each point is
determined by fitting a second degree polynomial
to the order weighted with a mask to avoid as much
as possible the stellar lines. The fit is iterated after
degree spline interpolation
from one point in each order.
Each point is
determined by fitting a second degree polynomial
to the order weighted with a mask to avoid as much
as possible the stellar lines. The fit is iterated after
 clipping and the remaining bias due to the weak stellar lines is statistically
corrected.
The latter correction is based on the analysis of the skewness of the
distribution of residuals. The weighting mask is prepared from a previous
iteration of the reduction of the whole archive: for each wavelength
point it gives the probability of having a stellar line
(we started with no weight).
clipping and the remaining bias due to the weak stellar lines is statistically
corrected.
The latter correction is based on the analysis of the skewness of the
distribution of residuals. The weighting mask is prepared from a previous
iteration of the reduction of the whole archive: for each wavelength
point it gives the probability of having a stellar line
(we started with no weight).
Though the visual inspection of the strengthened spectra appears satisfactory, the (unsuccessful) search for possible biases is presented in Sect. 5.
After the correction for diffuse light was applied, the pseudo-continuum was re-computed. These normalized spectra are scoped for abundance studies, and determination of the atmospheric parameters with TGMET.
All the information permitting calculation of the detected flux (in electrons) is kept in the form of a table extension attached to the FITS image. The S/N of each pixel is also kept in a separate extension. The detailed description of the FITS files is given with the electronic version of the tables and spectra.
The spikes due cosmics and defective pixels and the telluric lines have been masked following the procedure developed by Katz et al. (1998).
The orders are normalized to their pseudo-continuum and resampled to a 1D spectrum with a wavelength step of 0.005 nm using spline interpolation (the observations are over-sampled by about 20%).
To produce a version of the archive at the resolution 10000
(i.e. 30 kms-1 at  = 550 nm) the spectra are convolved
by a Gaussian
function of
FWHM = 0.054 nm, and rebinned with a step of 0.02 nm.
= 550 nm) the spectra are convolved
by a Gaussian
function of
FWHM = 0.054 nm, and rebinned with a step of 0.02 nm.
The high resolution version has a constant resolution of ,
i.e.
the resolution in nm changes with the wavelength. At variance, with the
low resolution archive, the wavelength resolution, in nm, is constant
throughout the spectra.
Note also that the convolution to produce the low resolution archive is done on the continuum-normalized spectra, which is not formally equivalent to convolving the flux-calibrated spectra. However, the induced difference is absolutely insignificant.
The goal of the flux calibration is to determine the spectral energy distribution above the atmosphere (the physical flux). The standard procedure to achieve the objective (Bessell 1999) consists of determining the instrumental response and correcting for the atmospheric absorption by comparing the spectra to templates of known spectral energy distribution observed with the same setup between the target stars.
Since the primary scope of the observation was not spectrophotometry, no particular care was taken in interleaving template stars and some observations were done through heavy atmospheric absorption. Therefore, the standard procedure cannot be straightforwardly applied.
The relation between the instrumental flux deduced in the previous section and the physical flux (the flux calibration relation) primarily reflects the effects of (1) the instrumental response (i.e. the combined effect of the whole optics and CCD spectral sensitivity), (2) the absorption by a clear atmosphere and (3) an additional extinction due to an atmospheric haze.
We started from the assumptions that (1) the instrumental response is stable or at least stable during each observing run, (2) the absorption by the clear atmosphere can be parameterized by the airmass and (3) the effect of the haze can be parameterized by a color excess defined as the difference between the measured B-V color and the Tycho-2 B-V color.
A fit of these three functions of the wavelength using spectra of stars with known spectral energy distribution (discussed below) resulted in a photometric precision of about 5% when we considered the instrumental response stable over all observation runs.
The shape of the three functions entering the calibration relation, and the analysis of the residuals, lead to the suspicion that the correction of the atmospheric refraction provided by the spectrograph was not fully effective. This was diagnosed by (1) a stronger than expected wavelength dependence of the apparent atmospheric and haze transmissions and (2) a residual random "curvature'' of the calibrated spectra that increases with airmass. Our interpretation is that the "clear atmosphere'' function corrects to a first order the effect of the refraction (the star is centered on the fiber aperture by the auto-guider on the blue end of the atmospheric spectrum). The uncertainty on the centering of the star (mis-guiding) results in a "color excess'' absorbed by the haze function, but depending on the value of the off-centering and of the seeing, a residual curvature remains.
It was unfortunately not possible to parameterize this effect since it depends on a random and unknown miss-centering and on the seeing which is not always recorded in the observing logs. An alternative would have been to use an additional color excess to constrain the curvature, but no such independent measurement is available for the stars of our archive.
Adding a quadratic airmass term, another function of color excess and allowing for variation of the instrumental response between the different observing runs led to a photometric quality of about 3% which was then improved to 2% after corrections based on internal comparisons. We did not find hints for other effect on the photometric quality, such as the effect of the stress on the optical fiber or positioning of the color correction filter that may change the instrumental response.
Finally, calibration consisted in: (1) primary calibration based on the comparison with low spectral resolution flux templates (2) secondary calibration based on internal comparison and (3) correction of the instrumental response using template spectra with a better spectral resolution than for the primary calibration.
As already explained, the observations were not originally destined for photometry and no flux templates were explicitly observed. However, since the archive contains bright stars, many of them belong also to other libraries or datasets.
The largest intersection is with the collection of low resolution spectra presented in Burnashev (1985, CDS III/126). The spectral resolution is about R=100 ( FWHM = 5-6 nm), and the observations are from different sources which were homogenized to a common scale. The observations were done with photo-electric spectro-photometers mostly at the Crimean Observatory, and are not corrected for interstellar extinction.
Some stars in our archive are in common with other datasets with a better spectral resolution, but not in a number sufficient to fit the calibration relation. For this reason we chose to first calibrate the archive with this dataset. It was entered in the Hypercat Fits Archive (HFA) with the identification L1985BURN.
The first step was to assess the photometric quality of these templates. The B and V magnitudes were integrated on the spectra and compared with the measurements converted from the Tycho-2 catalogue. We found a rms difference on B-V of 0.05. The difference with the Tycho-2 color is used to assign a weight to each of these template observations.
The determination of the calibration relation is done after the instrumental spectra from our archive are convolved to the resolution of L1985BURN. The original reference does not precisely document this resolution which varies with the origin of the observations, and we had to determine it. A first guess was obtained by fitting Gaussians on strong Balmer lines and this was fine-tuned afterwards to minimize the residuals on the strong lines. It was necessary to adopt slightly different resolutions for the blue and red parts of the spectra.
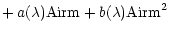
The model adopted for the primary calibration relation is:
 |
= |  |
|
 |
|||
 |
(1) |
 is the physical flux reduced above the atmosphere.
The two right-hand terms
is the physical flux reduced above the atmosphere.
The two right-hand terms
 and
and
 represent the instrumental response.
The first is stable over all the observing runs while the second is
variable. We separated the two terms because the second could not
be determined for all the observing runs: when the number of calibrated
observations was less than 10 the second term was not computed and
assumed to be 0. The run-dependent instrumental response was determined
for 9 runs out of 21, and a secondary calibration (next sub-section) was also obtained.
represent the instrumental response.
The first is stable over all the observing runs while the second is
variable. We separated the two terms because the second could not
be determined for all the observing runs: when the number of calibrated
observations was less than 10 the second term was not computed and
assumed to be 0. The run-dependent instrumental response was determined
for 9 runs out of 21, and a secondary calibration (next sub-section) was also obtained.
The next two terms depend on the airmass (Airm). The first accounts
for the clear atmosphere absorption and mean aperture effect due to
the atmospheric extinction. The second partly corrects the "curvature''
of the spectrum due to the refraction (the length of the atmospheric
spectra is proportional to  ,
z being the zenithal distance).
,
z being the zenithal distance).
The two last terms are parameterized by a B-V color excess, defined as the difference between B-V determined on our spectra and the Tycho-2 B-V.
It is not possible to measure directly the B magnitude on our spectra since the standard B band extends farther blue-ward than their limit. Hence it was necessary to "calibrate'' a different color, by fitting a color equation as is usually done to convert between photometric systems. This procedure has the disadvantage that it formally depends on the actual spectral energy distribution of the star and hence may introduce a bias linked to the atmospheric parameters of the stars. However, such an effect may be estimated from the residuals of the fit of the color equation, and for small color terms (i.e. if our internal B is close to the Johnson B) it can be neglected.
Since this conversion was necessary, we used this opportunity to define 2 B bands (b1 and b2, converted to Johnson scale as B1 and B2)
giving two estimates of the color excess.
The difference between these two estimates gives an approximate measure of the
residual curvature of the spectra due to the atmospheric dispersion.
| E(B-V) | = |  |
(2) |
| E(B-V)' | = | B2 - B1. | (3) |
 nm
and
nm
and
 nm.
nm.
The color equation was determined with the 2238 spectra of L1985BURN,
using ordinary least squares and iterative rejection of outliers, as:
| b1 | = | 14.830 + 1.001 B1 - 0.337 (B-V) | (4) |
| b2 | = | 15.195 + 1.003 B2 - 0.081 (B-V). | (5) |
The flux calibration relation was fitted on 369 spectra of stars in common
between our archive and L1985BURN. The different functions of the wavelength
were finally smoothed by fitting polynomials in order to erase the residual
effects of resolution mis-matching which results in spurious irregularities
in these functions (in particular around H and G-band).
The primary calibration allowed us to determine the run-dependent response for only half the runs (but more than half the spectra since the number of stars is not equal in each run).
The inter-comparison of spectra of the same stars for which several observations were available allowed a secondary calibration. The runs where the run-dependent response was available were used as "template''.
This exercise allowed us to detect a significant change in the response of the instrument between the observations prior to 1995 and those done after. This change seems to be due to a modification of the differential refraction corrector at the end of year 1994. In addition, for two other runs the number of inter-comparisons was large enough to adopt a reliable run-dependent correction. The run-dependent corrections account for a rms photometric effect of about 0.025 mag. For 9 runs no such correction is available at present.
![\begin{figure}
\par\includegraphics[width=17.8cm,clip]{MS10505f3.eps}\end{figure}](/articles/aa/full/2001/15/aa10505/img35.gif) |
Figure 3: The mean photometric residuals of the 9 libraries used for the correction of the instrumental response (before this corrections). The ordinate is the mean difference (Elodie - reference library) in units of relative physical flux (normalized to 1 at 555 nm). Each dataset is shown on a different line, each being arbitrary y-shifted by 0.05. From bottom to top they are: Jones (blue and red), Serote Roos et al. (OHP and CFH), Jacoby, Kiehling, Danks & Dennefeld, Gunn & Stryker and the Sun. For the purpose of the display these spectra have been slightly smoothed. The top line is the combination of all the individual comparisons which were used to compute the correction to the instrumental response |
| Open with DEXTER | |
Up to this point the flux calibration can be assumed to properly correct the effect of atmospheric absorption and to correct at best the aperture effect due to the differential refraction. However, the instrumental response was evaluated using low-resolution spectra and furthermore had to be smoothed. At variance with the other functions which presumably vary smoothly with wavelength, the instrumental response may be more chaotic.
Therefore, the last step of the calibration process consists of using
higher spectral resolution (
 )
to correct the instrumental
response. These reference spectra are taken from the following dataset,
referenced by their HFA identification:
)
to correct the instrumental
response. These reference spectra are taken from the following dataset,
referenced by their HFA identification:
 nm
the other between
nm
the other between
 nm. This is the highest
resolution reference for stellar spectra yet available for comparison.
This library is not corrected for the aperture effect due to differential
refraction and is not of photometric quality. After re-calibrating the
"color'' of these spectra (defining special color-band as we did for
our spectra for the primary calibration), the mean agreement with our spectra
is satisfactory;
nm. This is the highest
resolution reference for stellar spectra yet available for comparison.
This library is not corrected for the aperture effect due to differential
refraction and is not of photometric quality. After re-calibrating the
"color'' of these spectra (defining special color-band as we did for
our spectra for the primary calibration), the mean agreement with our spectra
is satisfactory;
 ,
also stored in HFA with ).
,
also stored in HFA with ).
The individual comparisons (see Fig. 3) were then combined and produced a mean residual convolved to a resolution of 2 nm FWHM (each order of the original spectrum covers about 4 nm and no correction of the instrumental response at a lower scale is desired). This was used to correct the instrumental response.
![\begin{figure}
\par\includegraphics[width=17.8cm,clip]{MS10505f4.eps}\end{figure}](/articles/aa/full/2001/15/aa10505/img40.gif) |
Figure 4:
Photometric precision deduced from the comparison of multiple
observations of the same star.
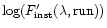
The ordinate are the rms of the 358 pair comparisons (ln(Flux2/Flux1))
(the spiky appearance is due to the logarithmic comparison).
The higher curve is the total rms while the lower one is after third
degree polynomials were subtracted from each individual comparison: this
disentangles the effect of photon noise and uncertainty on the long range
flux calibration (due to the differential refraction).
To obtain the order of magnitude of the photometric error on single
observation, the ordinates should be divided by  |
| Open with DEXTER | |
We also made an unsuccessful attempt to compare our archive with the Pickles
(1998) library (L1998PICK): all the spectra were compared to the nearest
(in the
![$\mbox{$T_{\rm eff}$ }- \mbox{$\log~g$ }- \mbox{[Fe/H]}$](/articles/aa/full/2001/15/aa10505/img41.gif) space) template in L1998PICK. But the mapping of
the parameters space in L1998PICK is not dense enough and the residuals
are too affected by the distance in the parameter space to permit a useful
analysis. We did not attempt to interpolate the spectra within the Pickles
library.
space) template in L1998PICK. But the mapping of
the parameters space in L1998PICK is not dense enough and the residuals
are too affected by the distance in the parameter space to permit a useful
analysis. We did not attempt to interpolate the spectra within the Pickles
library.
To check the reliability of our data and reduction we used the following tests: (1) analyze the inter-comparison of repeated observations and analyze internal consistency, (2) compare fully reduced spectra with other libraries and (3) compare Lick indices for stars with published measurements.
We investigated three possible sources of discrepancy: (1) errors on the instrumental response and/or correction of atmospheric extinction are likely to result in low and intermediate spatial frequencies variations. (2) inaccurate subtraction of the diffuse light may be diagnosed as significant mismatch of the strongest lines and (3) inaccurate correction for the blaze will lead to oscillations with a one-order period.
There are in total 358 repeated observations for 104 stars in the archive.
After giving a double weight to the observations in the runs for
which the run-dependent response was computed from primary calibration
and half weight to the observations done with an airmass larger than 1.5
(their photometric quality is lower because of the differential refraction),
we find a global rms dispersion for the pairwise comparison of about 3.5%,
see Fig. 4. Without weighting, the dispersion is 4% and the difference
was a hint of the lowest
photometric quality of high airmass observations, hence leading to suspicion
about the refraction corrector. Since it is a pairwise comparison,
the mean photometric error on individual observations is:
 .
(Note that this error does not account for
possible systematic errors affecting uniformly the whole archive, this
will be discussed in Sects. 5.2 and 5.3).
.
(Note that this error does not account for
possible systematic errors affecting uniformly the whole archive, this
will be discussed in Sects. 5.2 and 5.3).
Most of the photometric errors lie in the residual "curvature'' of the spectra. After subtracting a third degree polynomial from each pairwise comparison, the rms dispersion becomes 0.7%, corresponding to a mean photometric precision of 0.5%, in full agreement with the mean S/N ratio. No hint for a modulation at the scale of one order of the echelle spectra is found.
Random errors on the strengthening of the spectra are probably on average smaller than 0.5% because otherwise they would increase the dispersion of the pairwise internal comparison (after the third degree polynomial is subtracted).
The new version of the TGMET program that will be described in a separate
paper allowed us to generate interpolated spectra for a given position
in the (
,
,
[Fe/H]) space. The difference between the spectra in the archive and these
modeled spectra can potentially uncover possible random errors on the
strengthening.
Therefore we computed and averaged the differences to the modeled spectra for all the spectra in the archive. The mean residuals were searched for a modulation at the scale of one order, either in the spectrum or in its Fourier transform. We did not detect any signal. We made simulations that suggested that a 0.5% (rms) modulation would probably have been detected, but a 0.2% modulation would not.
The comparisons between our physically calibrated spectra and other libraries were used in the previous section to compute the correction to the instrumental response. The goal was to determine the variation of the response at the scale of 1 to 5 nm that was not constrained by the primary calibration. Therefore, by construction, the mean external comparison is flat (i.e. may only vary smoothly with the wavelength). A careful analysis of the individual comparison could assess the level of stability of the instrumental response.
The patterns in the correction to the instrumental response were consistently found in the different individual comparisons and no significant effect was found after this correction was applied. However, the scarcity of the available comparisons did not allow us to measure a photometric precision.
The Lick indices (see e.g. WO97) measure equivalent widths of features defined in bands of 2 to 5 nm (hence of the width of about 1/2 or 1 order of the echelle spectra). Their measurements are then sensitive to both incorrect strengthening of the spectra and errors in the instrumental response.
The spectral range of the Elodie archive allowed us to measure most of the Lick
indices. Only the blue CN indices are missed as well as the H indices (H
 and H
and H
 )
defined in WO97.
)
defined in WO97.
We used the definitions from WO97 or Cardiel et al. (1998) to measure the indices for all the spectra in the archive. The results are reported in Table 1 (given in the electronic version only).
The measurement errors computed from the photon noise (see e.g. Prugniel et al. 2001) is in the present case negligible because of the extremely high S/N per Å. The main source of error is due to the photometric calibration and may be systematic. The comparison of the Lick indices measured in WO97 constrain the magnitude of these systematic errors.
The archive has 102 stars which have been previously measured in WO97. The comparisons are reported in Table 2.
| Index | # | Mean | Shift | rms | Error |
Ca4227 |
101 | 0.689 | -0.091 | 0.278 | -0.0073 |
| G4300 | 102 | 3.858 | 0.083 | 0.464 | 0.0024 |
H
 |
102 | -1.765 | 0.392 | 0.527 | 0.0089 |
H
 |
99 | 0.678 | 0.177 | 0.337 | 0.0084 |
| Fe4383 | 102 | 2.715 | -0.341 | 0.692 | -0.0067 |
| Ca4455 | 101 | 0.723 | -0.267 | 0.250 | -0.0118 |
| Fe4531 | 101 | 2.299 | -0.078 | 0.335 | -0.0017 |
| Fe4668 | 102 | 2.214 | -0.183 | 0.712 | -0.0021 |
H |
103 | 2.706 | 0.061 | 0.192 | 0.0021 |
| Fe5015 | 102 | 3.393 | -0.197 | 0.449 | -0.0026 |
| Mg1 | 103 | 0.040 | 0.003 | 0.011 | 0.0030 |
| Mg2 | 103 | 0.125 | -0.005 | 0.011 | -0.0054 |
| Mgb | 100 | 2.335 | 0.117 | 0.247 | 0.0036 |
| Fe5270 | 100 | 1.777 | -0.088 | 0.254 | -0.0022 |
| Fe5335 | 102 | 1.515 | -0.035 | 0.279 | -0.0009 |
| Fe5406 | 103 | 0.895 | 0.076 | 0.279 | 0.0028 |
| Fe5709 | 101 | 0.505 | -0.046 | 0.187 | -0.0020 |
| Fe5782 | 101 | 0.313 | -0.095 | 0.168 | -0.0047 |
| NaD | 103 | 1.415 | -0.165 | 0.408 | -0.0051 |
| TiO1 | 103 | 0.006 | -0.006 | 0.011 | -0.0057 |
| TiO2 | 103 | 0.011 | 0.005 | 0.009 | 0.0054 |
We do not find systematic effects that would result from errors in the instrumental errors and the residual dispersions are compatible with the errors in the WO97 measurements (the internal error due to the photon noise in the archive is totally negligible).
The systematic shifts are always smaller than the dispersion except for
Ca4455 (where it is equal) and for Fe4383 the shift may be significant.
However, we cannot attribute this to an error in our measurements and in
particular we note that the shift for Fe4383 is similar to the one found by
WO97 when they compared the original Lick measurements with the spectra
of the Jones library (note that our flux calibration is not fully
independent from the Jones library since this latter was used among others
to correct the instrumental response). The Ca4455 index is not in
the range of the Jones spectra and we cannot comment of the shift we found.
Figure 5 presents the distributions of the differences (us - WO97) for
two indices: Mg2 and H
.
The first one is very important for
extragalactic studies, it is defined on a broad region (53 nm between the
extrema of the red and blue side-bands). Though it is potentially sensitive
to the uncertainties on the flux calibration described above, the agreement
between us and WO97 is excellent. The second index presented in Fig. 5,
H
,
is narrower (14 nm) but it is located in the blue region of
our spectra where our calibration is probably less accurate. There
is a systematic shift with respect to WO97, but the rms residual is
fully accounted for by the errors on WO97.
![\begin{figure}
\par\includegraphics[width=8.8cm,clip]{MS10505f5.eps}\end{figure}](/articles/aa/full/2001/15/aa10505/img48.gif) |
Figure 5:
Comparison of Lick indices Mg2 and H
with WO97.
The abcissae are the difference (Elodie - WO97) between the Lick indices.
The top panels show the distribution as a function of the value in WO97,
and the bottom panels the histograms of the differences |
| Open with DEXTER | |
The spectra are stored in HFA in the form of FITS files containing 4 extensions (Grøsbol et al. 1988):
The first extension is a 1D image header data unit (HDU) containing the spectra calibrated in wavelength expressed in the rest-frame of each star and sampled between 410 and 680 nm. The high resolution version is normalized with a step between the sampling points of 0.005 nm and the low resolution version is given in physical flux with a step of 0.020 nm.
Another image HDU (EXTNAME=NOISE), with the same sampling, contains the noise attached to the values in the primary HDU (in the unit of this spectra). Pixels are independent.
The other extensions are the flux calibration relations which enable to
convert the instrumental flux into physical or normalized
flux. They are binary table extensions and the relations are coded
as spline representations. The details are given in the Pleinpot user's
manual,
and the conversions can be done on-the-fly with the pipeline attached to
HFA.
The physical flux calibration (EXTNAME=FCAPHY) and the normalized flux relation (EXTNAME=FCANOR) have a spectral resolution of about 2 nm.
Each header, which includes the keywords created during the observations
and TACOS reduction,
have been completed with useful information on the star:
spectral type, Tycho-2 V and B-V, absolute magnitude MV and
(
,
,
[Fe/H]) with their reliability flag, and  .
The nominal FWHM of the spectrum
can also be retrieved in the header.
.
The nominal FWHM of the spectrum
can also be retrieved in the header.
In addition to the spectra of the stars, the archive contains the different intermediate files used along the data processing. They are described in the electronic version of the paper.
We have presented an archive of 908 spectra of 709 stars at two resolutions,
and ,
and in the wavelength range
nm. The high resolution version is archived
normalized to its pseudo-continuum while the low resolution is
given in physical flux (above the earth atmosphere) normalized to one
at
 nm.
nm.
The mean S/N per pixel in the high resolution version of the archive is
150 (
 per 0.1 nm), the photometric precision of the
strengthening of the orders of the
echelle spectra is better than 0.5%, the precision in bands of about
10-20 nm is 0.5% and the overall (broad-band) precision is 2.5%, limited by
the effect of differential refraction.
per 0.1 nm), the photometric precision of the
strengthening of the orders of the
echelle spectra is better than 0.5%, the precision in bands of about
10-20 nm is 0.5% and the overall (broad-band) precision is 2.5%, limited by
the effect of differential refraction.
The stars in this archive cover a large range of the parameter space, though the mapping is still crude for hot and very cool stars.
This archive supersedes the TGMET (1996) library and is being used
for automatic determination of the stellar parameters (
,
,
[Fe/H]) by direct
comparison of spectra with interpolations in the archive. The new version
of the TGMET program, still under development, will enable determinations
of the parameters from any  spectra, independently of the detailed
observational setup. It will be presented in a future paper.
spectra, independently of the detailed
observational setup. It will be presented in a future paper.
The archive will also be used to synthesize extragalactic stellar populations and to use these high resolution synthetic spectra as kinematical templates to determine simultaneously the parameters of the stellar population and the line-of-sight velocity distribution.
The archive itself will be completed with new observations and spectra from the OHP archive with the goal of improving the mapping of the parameter space and the quality of the photometric calibration.
Acknowledgements
We thank the director and technical staff of Observatoire de Haute-Provence for their constant support of our observing programs and for providing some spectra retrieved from the ELODIE archive. We thank all the observers who provided their observations to complete the database, especially the COROT team: D. Ballereau, J.-C. Bouret, C. Catala, T. Hua, D. Katz, F. Lignieres, T. Lueftinger and C. Van't Veer. We acknowlegde, with gratitude, financial support from the GDR Galaxies, CNRS, France. This work made extensive use of the SIMBAD and VIZIER databases, operated at CDS, Strasbourg, France.