A&A 369, 16-25 (2001)
DOI: 10.1051/0004-6361:20010093
D. Clowe 1,2 - N. Trentham 3 -
J. Tonry![]() 4
4
1 - Max-Planck-Institut für Astrophysik, Karl Schwarzschild Str. 1, 85740 Garching, Germany
2 -
Currently at: Institut für Astrophysik und
Extraterrestrische
Forschung, Universität Bonn, Auf dem Hügel 71,
53121 Bonn, Germany
3 -
Institute of Astronomy,
University of Cambridge, Madingley Road, Cambridge CB3 0HA, UK
4 - Institute for Astronomy, University of Hawaii, 2680
Woodlawn Drive, Honolulu, HI 96822, USA
Received 18 January 2000 / Accepted 9 January 2001
Abstract
We investigate the possible existence of a high-redshift (z=1)
cluster of galaxies associated with the QSO lens system MG 2016+112.
From an ultra-deep R- and less deep V- and I-band Keck images
and a K-band mosaic from UKIRT, we detect ten
galaxies with colors consistent with the lensing galaxy within
225h-1 kpc of the z=1.01 lensing galaxy. This represents an
overdensity of more than ten times the number density of galaxies with
similar colors in the rest of the image. We also find a group of
seven much fainter objects closely packed in a group only 27h-1 kpc
north-west of the lensing galaxy. We perform a weak
lensing analysis on faint galaxies in the R-band image and detect a
mass peak of a size similar to the mass inferred from X-ray
observations of the field, but located 64
![]() northwest of the lensing galaxy. From the weak lensing data we rule
out a similar sized mass peak centered on the lensing galaxy at the
northwest of the lensing galaxy. From the weak lensing data we rule
out a similar sized mass peak centered on the lensing galaxy at the
![]() level.
level.
Key words: galaxies: clusters: individual: MG 2016+112 - galaxies: clusters: individual: AX J2019+112 - dark matter - gravitational lensing
The QSO lens MG 2016+112 is a long-standing enigma. Spanning a few arcseconds in size, the system contains two QSO images (designated as components A and B, see Fig. 4) and an extended structure (designated C), all at redshift z=3.273 (Lawrence et al. 1984; Schneider et al. 1985, 1986). The extended structure appears as an arc in the infrared (Langston et al. 1991; Lawrence et al. 1993; Benitez et al. 2000, hereafter B99), but consists of four subcomponents in the radio, elongated along the arc (Garrett et al. 1996). Roughly in the middle of the lens structure is a giant elliptical galaxy at redshift z=1.01(designated D, Schneider et al. 1985), and another galaxy of unknown redshift lies just outside the giant arc. Various lensing models have been applied to this system involving a single elliptical galaxy as lens, a giant elliptical galaxy plus a cluster core lens, a giant elliptical plus companion galaxy lens, and a double lens model involving two galaxies at different redshift each lensing parts of the system (Narasimha & Chitre 1989; Langston et al. 1991; Nair & Garrett 1997; B99), but no model has successfully reproduced all of the observed structures, positions, and brightness ratios of the system.
An observation with the ASCA satellite revealed a strong X-ray source,
designated AX J2019+112,
towards MG 2016+112 with an emission line at 3.5 keV which could correspond
to FeXXV at z=0.92 or FeXXVI at z=1.00, the redshift of the
lensing galaxy (Hattori et al. 1997, hereafter H97). The
X-ray spectra results in
an 8.6 keV gas temperature for a z=1.0 source, implying a massive
cluster (
![]() at
r = 250 h-1kpc) at the redshift of the lens.
Infrared and optical observations of the field (Lawrence et al. 1993; Langston et al. 1991;
Schneider et al. 1985) revealed no
excess of galaxies around the giant elliptical lens, the supposed
brightest cluster galaxy (BCG), as would normally be found in a cluster.
This led to the suggestion of a "dark cluster'' associated with the
lens, in which a cluster-sized dark matter and hot gas overdensity
exists with few optically bright galaxies (
at
r = 250 h-1kpc) at the redshift of the lens.
Infrared and optical observations of the field (Lawrence et al. 1993; Langston et al. 1991;
Schneider et al. 1985) revealed no
excess of galaxies around the giant elliptical lens, the supposed
brightest cluster galaxy (BCG), as would normally be found in a cluster.
This led to the suggestion of a "dark cluster'' associated with the
lens, in which a cluster-sized dark matter and hot gas overdensity
exists with few optically bright galaxies (
![]() ). These observations were
even more puzzling as the observed iron line in the X-ray spectra
indicates a near-solar metalicity for the cluster, which implies a
long history of star formation in the region (H97).
A handful of galaxies at z=1.01 have been found spectroscopically
within a few arcminutes of the lens (Soucail et al. 2001),
but these are not concentrated strongly around the lens.
). These observations were
even more puzzling as the observed iron line in the X-ray spectra
indicates a near-solar metalicity for the cluster, which implies a
long history of star formation in the region (H97).
A handful of galaxies at z=1.01 have been found spectroscopically
within a few arcminutes of the lens (Soucail et al. 2001),
but these are not concentrated strongly around the lens.
Recently, B99 have found an overdensity of
red galaxies using deep V, I, and ![]() imaging in a region 200
kpc (
imaging in a region 200
kpc (![]() 47
47
![]() )
in radius around the QSO lens. Assuming that
the galaxies they identified were the most luminous galaxies in a
Schechter cluster luminosity function, they calculated that the total
cluster luminosity was roughly ten times that of the BCG. Thus the
proposed cluster has a mass-to-light ratio of only a few hundred
solar, typical of what is seen in other massive high-redshift clusters
(Luppino & Kaiser 1997; Clowe et al. 1998). The
observed galaxies are red in both V-I and
)
in radius around the QSO lens. Assuming that
the galaxies they identified were the most luminous galaxies in a
Schechter cluster luminosity function, they calculated that the total
cluster luminosity was roughly ten times that of the BCG. Thus the
proposed cluster has a mass-to-light ratio of only a few hundred
solar, typical of what is seen in other massive high-redshift clusters
(Luppino & Kaiser 1997; Clowe et al. 1998). The
observed galaxies are red in both V-I and
![]() ,
suggesting a old
stellar population
and consistent with what is observed in other high-redshift clusters
(Trentham & Mobasher 1998; van Dokkum et al. 1999).
These observations, however, are based on only nine
galaxies selected by two colors and confirmed by a third.
,
suggesting a old
stellar population
and consistent with what is observed in other high-redshift clusters
(Trentham & Mobasher 1998; van Dokkum et al. 1999).
These observations, however, are based on only nine
galaxies selected by two colors and confirmed by a third.
In this paper we present deep optical and infrared images in V, R, I, and K of the MG 2016+112 field with the goals of testing the B99 selected galaxies with additional colors, detecting any additional, fainter cluster galaxies, and measuring the weak lensing signal in the field to confirm the presence and measure the mass of any cluster. In Sect. 2 we discuss the images taken and the image reduction process. We discuss the colors and magnitudes we measure for the proposed cluster galaxies of B99 as well as others in the field in Sect. 3. Section 4 contains a weak lensing analysis of the field. We summarize and discuss our major conclusions in Sect. 5.
Throughout this paper, unless stated otherwise, we assume
![]() ,
,
![]() ,
and H0 = 100 kms-1 Mpc.
,
and H0 = 100 kms-1 Mpc.
Deep I, R, and V-band imaging was performed on a field centered
on MG 2016+112 using LRIS (Oke et al. 1995) in direct imaging mode at
the Keck II
telescope on the nights of 1998 July 22-23. The resulting images
cover a 6![]()
![]() 7
7
![]() 5 area in I and V and 7
5 area in I and V and 7
![]() 5
5![]() 7
7
![]() 5 area in R with 0
5 area in R with 0
![]() 215 pixels. The total
integration times are 1500s in I and V and 5400s in R, with
seeing of 0
215 pixels. The total
integration times are 1500s in I and V and 5400s in R, with
seeing of 0
![]() 50, 0
50, 0
![]() 56, and 0
56, and 0
![]() 54 FWHM in I, R, and
V respectively.
54 FWHM in I, R, and
V respectively.
The individual images in each filter were de-biased using the overscan
strip and flattened with dome flats. The I-band images were then
re-flattened with a medianed night-sky flat from a (relatively) empty
piece of sky taken during the same nights to remove fringing.
The images were then remapped with a bi-cubic polynomial to correct
for focal plane curvature. The polynomial for the mapping
was determined by requiring that the positions of the stars in each
remapped frame were consistent to within 0.1 pixels (![]()
![]() ,
the estimated rms error in the centroiding algorithm) rms with
each other and within the errors of the positions of the stars in a
Digital Sky Survey image and a catalog of stellar positions from the
United States Naval Observatory. The mappings were
then checked using a second group of stars which were not used to
generate the polynomial. The re-mapping was performed using linear
interpolation and a triangle method to distribute the original pixel
values onto the new map. The method preserved surface brightness and
has been tested to ensure that in the case of a fractional pixel shift
with no change in the shape or size of the pixel that the second
moments of the objects in the image are not shifted in a systematic
manner (although there is some noise added).
,
the estimated rms error in the centroiding algorithm) rms with
each other and within the errors of the positions of the stars in a
Digital Sky Survey image and a catalog of stellar positions from the
United States Naval Observatory. The mappings were
then checked using a second group of stars which were not used to
generate the polynomial. The re-mapping was performed using linear
interpolation and a triangle method to distribute the original pixel
values onto the new map. The method preserved surface brightness and
has been tested to ensure that in the case of a fractional pixel shift
with no change in the shape or size of the pixel that the second
moments of the objects in the image are not shifted in a systematic
manner (although there is some noise added).
The re-mapped images then had their sky subtracted by fitting a low
order polynomial to the minima in the image. A final image was
produced by averaging the sky-subtracted images with a sigma-clipping
algorithm to remove cosmic rays. Photometry was determined by
comparing the magnitudes of the bright but unsaturated stars with
those in images of the field from the UH88
![]() telescope
and Isaac Newton telescope which were calibrated from Landolt
standards (Landolt 1992).
We assume a Galactic extinction
telescope
and Isaac Newton telescope which were calibrated from Landolt
standards (Landolt 1992).
We assume a Galactic extinction
![]() (Schlegel et al. 1998) and
derive
(Schlegel et al. 1998) and
derive
![]() ,
,
![]() ,
,
![]() ,
and
,
and
![]() ,
using the color conversions of Cardelli et al. (1989).
The 5
,
using the color conversions of Cardelli et al. (1989).
The 5![]() limiting magnitudes within a square 1
limiting magnitudes within a square 1
![]() 0 aperture are
I=25.1, R=27.1, and V=27.1.
0 aperture are
I=25.1, R=27.1, and V=27.1.
We also obtained deep K-band images using IRCAM3 at UKIRT on 1998 July
19-20.
Each image is 1
![]() 5 on a side with 0
5 on a side with 0
![]() 286 pixels.
A 2
286 pixels.
A 2![]() 2 mosaic of pointings resulted in a
3
2 mosaic of pointings resulted in a
3![]()
![]() 3
3![]() field with 9720s exposure time in each
quadrant and an additional 3240s exposure time in the central 1
field with 9720s exposure time in each
quadrant and an additional 3240s exposure time in the central 1
![]() 5
5![]() 1
1
![]() 5.
Individual exposures were 120s long and dithered by 8
5.
Individual exposures were 120s long and dithered by 8
![]() 0.
The median seeing was about 0
0.
The median seeing was about 0
![]() 8.
Flat-field images were constructed using median-filtered dithered
object frames from the whole night and sky images were constructed using
sets of twenty-six 120s exposures.
The individual frames were then
flat-fielded, sky-subtracted and combined using a clipping algorithm that
rejected bad pixels.
Instrumental magnitudes were computed from observations of UKIRT faint
standards (Casali & Hawarden 1992), giving a photometric
accuracy in the zero-point of better than 2%.
The 5
8.
Flat-field images were constructed using median-filtered dithered
object frames from the whole night and sky images were constructed using
sets of twenty-six 120s exposures.
The individual frames were then
flat-fielded, sky-subtracted and combined using a clipping algorithm that
rejected bad pixels.
Instrumental magnitudes were computed from observations of UKIRT faint
standards (Casali & Hawarden 1992), giving a photometric
accuracy in the zero-point of better than 2%.
The 5![]() limiting magnitude within a 1
limiting magnitude within a 1
![]() 0 square aperture
in the reduced image is K=21.3.
0 square aperture
in the reduced image is K=21.3.
The IMCAT (http://www.ifa.hawaii.edu/~kaiser/imcat) hfindpeaks detection algorithm was used to search for objects in the above VRIK images. The objects were each inspected by eye in all images and spurious detections (due to stellar diffraction peaks, for example) were eliminated from the catalog of objects. Objects were identified as stars or galaxies on the basis of this inspection as well as using the measured half-light radii and central surface brightnesses compared to the total (large-aperture) magnitudes of the objects. Those objects which were classified as galaxies had their magnitudes remeasured using the IRAF apphot package, following a local sky subtraction. Uncertainties in these numbers are substantial at the faint end and come from uncertainties in the local sky due to scattered starlight, faint galaxy clustering, and Poisson noise. For example, objects at R>24 typically have uncertainties of at least 0.5 mag in each color, measured by using apertures of various sizes and radii around the objects to determine the local sky value.
Figure 1 shows the galaxy number counts as a function of
magnitude for this field in each filter.
There is no obvious excess of galaxies above the background, as was seen
in the rich cluster MS 1054-03 at z=0.83 (Trentham & Mobasher
1998), but the background uncertainty
on these small scales is large. Thus, the background
counts might be anomalously low, and a cluster at z=1 may still exist
despite the lack of an excess. The most straightforward way to
look for
such a cluster is to (i) look for dense groups of galaxies very close
to the lensing galaxy D, and (ii)
inspect color-color and color-magnitude diagrams.
These are presented in Figs. 2 and 3.
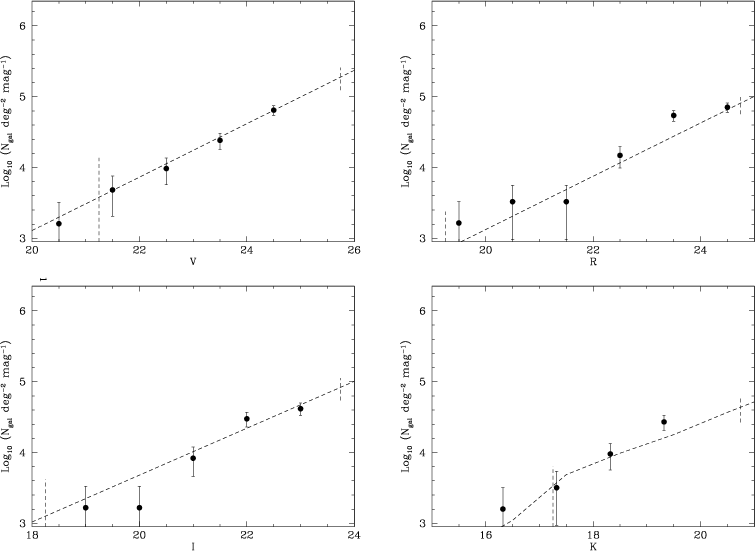 |
Figure 1: Galaxy counts as a function of magnitude in the four observed passbands. All magnitudes are aperture magnitudes measured in an aperture of diameter 3.0 arcsec, which are close to total magnitudes except for very bright galaxies, where we apply a small aperture correction to the measured magnitudes so that they approximate total magnitudes (which only happened for one foreground galaxy). The filled circles are the counts within r=225 kpc radius from the QSO lens. The dashed lines represent typical mean background counts (Mobasher & Trentham 1998; Wilson et al. 1997). Approximate uncertainties in these lines are shown by the vertical dashed lines at two representative magnitudes (Mobasher & Trentham 1998; Trentham 1997) |
| Open with DEXTER | |
We identified one group of seven faint objects all between 19 and
27 kpc from galaxy D in the R-band image. The brightest of these is
![]() and the rest around
and the rest around
![]() and
all, except the brightest, were too faint to be detected in
the other filters. The brightest has R-I and I-K colors of
1.57 and 2.81, which are somewhat bluer than those
of galaxy D (1.81 and 3.83). From the colors it is unlikely that these
would be the brightest galaxies in a higher redshift cluster. From
the observed number density of 24<R<26 galaxies in this field, the
chances of projecting seven unrelated galaxies in such a small
area is only 0.14%. However, with the exception of the brightest
object, which is spatially extended and therefore, probably, a galaxy,
we cannot determine if the objects are stars or galaxies.
Two other objects also around
and
all, except the brightest, were too faint to be detected in
the other filters. The brightest has R-I and I-K colors of
1.57 and 2.81, which are somewhat bluer than those
of galaxy D (1.81 and 3.83). From the colors it is unlikely that these
would be the brightest galaxies in a higher redshift cluster. From
the observed number density of 24<R<26 galaxies in this field, the
chances of projecting seven unrelated galaxies in such a small
area is only 0.14%. However, with the exception of the brightest
object, which is spatially extended and therefore, probably, a galaxy,
we cannot determine if the objects are stars or galaxies.
Two other objects also around
![]() are located
on the eastern side of galaxy D at roughly the same distance.
Even assuming that these objects are galaxies and associated with
galaxy D, the proposed 8 keV cluster with galaxy D as the brightest
cluster galaxy would still have a low surface density of cluster
galaxies near the BCG as compared to high-redshift clusters of similar
mass (both MS 1137+66 and RX J1716+67,
are located
on the eastern side of galaxy D at roughly the same distance.
Even assuming that these objects are galaxies and associated with
galaxy D, the proposed 8 keV cluster with galaxy D as the brightest
cluster galaxy would still have a low surface density of cluster
galaxies near the BCG as compared to high-redshift clusters of similar
mass (both MS 1137+66 and RX J1716+67, ![]() 6 keV
clusters at
6 keV
clusters at ![]() ,
have roughly twice as many galaxies within
30 kpc of the BCG). We note, however, that as MG 2016+112 was
originally discovered as a medium-separation QSO lens, that this
deficiency of bright cluster galaxies near the BCG may be a selection
effect as a large number of massive galaxies would perturb the lensing
caustics sufficiently to preclude a double image of the QSO from
lensing by the BCG.
,
have roughly twice as many galaxies within
30 kpc of the BCG). We note, however, that as MG 2016+112 was
originally discovered as a medium-separation QSO lens, that this
deficiency of bright cluster galaxies near the BCG may be a selection
effect as a large number of massive galaxies would perturb the lensing
caustics sufficiently to preclude a double image of the QSO from
lensing by the BCG.
From Figs. 2 and 3, one can find a number of red galaxies
having approximately the correct I-K to be old stellar
populations at z=1 (Kodama et al. 1998) within 225h-1 kpc of
galaxy D. Of these, eight are the red objects described
by B99, including galaxy D, and three are not found
in the B99 sample. One of the B99 objects, the eighth in
their Table 1, we identified as a star. Our revised count of the
total number of candidate members from color selection is thus eleven.
There are only fifteen galaxies in the image outside the selected
region with colors and magnitudes similar to the selected galaxies.
This gives an overdensity around galaxy D of
1160+440-260% compared to the rest of the image, and the probability this
is due to Poissonian fluctuations in the density is
3 10-12.
If cluster members, as argued by B99, these are
presumably responsible for generating the metals seen at X-ray
wavelengths by H97. Spectroscopic redshifts
would be needed to confirm this interpretation.
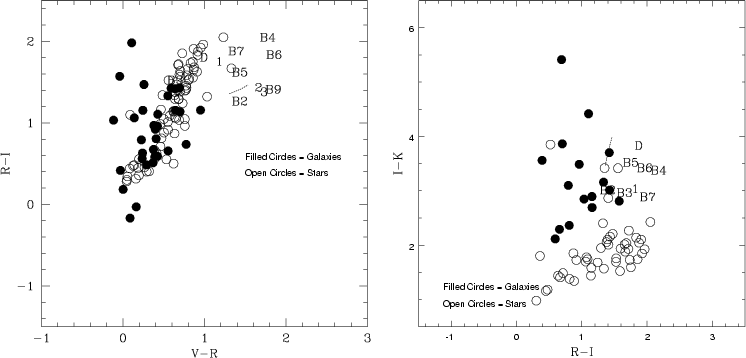 |
Figure 2:
Color-color diagrams for all objects with K<20 for the
RIK plot and R<24 for the VRI plot
which are less than 225 kpc from the QSO lens. Symbol D
represents the positions for the four components of the lens galaxy.
The symbols B# represent the positions of the red galaxies in Table 1
of B99 where # is the line number of the object in
the table. The first object in their list is the same as object D.
The eighth and ninth objects were not detected in our K-band image
and the eighth object is believed to be a star from inspection of the
optical bands. The symbols 1 through 3 represent new
candidate red galaxies (2 and 3 were not detected in our
K-band image either). The dashed line is where one
expects passively evolving elliptical galaxies at z=1 to reside,
given the stellar population models of Kodama et al. (1998).
Typical 1 |
| Open with DEXTER | |
We note, however, that these galaxies are up to a magnitude redder in R-I than would be predicted for passively-evolving ellipticals. This is probably due in part to photometric uncertainties, but could also be due to small amounts of internal extinction. Note that at z=1 the R-I color of a pure old stellar population is anomalously red since at this redshift the 4000 Å break falls exactly between these two passbands, which in turn means that this color is particularly susceptible to being made significantly different by internal extinction. In addition, galaxies bluer than the ones discussed by B99 could in principle also be members that are undergoing current star formation. Again, spectroscopic information will be useful to investigate these possibilities further.
 |
Figure 3:
The V-I vs. I color-magnitude diagram of all objects
less than 225 kpc from the QSO lens.
The symbols have the same meaning as in Fig. 2.
The dashed line is where one would
expect passively evolving elliptical galaxies at z=1 to reside, given the
stellar population models of Kodama et al. (1998). Typical
1 |
| Open with DEXTER | |
Prior to using a detection algorithm on the image, we first subtracted
small-scale background fluctuations in the image, caused primarily by
stellar halos and scattered star light. These fluctuations were
determined by smoothing an image of the local minima of the sky
values with a 5
![]() Gaussian, and dividing by an image smoothed
on the same scale which contained the mask of the pixels detected as
minima. In addition to removing any sky variations,
this routine typically removed extended wings of bright stars
in the image as well as any large, low surface brightness objects which
might have been present. Performing this step was necessary as the
detection algorithm can get confused by rapid changes in the
sky background.
Gaussian, and dividing by an image smoothed
on the same scale which contained the mask of the pixels detected as
minima. In addition to removing any sky variations,
this routine typically removed extended wings of bright stars
in the image as well as any large, low surface brightness objects which
might have been present. Performing this step was necessary as the
detection algorithm can get confused by rapid changes in the
sky background.
To detect the faint galaxies we used a hierarchical peak-finding
algorithm which provided a position, luminosity, and size estimate for
each object (Kaiser et al. 1995, hereafter KSB).
Local sky levels around each object, and the gradient of the sky levels
across the object, were calculated after excluding all pixels within
three detection radii of an object in the catalog. The luminosity was
measured using a circular aperture equal to three times the smoothing
radius at which the object achieved maximum significance. I and Vmagnitudes were measured using the same sky-subtraction technique and
the same aperture radius. Noise peaks and merged objects were removed
from the catalog by requiring a minimum signal-to-noise at maximum detection
significance of 10, rejecting abnormally large and small objects,
rejecting objects with extremely high ellipticities, and by visual
inspection. Objects with unusually high sky background levels were removed
to exclude objects in stellar psf haloes for which the bi-linear fit used in
subtracting the sky would not be a good model for the changes in the sky
level across the object.
The ellipticities of each object were measured using optical
polarizations
![]() formed from the quadrupole moments
formed from the quadrupole moments
![]() where f is the flux density and
where f is the flux density and
![]() is a Gaussian weighting function of a scale equal to the
smoothing radius at which the object was detected with maximum
significance (KSB).
is a Gaussian weighting function of a scale equal to the
smoothing radius at which the object was detected with maximum
significance (KSB).
The next step in the lensing analysis was to remove the PSF
anisotropies and smearing. Due to the large number of stars in the
field (the final sample was 675 bright, unsaturated stars with no
neighbors within 10
![]() ),
we were able to fit the stellar ellipticities across
the field with an arbitrarily high-order two-dimensional polynomial. We
used third, fifth, and seventh order polynomials for the fits, and
subtracted the fit values from all detected objects via the method in
KSB. We then applied the boost factor discussed below to the stellar
ellipticities, and used the boosted ellipticities to measure
any false signal which will be induced in the data by the residual PSF
anisotropies. As can be seen in Fig. 5, there is a small positive
signal in the center of the fields; however the magnitude of this
signal is small compared to the noise caused by the intrinsic
ellipticity distribution of the background galaxies, and thus should
not significantly affect any observed lensing signal. The amplitude
of the false residual signal decreases somewhat with the increasing order of
the polynomial fit to the ellipticities, as can be seen in Fig. 5,
and thus we used the bi-septic polynomial fit to correct the
ellipticities of the galaxies. This correction was done by
subtracting the value of the fit at the position of each galaxy from
the measured ellipticity, after scaling the fit value by
),
we were able to fit the stellar ellipticities across
the field with an arbitrarily high-order two-dimensional polynomial. We
used third, fifth, and seventh order polynomials for the fits, and
subtracted the fit values from all detected objects via the method in
KSB. We then applied the boost factor discussed below to the stellar
ellipticities, and used the boosted ellipticities to measure
any false signal which will be induced in the data by the residual PSF
anisotropies. As can be seen in Fig. 5, there is a small positive
signal in the center of the fields; however the magnitude of this
signal is small compared to the noise caused by the intrinsic
ellipticity distribution of the background galaxies, and thus should
not significantly affect any observed lensing signal. The amplitude
of the false residual signal decreases somewhat with the increasing order of
the polynomial fit to the ellipticities, as can be seen in Fig. 5,
and thus we used the bi-septic polynomial fit to correct the
ellipticities of the galaxies. This correction was done by
subtracting the value of the fit at the position of each galaxy from
the measured ellipticity, after scaling the fit value by
![]() .
As defined in KSB (corrections in Hoekstra
et al. 1998),
.
As defined in KSB (corrections in Hoekstra
et al. 1998),
![]() is a quasi-tensor which describes
how the ellipticity
of an object changes under an applied anisotropy and the asterisk
denotes the typical value for a star in the image.
is a quasi-tensor which describes
how the ellipticity
of an object changes under an applied anisotropy and the asterisk
denotes the typical value for a star in the image.
To correct for the reduction of the ellipticities from circular smearing by the
PSF, we calculated a boost factor for each galaxy
![]() (Luppino &
Kaiser 1997), where
(Luppino &
Kaiser 1997), where
![]() is a quasi-tensor describing how the
ellipticity of an object changes with an applied shear (KSB), and
is a quasi-tensor describing how the
ellipticity of an object changes with an applied shear (KSB), and
![]() and the asterisk are defined as above.
Due to the large anisotropy in the
stars at the edges of the Keck field, we computed
and the asterisk are defined as above.
Due to the large anisotropy in the
stars at the edges of the Keck field, we computed
![]() and
and
![]() only in the central region with a diameter of one
thousand pixels, in which there
was no significant anisotropy. As the individual values of
only in the central region with a diameter of one
thousand pixels, in which there
was no significant anisotropy. As the individual values of ![]() are quite noisy for faint galaxies, we fit
are quite noisy for faint galaxies, we fit ![]() with a third
order polynomial as a function of
size and ellipticity. Because of noise and a tendency of the
sky-subtraction algorithm to measure slightly too large a sky value
(owing to the presence of many faint, unresolved objects), very faint
galaxies tend to have artificially low, sometimes even negative,
with a third
order polynomial as a function of
size and ellipticity. Because of noise and a tendency of the
sky-subtraction algorithm to measure slightly too large a sky value
(owing to the presence of many faint, unresolved objects), very faint
galaxies tend to have artificially low, sometimes even negative,
![]() values. We corrected for this by applying a cut to the
fitted
values. We corrected for this by applying a cut to the
fitted ![]() values such that any object with a detected size
smaller than that of the stars in the field was assigned a
values such that any object with a detected size
smaller than that of the stars in the field was assigned a ![]() equal to that of galaxies with detected sizes similar to that of
stars, 0.2 in this case. We choose to apply this correction instead
of removing the objects from the catalog as the faintest galaxies
should be at the highest mean redshift, and therefore show the
greatest amount of gravitational shearing. This artificial cutoff in
equal to that of galaxies with detected sizes similar to that of
stars, 0.2 in this case. We choose to apply this correction instead
of removing the objects from the catalog as the faintest galaxies
should be at the highest mean redshift, and therefore show the
greatest amount of gravitational shearing. This artificial cutoff in
![]() is equivalent to applying a weight function in all subsequent
operations such that the galaxies with measured sizes smaller than
stellar are given a lower weight.
is equivalent to applying a weight function in all subsequent
operations such that the galaxies with measured sizes smaller than
stellar are given a lower weight.
We then created an estimate of the shear for each galaxy
![]() .
Both the shear
.
Both the shear ![]() and convergence
and convergence ![]() are second derivatives of the surface potential,
are second derivatives of the surface potential,
![]() and
and
![]() where
where
![]() .
Thus, one can
create a two dimensional map of the convergence by Fourier transforming
shear estimates, multiplying by the appropriate conversion factors,
and retransforming (Kaiser & Squires 1993). The surface
density can then be
extracted from the convergence, providing one knows both the redshift
of the lens and the redshift distribution of the background
galaxies. The intrinsic ellipticities of the galaxies cannot be
removed from the shear estimate, and are the dominant source of noise
in the analysis.
.
Thus, one can
create a two dimensional map of the convergence by Fourier transforming
shear estimates, multiplying by the appropriate conversion factors,
and retransforming (Kaiser & Squires 1993). The surface
density can then be
extracted from the convergence, providing one knows both the redshift
of the lens and the redshift distribution of the background
galaxies. The intrinsic ellipticities of the galaxies cannot be
removed from the shear estimate, and are the dominant source of noise
in the analysis.
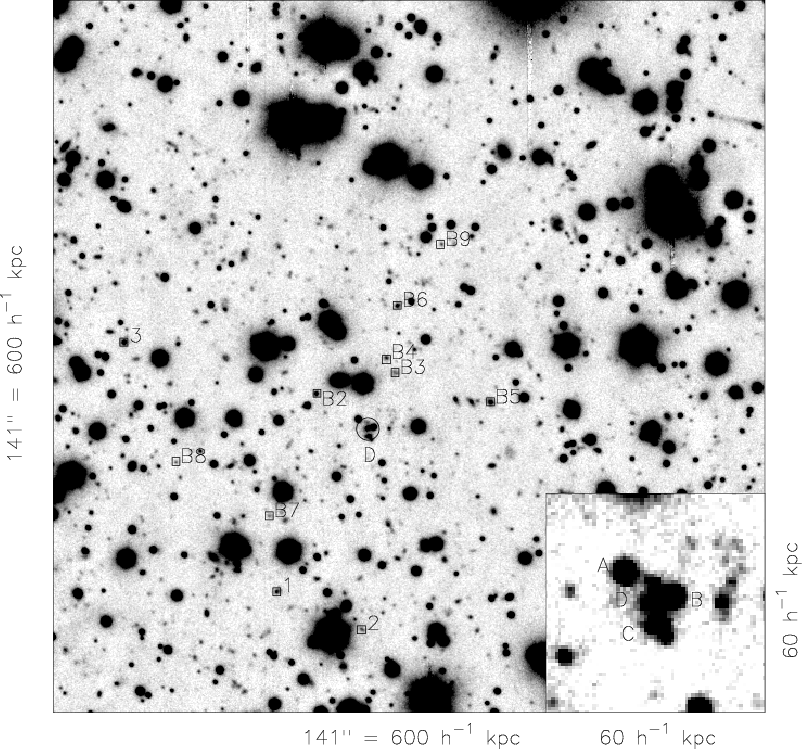 |
Figure 4:
The central 600h-1 kpc (141
|
| Open with DEXTER | |
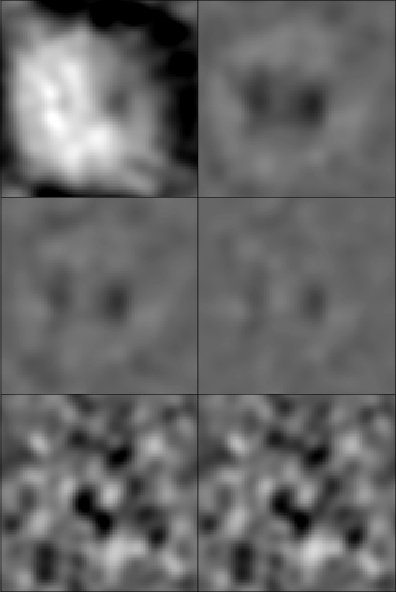 |
Figure 5:
|
| Open with DEXTER | |
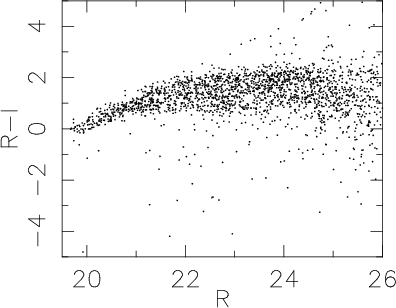 |
Figure 6: R-I vs. R color-magnitude diagram of all objects detected with a half-light radius the same as the bright stars. For R<24, this will be almost entirely stars while for R>24 small galaxies will be included in the objects |
| Open with DEXTER | |
| |
Figure 7:
The weak lensing |
| Open with DEXTER | |
The weak lensing mass reconstruction from the background galaxy
catalog is shown in Fig. 7. This was created using the KS93
algorithm (Kaiser & Squires 1993), which uses the Fourier transform
method described earlier to convert shear to convergence.
This algorithm can only determine ![]() to an
unknown additive constant and suffers from biasing at the edges of the
frame, but the intrinsic ellipticity distribution of the galaxies is
translated into white noise across the field.
to an
unknown additive constant and suffers from biasing at the edges of the
frame, but the intrinsic ellipticity distribution of the galaxies is
translated into white noise across the field.
As can be seen in Fig. 7, we do detect an overdensity of mass in the
field, although its center is 60
![]() north and 24
north and 24
![]() east of
the position of the QSO lens (hereafter referred to as MP1).
The rest of the peaks seen in the
reconstruction are at the level of the expected noise due to the low number
density of background galaxies. One way to check that
the peak is real and not caused by a small number of high ellipticity
galaxies is to randomly divide the background galaxy catalog in two
and see if the peak is present in both of the sub-catalogs. We did
this ten times, and in all twenty sub-catalogs we detect the mass peak
albeit with changes in the shape, position, and amplitude as expected
by the increased noise in the reconstruction due to the lower
background galaxy number density. The other peaks in the field tended
to vary in amplitude and often disappear in the sub-catalog
reconstructions, which suggests that they are caused primarily by a
handful of galaxies and not a real lensing signal.
east of
the position of the QSO lens (hereafter referred to as MP1).
The rest of the peaks seen in the
reconstruction are at the level of the expected noise due to the low number
density of background galaxies. One way to check that
the peak is real and not caused by a small number of high ellipticity
galaxies is to randomly divide the background galaxy catalog in two
and see if the peak is present in both of the sub-catalogs. We did
this ten times, and in all twenty sub-catalogs we detect the mass peak
albeit with changes in the shape, position, and amplitude as expected
by the increased noise in the reconstruction due to the lower
background galaxy number density. The other peaks in the field tended
to vary in amplitude and often disappear in the sub-catalog
reconstructions, which suggests that they are caused primarily by a
handful of galaxies and not a real lensing signal.
We also performed
a lensing analysis using an image made from both the R and Vimages added together. This allowed us to detect ![]() 20% more
galaxies using the same signal-to-noise, R mag, and R-Icolor cuts as given above. The lensing reconstruction for this is
also shown in Fig. 7. The extra galaxies and change in the
noise properties of the original galaxies results in only a small
change in the amplitude of MP1,
but a much larger change in the smaller, presumably noise, peaks.
We also attempted the same using R and I, and V, R, and Iimages added together, but the higher sky noise in the I frames
resulted in a severe decrease in the number of faint galaxies
detected. For the rest of the results we will quote the numbers taken
from just the R image, but all of the results from the R+V image
agree within errors to those of the R image.
20% more
galaxies using the same signal-to-noise, R mag, and R-Icolor cuts as given above. The lensing reconstruction for this is
also shown in Fig. 7. The extra galaxies and change in the
noise properties of the original galaxies results in only a small
change in the amplitude of MP1,
but a much larger change in the smaller, presumably noise, peaks.
We also attempted the same using R and I, and V, R, and Iimages added together, but the higher sky noise in the I frames
resulted in a severe decrease in the number of faint galaxies
detected. For the rest of the results we will quote the numbers taken
from just the R image, but all of the results from the R+V image
agree within errors to those of the R image.
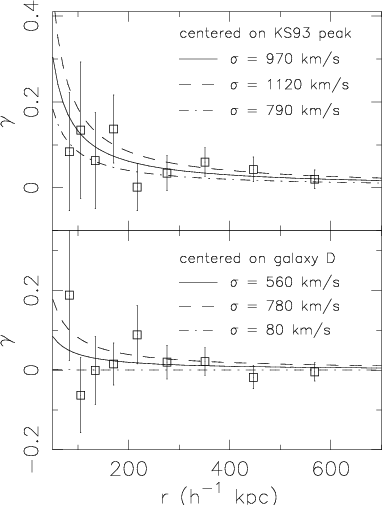 |
Figure 8:
The radial shear profiles centered on the peak of the KS93
|
| Open with DEXTER | |
To better quantify the strength and significance of the observed
overdensity, as well as to detect any low-significance signal at the
position of the QSO lens, we computed the azimuthally-averaged
tangential shear of the background galaxies as a function of
radius from a given position. We can then fit these radial shear
profiles with various models and measure the
![]() between
the best fit model and a zero shear model to determine the
significance of the peaks. The radial shear profiles centered on the
peak seen in the mass reconstruction and on the QSO lens are given in
Fig. 8, as well as the best fit isothermal sphere models. For
these models we assumed a lens redshift of 1 and background galaxy
redshift of 1.5. The
between
the best fit model and a zero shear model to determine the
significance of the peaks. The radial shear profiles centered on the
peak seen in the mass reconstruction and on the QSO lens are given in
Fig. 8, as well as the best fit isothermal sphere models. For
these models we assumed a lens redshift of 1 and background galaxy
redshift of 1.5. The
![]() assumption was derived by
calculating
assumption was derived by
calculating
 |
(1) |
The best fit isothermal sphere model for MP1 has
![]() kms-1,
kms-1,
![]() ,
and
,
and
![]() (0 kms-1 - 970 kms
-1) = 8.95, and thus is at nearly 3
(0 kms-1 - 970 kms
-1) = 8.95, and thus is at nearly 3![]() significance. The
highest significance in the field using this statistic occurs 5
significance. The
highest significance in the field using this statistic occurs 5
![]() 6 east and 14
6 east and 14
![]() 2 north of MP1 (18
2 north of MP1 (18
![]() 3 west and
71
3 west and
71
![]() 6 north of the QSO lens), with
6 north of the QSO lens), with ![]() 1040 kms-1,
1040 kms-1,
![]() ,
and
,
and
![]() (0 kms
-1- 1040 kms
-1) = 9.23.
The difference between the maxima in the two techniques is a result of
the KS93 reconstruction using all of the galaxies in the frame while
the tangential shear uses only those between 17
(0 kms
-1- 1040 kms
-1) = 9.23.
The difference between the maxima in the two techniques is a result of
the KS93 reconstruction using all of the galaxies in the frame while
the tangential shear uses only those between 17
![]() 2 and 150
2 and 150
![]() 5 from the central position, and that the contributions from the
galaxies are weighted in different manners. The best
fit isothermal sphere model when the shear profile is centered on the
QSO lens has
5 from the central position, and that the contributions from the
galaxies are weighted in different manners. The best
fit isothermal sphere model when the shear profile is centered on the
QSO lens has
![]() kms-1,
kms-1,
![]() ,
and
,
and
![]() (0 kms
-1 - 560 kms
-1) = 1.05, and therefore has only
(0 kms
-1 - 560 kms
-1) = 1.05, and therefore has only
![]() significance. The best fit velocity dispersion, as well as
the one-
significance. The best fit velocity dispersion, as well as
the one-![]() deviations, as a function of background
galaxy redshift is given in Fig. 9.
deviations, as a function of background
galaxy redshift is given in Fig. 9.
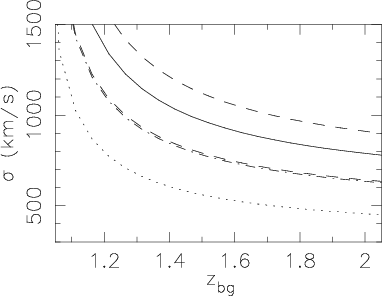 |
Figure 9:
The best fit singular isothermal sphere
velocity dispersion to the observed shear when centered on MP1
(solid line) and QSO lens (dotted line) as a function of
mean background galaxy redshift, assuming the lens is at z=1.01.
The dashed and dash-dotted lines
give the 1 |
| Open with DEXTER | |
When this technique was applied to the remaining mass peaks in common to
both the R and V+R mass reconstructions, only the peanut-shaped peak
to the far northeast turned out to be significant. This peak has a best fit
model with
![]() kms-1,
kms-1,
![]() ,
and
,
and
![]() (0 kms
-1 - 910 kms-1) = 7.75 when centered on a location between the
two peaks. Moving the center to either of the peaks did not significantly
change the best fit model. The remainder of the peaks, including the peak
located immediately south of the QSO lens, had their best fit models with
(0 kms
-1 - 910 kms-1) = 7.75 when centered on a location between the
two peaks. Moving the center to either of the peaks did not significantly
change the best fit model. The remainder of the peaks, including the peak
located immediately south of the QSO lens, had their best fit models with
![]() 's less than 1, and thus are likely the result of chance
alignments of a small number of galaxies with large ellipticities located
near the center of the peaks.
's less than 1, and thus are likely the result of chance
alignments of a small number of galaxies with large ellipticities located
near the center of the peaks.
To test the significances of the peaks given by the
![]() of the isothermal sphere fits we performed Monte Carlo simulations in
which we kept the positions and moduli of the ellipticities of the background
galaxies fixed, but applied a random spin to their orientations. We
then measured the best isothermal sphere fits to the tangential shear
profiles around MP1 using the central position from the KS93 reconstruction.
The resulting best fit isothermal sphere models were a Gaussian
distribution around
of the isothermal sphere fits we performed Monte Carlo simulations in
which we kept the positions and moduli of the ellipticities of the background
galaxies fixed, but applied a random spin to their orientations. We
then measured the best isothermal sphere fits to the tangential shear
profiles around MP1 using the central position from the KS93 reconstruction.
The resulting best fit isothermal sphere models were a Gaussian
distribution around
![]() 0 km2/s2. Only 128 of the 100000
realizations resulted in a best fit model with
0 km2/s2. Only 128 of the 100000
realizations resulted in a best fit model with
![]() 970 kms-1, which corresponds to a significance level of 3
970 kms-1, which corresponds to a significance level of 3![]() ,
in
agreement with the
,
in
agreement with the
![]() significance level. The same procedure
was used to test the significance of the peak to the extreme northeast of the
field. For this location, 4358 of the 100000 realizations resulted in a
best fit model with
significance level. The same procedure
was used to test the significance of the peak to the extreme northeast of the
field. For this location, 4358 of the 100000 realizations resulted in a
best fit model with
![]() 910 kms-1, which corresponds to a
significance level of only 1.7
910 kms-1, which corresponds to a
significance level of only 1.7![]() .
This suggests that this peak is
caused by a relatively small number of aligned galaxies with large
ellipticities.
.
This suggests that this peak is
caused by a relatively small number of aligned galaxies with large
ellipticities.
To determine the significance of not detecting a peak at the position
of the QSO lens we performed a similar process to the above. We again
kept the positions and moduli of the ellipticities of the background galaxies
fixed and randomized their orientations, but then we also applied a
shear to the background galaxies. The applied shear was calculated
for each galaxy's position by using a 1000 kms-1 isothermal sphere
centered on the QSO lens with
![]() and
and
![]() .
Only 5031 of the 100000
realizations resulted in a best fit model with
.
Only 5031 of the 100000
realizations resulted in a best fit model with
![]() 560 kms-1,
which corresponds to
560 kms-1,
which corresponds to ![]() significance.
significance.
Another method we used to check that the peaks are statistically significant
is removing the n galaxies with the highest and lowest tangential
relative to the center of the peak and recomputing the best fit isothermal
sphere and its significance. As the background galaxies are assumed to have
an isotropic initial ellipticity distribution, removing the same number of
galaxies from both the high and low ends of the distribution of one of the
ellipticity components from the sample should not significantly change the
measured shear signal obtained from averaging the ellipticities in the sample.
When this is applied to MP1, the
best fitting isothermal sphere profile does not vary by more than 60 kms-1even after removing over 30% of the galaxies in the original sample.
Further, the significance of the fit, as measured by the
![]() between the best fit and a 0 kms-1 model, undergoes only the slow decrease
one would expect as the number of galaxies used in the sample decreases.
In contrast, the peak to the far northeast changes from the best fit model
between the best fit and a 0 kms-1 model, undergoes only the slow decrease
one would expect as the number of galaxies used in the sample decreases.
In contrast, the peak to the far northeast changes from the best fit model
![]() kms-1 to
kms-1 to
![]() kms-1 after removal of the twenty
pairs of galaxies with highest and lowest ellipticities tangential to
the center of the peak. The measured significance of the peak also drops
from 2.8
kms-1 after removal of the twenty
pairs of galaxies with highest and lowest ellipticities tangential to
the center of the peak. The measured significance of the peak also drops
from 2.8![]() to 1.3
to 1.3![]() ,
demonstrating that this peak is caused
by the chance alignment of a small number of galaxies with large ellipticities.
This technique can also be used to detect if a mass peak has been hidden
by a handful of high ellipticity galaxies aligned tangentially to the peak
by finding a large increase in the best fit model as the extreme ellipticity
galaxies are removed from the sample. Doing this when centered on the QSO
lens, however, results in a small, but statistically insignificant, decrease
in the velocity of the best fit isothermal sphere model.
,
demonstrating that this peak is caused
by the chance alignment of a small number of galaxies with large ellipticities.
This technique can also be used to detect if a mass peak has been hidden
by a handful of high ellipticity galaxies aligned tangentially to the peak
by finding a large increase in the best fit model as the extreme ellipticity
galaxies are removed from the sample. Doing this when centered on the QSO
lens, however, results in a small, but statistically insignificant, decrease
in the velocity of the best fit isothermal sphere model.
Finally, as MP1 is in a position which is largely obscured by the haloes of
bright stars, we performed several simulations to ensure that the residual
haloes left after the sky subtraction could not be causing a false shear
signal. To do this, we obtained the image of a bright, isolated star from
a Keck R band image of the cluster RX J1716.6+6708 (Clowe et al. 1998)
which has a similar seeing (0
![]() 7) to the R band image used for the
lensing analysis. We took a sub-image around the star sized to include all
the area where the psf halo is distinguishable from the sky background.
We masked out all detectable objects in this sub-image, then averaged together
four versions of the sub-image when rotated about the center of the star at
0, 90, 180, and 270 degrees. This created a template for the psf wings which
we could then scale to the desired brightness to test the effect of the
stellar haloes.
7) to the R band image used for the
lensing analysis. We took a sub-image around the star sized to include all
the area where the psf halo is distinguishable from the sky background.
We masked out all detectable objects in this sub-image, then averaged together
four versions of the sub-image when rotated about the center of the star at
0, 90, 180, and 270 degrees. This created a template for the psf wings which
we could then scale to the desired brightness to test the effect of the
stellar haloes.
For the first test, we created simulations of an empty field using thin
exponential disks at random inclination angle to and orientation on the plane
of the the sky, which were then smoothed by a Gaussian psf. The template
was then added to the simulation at various positions both singly and
in groups to simulate the stellar field seen in the MG 2016 field. The same
data reduction procedure described above, including the sky fitting and
subtraction, was then performed on each simulations both with and without
the added stars, and the results were compared. In every case, provided the
simulated galaxies with sky levels significantly above average (typically
![]() above the mean sky level) were excluded from the catalogs, no
systematic difference between the simulations with bright stars and those
without bright stars were seen, although the noise level in the mass
reconstructions at the positions of the bright stars were higher due to the
loss of galaxies at those positions. We also tested this by adding in the
stellar template to the MG 2016 R band image to an area which was
relatively free of bright stars. The full data reduction procedure was
then performed on the new image, and the results compared to the catalog
of the same objects from the original reduction. In all cases the
differences between the two reconstructions were statistically insignificant.
above the mean sky level) were excluded from the catalogs, no
systematic difference between the simulations with bright stars and those
without bright stars were seen, although the noise level in the mass
reconstructions at the positions of the bright stars were higher due to the
loss of galaxies at those positions. We also tested this by adding in the
stellar template to the MG 2016 R band image to an area which was
relatively free of bright stars. The full data reduction procedure was
then performed on the new image, and the results compared to the catalog
of the same objects from the original reduction. In all cases the
differences between the two reconstructions were statistically insignificant.
We have detected in VRIK images ten galaxies with colors consistent
with the lensing galaxy of the MG 2016+112 QSO lens within
225h-1 kpc of the lensing galaxy. This represents an increase in
number density of
1160+440-260% (1![]() error on the
background density) compared to galaxies of
similar colors and magnitudes in the rest of the image. We also find
nine faint objects, seven of them grouped in a small area, within
30h-1 kpc of the lens galaxy D. Due to their faintness, we are
unable to measure colors or determine if they are galaxies or stars
except for the brightest of the nine which is a galaxy and somewhat
bluer than galaxy D. Even assuming all of these galaxies are
associated with the lens galaxy D, they would total a small fraction of the
cluster galaxies found in the clusters MS 1137+66 and
RX J1716+67, both of which are at
error on the
background density) compared to galaxies of
similar colors and magnitudes in the rest of the image. We also find
nine faint objects, seven of them grouped in a small area, within
30h-1 kpc of the lens galaxy D. Due to their faintness, we are
unable to measure colors or determine if they are galaxies or stars
except for the brightest of the nine which is a galaxy and somewhat
bluer than galaxy D. Even assuming all of these galaxies are
associated with the lens galaxy D, they would total a small fraction of the
cluster galaxies found in the clusters MS 1137+66 and
RX J1716+67, both of which are at ![]() and have similar X-ray
properties to
those measured for AX J2019+112 (Donahue et al. 2000; Henry et al.
1998; H97), using the same radial, magnitude, and color
cuts adjusted to the cluster BCGs and redshifts.
and have similar X-ray
properties to
those measured for AX J2019+112 (Donahue et al. 2000; Henry et al.
1998; H97), using the same radial, magnitude, and color
cuts adjusted to the cluster BCGs and redshifts.
We have also made a mass reconstruction of the field from faint blue
galaxies. We find a peak of comparable mass to that given by the
X-ray observations, but the center of the peak is over an arcminute
north-west of the lens galaxy D (272h-1 kpc at z=1). This peak
has a best fit singular isothermal sphere model of ![]() 970 kms-1 and is significant at
970 kms-1 and is significant at ![]() .
We can rule out a 1000 kms-1singular isothermal sphere, the mass expected from the X-ray
observations, centered on the lens galaxy D at 2.0
.
We can rule out a 1000 kms-1singular isothermal sphere, the mass expected from the X-ray
observations, centered on the lens galaxy D at 2.0![]() significance. We do not see any evidence for a group of similarly
colored galaxies in the vicinity of the observed mass peak, but this
region is highly obscured by bright stars.
We plot in Fig. 10 the velocity dispersion of a singular isothermal
sphere needed to provide the observed lensing signal as a function of
redshift of the lens.
significance. We do not see any evidence for a group of similarly
colored galaxies in the vicinity of the observed mass peak, but this
region is highly obscured by bright stars.
We plot in Fig. 10 the velocity dispersion of a singular isothermal
sphere needed to provide the observed lensing signal as a function of
redshift of the lens.
 |
Figure 10:
The best fit singular isothermal sphere
velocity dispersion to the observed shear centered on the KS93 mass
reconstruction peak as a function of lens redshift. The background
galaxies are assumed to have the same redshift distribution as those
of similar magnitude and redshift in the Fontana et al. (1999) HDF-S
photometric redshift catalog. The dashed lines give the |
| Open with DEXTER | |
Finally, we note that the 1![]() upper mass limit centered on
galaxy D from weak lensing is near the 1
upper mass limit centered on
galaxy D from weak lensing is near the 1![]() lower mass limit from the X-ray data. Thus the best measure of the
mass of the cluster from the two data sets would give a velocity
dispersion of
lower mass limit from the X-ray data. Thus the best measure of the
mass of the cluster from the two data sets would give a velocity
dispersion of
![]() 800 kms-1.
800 kms-1.
Acknowledgements
We wish to thank Genevieve Soucail, Jean-Paul Kneib, Narciso Benitez, Tom Broadhurst, and Piero Rosati for providing information and data on this field prior to publication. We also wish to thank Tadayuki Kodama and Peter Schneider for their advice and help. Some of the data presented herein were obtained at the W. M. Keck Observatory, which is operated as a scientific partnership among the California Institute of Technology, the University of California and the National Aeronautics and Space Administration. The Observatory was made possible by the generous financial support of the W. M. Keck Foundation. The UK Infrared Telescope is operated by the Joint Astronomy Centre on behalf of the U. K. Partical Physics and Astronomy Research Council. We acknowledge assistance from the Isaac Newton Group Service Programme in providing photometric zero points for the optical data, from the Isaac Newton Telescope on La Palma. DC acknowledges the "Sonderforschungsbereich 375-95 für Astro-Teilchenphysik" der Deutschen Forschungsgemeinschaft for finacial support. NT acknowldedges the PPARC for financial support. This work was supported by the TMR Network "Gravitational Lensing: New Constraints on Cosmology and the Distribution of Dark Matter'' of the EC under contract No. ERBFMRX-CT97-0172.