In Fig. A.1 the relative positions of the components at different epochs are shown in cartesian and polar coordinates. These plots are only given for the 23 out of our 34 systems for which there are at least three data points. To obtain a simple approximation of the relative velocity we applied weighted linear fits to this data. For the 11 systems with only two observations we simply connect the two data points and derive the error of the relative velocity from the uncertainties of the two separations and position angles.
For a quantitative analysis, the relative velocities must be transformed
to an absolute length scale. This requires knowing the distances of the
discussed objects. We adopt distances to the SFRs that are the mean of all
Hipparcos distances derived for members of the respective association.
The values and references are given in Table 1.
There remains, however, an uncertainty, because distances of individual
objects may be different from these mean values. To take this into account, we
assume that the radial diameters of the SFRs are as large as their
projected diameters on the sky. The latter quantity can be estimated
to be ![]()
![]() for Taurus-Auriga (see Fig. 1 in Köhler
& Leinert 1998) as well as Scorpius-Centaurus (see Fig. 1
in Köhler et al. 2000). Concerning the mean distances
from Table 1, this corresponds to a diameter of 50pc.
Thus we will assume
for Taurus-Auriga (see Fig. 1 in Köhler
& Leinert 1998) as well as Scorpius-Centaurus (see Fig. 1
in Köhler et al. 2000). Concerning the mean distances
from Table 1, this corresponds to a diameter of 50pc.
Thus we will assume
![]() as the uncertainty for the
distance of an individual system, which is an upper limit: more than two
thirds of the stars will be within
as the uncertainty for the
distance of an individual system, which is an upper limit: more than two
thirds of the stars will be within ![]() 15pc for an even distribution.
15pc for an even distribution.
The velocities of the companions relative to the primaries derived by
applying the assumed distances are given in Table 2.
They are also plotted in Fig. 2 in cartesian and polar
coordinates (similar to Fig. 3 in G95). Our measurements can only cover the
projection of motion onto the sky, so the ![]() are given with respect to
the main component, not to the observer. The adopted v is
the mean of the respective values derived from the fits in cartesian
and polar coordinates. In 3 out of 34 systems v is different from zero
on the 3
are given with respect to
the main component, not to the observer. The adopted v is
the mean of the respective values derived from the fits in cartesian
and polar coordinates. In 3 out of 34 systems v is different from zero
on the 3![]() level, in 9 systems on the 2
level, in 9 systems on the 2![]() level and in
18 systems on the
level and in
18 systems on the ![]() level. Thus, we are fairly confident that
there really is relative motion of the components in most systems.
level. Thus, we are fairly confident that
there really is relative motion of the components in most systems.
We now examine the origin of this relative motion. For this purpose, we must discriminate orbital motion from an apparent relative motion that can be caused by the proper motion of a T Tauri star with respect to a background star projected by chance or by the proper motions of two T Tauri stars projected by chance. One has further to consider that "companions'' to T Tauri stars detected with only one observation in one filter are not necessarily stellar and may be Herbig-Haro objects. We will also examine the possible influence of unresolved additional components on the observed motion.
First we will derive an upper limit for relative velocities caused
by orbital motion. That limit is given by the condition that in the case
of orbital motion the kinetic energy of the system is less than its
(negative) potential energy and is equal to it in the extreme case of
a parabolic orbit, i.e.
We adopt
![]() as upper mass limit for one
T Tauri star (Hartmann 1998) and take the mean of the measured
projected separations as estimate for r. There is only one companion
with a relative velocity that is larger than the value derived from
Eq. (1), namely that of RXJ1546.1-2804. The
relative velocity of this companion is, however, still consistent with
orbital motion, considering the
as upper mass limit for one
T Tauri star (Hartmann 1998) and take the mean of the measured
projected separations as estimate for r. There is only one companion
with a relative velocity that is larger than the value derived from
Eq. (1), namely that of RXJ1546.1-2804. The
relative velocity of this companion is, however, still consistent with
orbital motion, considering the ![]() error in its v. The lower limit
for v is zero because in short pieces of orbit as discussed here the
orbital motion may occur purely radial to the observer. Thus, the large
majority of the velocities from Table 2 are consistent with
orbital motion.
error in its v. The lower limit
for v is zero because in short pieces of orbit as discussed here the
orbital motion may occur purely radial to the observer. Thus, the large
majority of the velocities from Table 2 are consistent with
orbital motion.
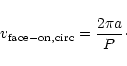
Furthermore, it is interesting to examine the relationship between
separation and relative velocity. In the special case of a circular orbit
observed face-on this relation will be
We conclude from this section that the observed relative velocities
in almost all cases are not in contradiction to orbital motion. For a final
classification, other possible origins of the relative motion must be
considered.
For V 773 Tau, the Hipparcos catalogue gives proper motions of
![]() and
and
![]() .
The resultant
.
The resultant
![]() is comparable with the
observed relative velocity of the components, but the proper motion
of V 773 Tau happens almost only in declination (X in Fig.
A.1) which is contradictory to our observations.
Furthermore, for V 773 Tau the relative motion is still
explainable with orbital motion, considering the upper limit derived
in Sect. 3.2.1.
is comparable with the
observed relative velocity of the components, but the proper motion
of V 773 Tau happens almost only in declination (X in Fig.
A.1) which is contradictory to our observations.
Furthermore, for V 773 Tau the relative motion is still
explainable with orbital motion, considering the upper limit derived
in Sect. 3.2.1.
In the case of RXJ1546.1-2804 there are no Hipparcos
data for this individual object, so we adopt the mean proper motion for the
OB association Upper Scorpius given by de Zeeuw et al. (1999).
These values are
![]() ,
,
![]() and
and
![]() with (formal) errors
of
with (formal) errors
of ![]()
![]() .
The respective values
from Table 2 are
.
The respective values
from Table 2 are
![]() ,
,
![]() and
and
![]() .
This is a close correspondance,
given that the the proper motion presented by de Zeeuw et al. (1999) is not for this single object, but for the
whole association. Note that
.
This is a close correspondance,
given that the the proper motion presented by de Zeeuw et al. (1999) is not for this single object, but for the
whole association. Note that ![]() and
and ![]() must be antiparallel
if the companion is a chance-projected background star, because in
that case
must be antiparallel
if the companion is a chance-projected background star, because in
that case ![]() is the motion of the primary with respect to the
"companion''. Another argument that supports the idea that
the companion of RXJ1546.1-2804 is a chance-projected
background star is that its relative motion is above the limit
given by Eq. (1). It is, however, still consistent with orbital
motion at the
is the motion of the primary with respect to the
"companion''. Another argument that supports the idea that
the companion of RXJ1546.1-2804 is a chance-projected
background star is that its relative motion is above the limit
given by Eq. (1). It is, however, still consistent with orbital
motion at the ![]() level.
level.
One must take into account that in both cases the measured
projected separations are
![]() ,
which makes any chance
projections very unlikely (see Sect. 3.2.3 for the probability
of chance projections). Thus, one must consider other origins of these
high relative velocities. One solution may be that the distances
of individual systems are largely different from the adopted values
(Table 1) for the SFRs as a whole.
The unusually high derived values for relative velocities would then
be caused by overestimating the objects' distances. Another possibile
explanation, namely the presence of unresolved additional companions,
will be discussed in Sect. 3.2.5.
,
which makes any chance
projections very unlikely (see Sect. 3.2.3 for the probability
of chance projections). Thus, one must consider other origins of these
high relative velocities. One solution may be that the distances
of individual systems are largely different from the adopted values
(Table 1) for the SFRs as a whole.
The unusually high derived values for relative velocities would then
be caused by overestimating the objects' distances. Another possibile
explanation, namely the presence of unresolved additional companions,
will be discussed in Sect. 3.2.5.
The companion of RXJ1546.1-2804 may be such a chance-projected background star. In the case of V 773 Tau this seems to be unlikely because the direction of proper motion does not match, however, the high relative velocity of the components remains problematic. Further observations of these systems will be necessary to determine whether there is a curvature in the relative motion which would undoubtedly classify it as orbital motion. In general, chance-projected background stars are not frequent among close visual companions to T Tauri stars.
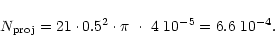
It is, however, not probable that chance projections within the same SFR
are a frequent phenomenon, because of the low stellar density in the SFRs
discussed here. Leinert et al. (1993) concluded that there
are less than 4 10-5 objects brighter than
![]() per
per
![]() in Taurus-Auriga.
This includes association members and field stars.
All companions discussed here are brighter than
in Taurus-Auriga.
This includes association members and field stars.
All companions discussed here are brighter than
![]() and have projected separations of less than
and have projected separations of less than
![]() .
The mean number of chance-projected companions within a radius
of
.
The mean number of chance-projected companions within a radius
of
![]() around our 21 objects in Taurus-Auriga is thus
around our 21 objects in Taurus-Auriga is thus
Furthermore, in the case of HVTau, where companion C has been declared as a Herbig-Haro object, we could show that in fact it is a stellar companion (Woitas & Leinert 1998).
Also in the V 773 Tau system, where we have noticed an unusually high relative velocity of the visual secondary (Sect. 3.2.2) there is an additional spectroscopic companion (Welty 1995). The period of this close pair is 51.1 days, so possible shifts of the photocenter are less than 2mas and thus not measurable by our observations.
A candidate for a system where the observed relative motion may be
influenced by an unresolved tertiary is BD+26718B Aa. In this
system
![]() at a separation of
at a separation of
![]() .
Similar to Elias 12, this value is close to
the upper limit for orbital motion (
.
Similar to Elias 12, this value is close to
the upper limit for orbital motion (
![]() from Eq. (1)), but also far below the relative velocity expected
for a background star projected by chance (Sect. 3.2.2).
from Eq. (1)), but also far below the relative velocity expected
for a background star projected by chance (Sect. 3.2.2).
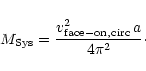
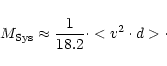
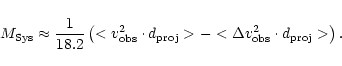
For all binary systems discussed here the available portions of the orbit are too short to calculate orbital parameters. The results presented in Table A.1, however, remain valuable for future orbit determinations that will yield empirical masses for T Tauri binary systems. Furthermore, it is already possible to estimate an average system mass from this database. This average mass is not dependent on theoretical assumptions about the physics of PMS evolution and should therefore be a reliable empirical estimation of the masses of T Tauri stars. To derive this mass we follow the approach of G95, but improve it in some important aspects.
First, we write Kepler's third law in the natural units
![]() ,
,
![]() and
and
![]() :
:
To overcome this problem, we performed more sophisticated computer
simulations. Each simulation contains 10million binaries with a
fixed system mass and randomly distributed orbital parameters. The
periods follow the distribution of periods of main-sequence stars
(Duquennoy & Mayor 1991), the distribution of eccentricities
is f(e)=2e and the inclinations are distributed isotropically, while
all the other parameters have uniform distributions. The distances to
the observer are varied within a range of ![]() pc. We chose two
observation dates separated by a random timespan between 4 and
10 years and computed the average projected separation and orbital
velocity, in much the same way as we did for the real data. We then
select binaries in the projected separation range from 10 to 70AU.
For these binaries, we compute
pc. We chose two
observation dates separated by a random timespan between 4 and
10 years and computed the average projected separation and orbital
velocity, in much the same way as we did for the real data. We then
select binaries in the projected separation range from 10 to 70AU.
For these binaries, we compute
![]() .
These
simulations are repeated for different system masses. For
.
These
simulations are repeated for different system masses. For
![]() between
between
![]() and
and
![]() ,
the
results vary from 18.4 to
,
the
results vary from 18.4 to
![]() .
This gives
us the following relation:
.
This gives
us the following relation:
If we use the data of all stars in our sample, Eq. (11)
yields a system mass of
![]() .
Excluding
RXJ1546.1-2804 lowers the result to
.
Excluding
RXJ1546.1-2804 lowers the result to
![]() .
If we further exclude V 773 Tau, Elias 12, and
BD+26718BAa, we arrive at a system mass of
.
If we further exclude V 773 Tau, Elias 12, and
BD+26718BAa, we arrive at a system mass of
![]() .
We have reason to assume that the companion to
RXJ1546.1-2804 is a chance projected background star.
For the three other systems mentioned, the velocity is puzzling at first
sight, but is still consistent with orbital motion. Furthermore, other
possible explanations fail for V 773 Tau and
Elias 12 (Sects. 3.2.2 and 3.2.5).
Thus, it does not seem justified to exclude them from the sample, and we will
adopt
.
We have reason to assume that the companion to
RXJ1546.1-2804 is a chance projected background star.
For the three other systems mentioned, the velocity is puzzling at first
sight, but is still consistent with orbital motion. Furthermore, other
possible explanations fail for V 773 Tau and
Elias 12 (Sects. 3.2.2 and 3.2.5).
Thus, it does not seem justified to exclude them from the sample, and we will
adopt
![]() as the result for the average dynamical system mass.
as the result for the average dynamical system mass.
Given the statistical uncertainties, it is difficult to estimate the error
of the system mass. Using the standard deviation of the quantities averaged
in Eq. (11) to estimate the error of the mean yields
![]()
![]() .
This is in agreement with the scatter we
obtain if we exclude or include the stars mentioned in the last paragraph.
.
This is in agreement with the scatter we
obtain if we exclude or include the stars mentioned in the last paragraph.
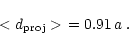
We conclude that the average mass of the systems in our sample is in
the range 1.3...2.5
![]() ,
with a most probable system mass
of
,
with a most probable system mass
of
![]() .
Our result is thus consistent with the expectation
that T Tauri stars' masses are around
.
Our result is thus consistent with the expectation
that T Tauri stars' masses are around
![]() and also
with the average mass of
and also
with the average mass of
![]() that G95 derived for their
sample.
that G95 derived for their
sample.
Copyright ESO 2001
![\begin{figure}
\par\includegraphics[width=16.7cm,clip]{ms9976f2.eps}
\end{figure}](/articles/aa/full/2001/13/aa9976/img40.gif)


![\begin{figure}
\par\includegraphics[width=7.7cm,clip]{ms9976f3.eps}
\end{figure}](/articles/aa/full/2001/13/aa9976/img53.gif)