Results are presented of a search for 22 GHz H2O
A&A 368, 950-968 (2001)
DOI: 10.1051/0004-6361:20010052
J. Th. van Loon1 - A. A. Zijlstra2 - V. Bujarrabal3 - L.-Å. Nyman4,5
1 - Institute of Astronomy, Madingley Road, Cambridge CB3 0HA, UK
2 - UMIST, PO Box 88, Manchester M60 1QD, UK
3 - Observatorio Astronómico Nacional, Campus Universitario,
Apartado 1143, 28800 Alcalá de Henares, Spain
4 - European Southern Observatory, Casilla 19001, Santiago 19, Chile
5 - Onsala Space Observatory, 439 92 Onsala, Sweden
Received 9 October 2000 / Accepted 3 January 2001
Abstract
Results are presented of a search for 22 GHz H2O
![]() ,
43 GHz SiO
,
43 GHz SiO
![]() ,
86 GHz
SiO
,
86 GHz
SiO
![]() and 129 GHz SiO
and 129 GHz SiO
![]() maser emission from bright IRAS point sources in the Small and Large
Magellanic Clouds - mostly circumstellar envelopes around obscured red
supergiants and Asymptotic Giant Branch stars (OH/IR stars). The aim of this
effort was to test whether the kinematics of the mass loss from these stars
depends on metallicity.
H2O maser emission was detected in the red supergiants IRAS 04553-6825 and
IRAS 05280-6910, and tentatively in the luminous IR object IRAS 05216-6753
and the AGB star IRAS 05329-6708, all in the LMC. SiO
maser emission from bright IRAS point sources in the Small and Large
Magellanic Clouds - mostly circumstellar envelopes around obscured red
supergiants and Asymptotic Giant Branch stars (OH/IR stars). The aim of this
effort was to test whether the kinematics of the mass loss from these stars
depends on metallicity.
H2O maser emission was detected in the red supergiants IRAS 04553-6825 and
IRAS 05280-6910, and tentatively in the luminous IR object IRAS 05216-6753
and the AGB star IRAS 05329-6708, all in the LMC. SiO
![]() maser emission was detected in IRAS 04553-6825.
The double-peaked H2O maser line profiles of IRAS 04553-6825 and
IRAS 05280-6910, in combination with the OH (and SiO) maser line profiles,
yield the acceleration of the outflows from these stars. The outflow velocity
increases between the H2O masing zone near the dust-formation region
and the more distant OH masing zone from
maser emission was detected in IRAS 04553-6825.
The double-peaked H2O maser line profiles of IRAS 04553-6825 and
IRAS 05280-6910, in combination with the OH (and SiO) maser line profiles,
yield the acceleration of the outflows from these stars. The outflow velocity
increases between the H2O masing zone near the dust-formation region
and the more distant OH masing zone from ![]() to 26 kms-1 for
IRAS 04553-6825 and from
to 26 kms-1 for
IRAS 04553-6825 and from ![]() to 17 kms-1 for IRAS 05280-6910.
The total sample of LMC targets is analysed in comparison with circumstellar
masers in the Galactic Centre. The photon fluxes of circumstellar masers in
the LMC are found to be very similar to those in the Galactic Centre. The
expansion velocities in the LMC appear to be
to 17 kms-1 for IRAS 05280-6910.
The total sample of LMC targets is analysed in comparison with circumstellar
masers in the Galactic Centre. The photon fluxes of circumstellar masers in
the LMC are found to be very similar to those in the Galactic Centre. The
expansion velocities in the LMC appear to be ![]() 20% lower than for
similarly bright OH masers in the Galactic Centre, but the data are still
consistent with no difference in expansion velocity. OH/IR stars in the LMC
appear to have slower accelerating envelopes than OH/IR stars in the Galactic
Centre.
The masers in the LMC have blue-asymmetric emission profiles. This may be due
to the amplification of stellar and/or free-free radiation, rather than the
amplification of dust emission, and may be more pronounced in low metallicity
envelopes.
The SiO maser strength increases with the photometric amplitude at 2.2
20% lower than for
similarly bright OH masers in the Galactic Centre, but the data are still
consistent with no difference in expansion velocity. OH/IR stars in the LMC
appear to have slower accelerating envelopes than OH/IR stars in the Galactic
Centre.
The masers in the LMC have blue-asymmetric emission profiles. This may be due
to the amplification of stellar and/or free-free radiation, rather than the
amplification of dust emission, and may be more pronounced in low metallicity
envelopes.
The SiO maser strength increases with the photometric amplitude at 2.2 ![]() m
but is independent of the photometric amplitude at 10
m
but is independent of the photometric amplitude at 10 ![]() m. This suggests a
strong connection between shocks in the dust-free SiO masing zone and the
dust formation process. The LMC masers obey the same trend as the Galactic
Centre masers.
Appendices describe H2O maser emission from the moderately mass-losing AGB
star R Dor in the Milky Way, optical echelle spectroscopy of IRAS 04553-6825,
and the properties of circumstellar masers in the Galactic Centre.
m. This suggests a
strong connection between shocks in the dust-free SiO masing zone and the
dust formation process. The LMC masers obey the same trend as the Galactic
Centre masers.
Appendices describe H2O maser emission from the moderately mass-losing AGB
star R Dor in the Milky Way, optical echelle spectroscopy of IRAS 04553-6825,
and the properties of circumstellar masers in the Galactic Centre.
Key words: masers - circumstellar matter - stars: mass loss - stars: AGB and
post-AGB - supergiants -
Magellanic Clouds
In the latest stages of their evolution, both massive and intermediate-mass
stars pass through a phase of intense mass loss at rates of 10-6 to
10-3 ![]() yr-1 (van Loon et al. 1999b), returning a major
fraction of their initial mass to the interstellar medium (ISM). For stars of
yr-1 (van Loon et al. 1999b), returning a major
fraction of their initial mass to the interstellar medium (ISM). For stars of
![]() this occurs when they are red supergiants
(RSGs), and for stars of
this occurs when they are red supergiants
(RSGs), and for stars of
![]() when they are
Asymptotic Giant Branch (AGB) stars before becoming a Planetary Nebula (PN).
They become enshrouded by their dusty circumstellar envelope (CSE), rendering
them invisible at optical wavelengths. The absorbed radiation is re-emitted by
the dust at longer wavelengths, making them very bright IR objects. This is
also when, in oxygen-rich CSEs, maser emission from OH, H2O and SiO
molecules may be observed. Hence these objects are known as OH/IR stars.
when they are
Asymptotic Giant Branch (AGB) stars before becoming a Planetary Nebula (PN).
They become enshrouded by their dusty circumstellar envelope (CSE), rendering
them invisible at optical wavelengths. The absorbed radiation is re-emitted by
the dust at longer wavelengths, making them very bright IR objects. This is
also when, in oxygen-rich CSEs, maser emission from OH, H2O and SiO
molecules may be observed. Hence these objects are known as OH/IR stars.
The locations and intensities of masers are determined by molecular abundance,
dust temperature, gas density, and velocity (Goldreich & Scoville 1976; Lewis
1989). Where H2O is not shielded from interstellar UV radiation it is
dissociated into OH. SiO is depleted into dust grains except close to the
star. Maser strengths scale with the local kinetic energy density or the local
IR radiation field, which both depend on the CSE temperature. Masers are
quenched above a critical density. Finally, the radiation field in the maser
transition is amplified only by molecules that have small projected velocity
differences (within the thermal width of the maser line, i.e.
![]() km
s-1).
km
s-1).
As a result the CSE has a layered maser structure, corresponding to subsequent
stages in the mass-loss process from the underlying star. Strong pulsations of
the stellar photosphere of these Long Period Variables (LPVs) eject matter in
which dust forms at typically 1 to 10 stellar radii (![]() ). Radiation
pressure accelerates the matter to velocities exceeding the escape velocity.
Matter that does not reach the dust formation radius falls back to the star.
At distances of
). Radiation
pressure accelerates the matter to velocities exceeding the escape velocity.
Matter that does not reach the dust formation radius falls back to the star.
At distances of
![]() ,
the stellar wind flows with constant
velocity
,
the stellar wind flows with constant
velocity ![]() into interstellar space. SiO masers probe the inner
dust-free zone, H2O masers probe the acceleration zone, and OH
masers probe the final stellar wind. This has been beautifully confirmed by
interferometric observations of Galactic OH/IR stars (Diamond et al. 1984;
Richards et al. 1996; Colomer et al. 2000).
into interstellar space. SiO masers probe the inner
dust-free zone, H2O masers probe the acceleration zone, and OH
masers probe the final stellar wind. This has been beautifully confirmed by
interferometric observations of Galactic OH/IR stars (Diamond et al. 1984;
Richards et al. 1996; Colomer et al. 2000).
The physical conditions in the CSE, and the evolutionary stage of the star can
be determined from the presence or absence of different species of masers, and
from their photon fluxes. The kinematic structure of the CSE can be determined
from the maser line profiles. SiO maser radiation is predominantly amplified
tangentially, resulting in a single maser peak within a few kms-1 of the
stellar velocity ![]() .
OH maser radiation is beamed radially, resulting
in a double-peaked line profile, spanning
.
OH maser radiation is beamed radially, resulting
in a double-peaked line profile, spanning
![]() .
H2O masers
are single-peaked in Mira variables but double-peaked in OH/IR stars (Takaba
et al. 1994). Hence, in OH/IR stars H2O masers yield the expansion
velocity at the base of the acceleration zone in the CSE.
.
H2O masers
are single-peaked in Mira variables but double-peaked in OH/IR stars (Takaba
et al. 1994). Hence, in OH/IR stars H2O masers yield the expansion
velocity at the base of the acceleration zone in the CSE.
| site | dates | transition |
|
N | band |
|
beam |
|
cal. | ||
| d/m/y | GHz | kms-1 | kms-1 | MHz | m | K | Jy/K | ||||
| Parkes | 19-20/8/97 | H2O
|
22.23507985 | 340 | 0.84 | 1024 | 64 | 45 | 1.3 | 110 | 6 |
| Parkes | 5-13/4/00 | H2O
|
22.23507985 | 200 | 0.42 | 2049 | 64 | 45 | 1.3 | 140-180 | 6 |
| Mopra | 18-29/1/99 | H2O
|
22.23507985 | 270 | 0.84 | 1024 | 64 | 22 | 2.7 | 115 | 20 |
| Parkes | 16-25/8/95 | SiO
|
43.122080 | 249.8 | 0.2173 | 1024 | 32 | 17 | 1.6 | 80 | 39 |
| Mopra | 29/8-6/9/95 | SiO
|
86.243442 | 250 | 0.2173 | 1024 | 64 | 16 | 1.0 | 130 | 45 |
| SEST | 25-31/5/95 | SiO
|
86.243442 | 290 | 0.15 | 2000 | 86 | 15 | 0.95 | 110-150 | 25 |
| SEST | 29-31/5/95 | SiO
|
86.243442 | 290 | 2.4 | 1600 | 1086 | 15 | 0.95 | 110-150 | 25 |
| SEST | 25-28/5/95 | SiO
|
129.363368 | 290 | 1.6 | 1440 | 995 | 15 | 0.67 | 190-250 | 29 |
A significant population of confirmed and suspected OH/IR stars in the Small
and Large Magellanic Clouds (SMC & LMC) has now been identified and studied
(Wood et al. 1992; Zijlstra et al. 1996; Loup et al. 1997; van Loon et al. 1997, 1998a, 1999a,b). The metallicities of the intermediate-age populations
in the SMC and LMC are ![]() 7 and
7 and ![]() 3
3![]() lower than solar, and hence
the dependence of the mass loss on metallicity may be investigated (van Loon
2000). A study of Magellanic circumstellar masers may shed light on the
metallicity dependence of the envelope kinematics. Here the final results are
presented of surveys for H2O and SiO masers in the Magellanic Clouds (van Loon et al. 1996, 1998b).
lower than solar, and hence
the dependence of the mass loss on metallicity may be investigated (van Loon
2000). A study of Magellanic circumstellar masers may shed light on the
metallicity dependence of the envelope kinematics. Here the final results are
presented of surveys for H2O and SiO masers in the Magellanic Clouds (van Loon et al. 1996, 1998b).
A summary of the observations can be found in Table 1. No attempts were made to better determine the positions of (tentatively) detected maser sources.
The 64 m radio telescope at Parkes, Australia, was used with the 1.3 cm
receiver plus autocorrelator to observe 22 GHz H2O masers. Using the Dual
Circular feed spectra were obtained simultaneously in left and right circular
polarization. No difference was found between them, and they were averaged.
The current K-band facility at Parkes is not as powerful as the beam-switching
set-up used in the early 1980's that yielded
![]() K (Whiteoak
& Gardner 1986). Weather conditions were generally fair.
K (Whiteoak
& Gardner 1986). Weather conditions were generally fair.
In the 1997 run only the LMC targets IRAS 04553-6825 and IRAS 05329-6708
were observed, for six and three hours on-source integration, respectively.
The nearby sky was measured every two minutes, resulting in very flat
baselines that required only a shallow second-order polynomial to be
subtracted. The 22 GHz discovery spectrum of IRAS 04553-6825 was already
presented in van Loon et al. (1998b). In the 2000 run, on-source integration
times were a few hours per target. The sky was measured every two minutes -
most of the time at ![]() N of the source. Pointing, focus and
calibration were checked regularly by observing the nearby bright maser source
R Dor (see Appendix A) at different zenith distances. The pointing accuracy
was found to be
N of the source. Pointing, focus and
calibration were checked regularly by observing the nearby bright maser source
R Dor (see Appendix A) at different zenith distances. The pointing accuracy
was found to be ![]()
![]() and flux losses due to pointing errors
are less than
and flux losses due to pointing errors
are less than ![]() 10%.
10%.
The 22 m radio telescope at Mopra, Australia, was used with the 1.3 cm receiver plus autocorrelator to observe 22 GHz H2O masers. The opacity correction was usually between 1.3 and 1.6. The conversion factor agrees with the observed noise and flux density for R Dor (48 Jy).
The background was measured every four minutes at both sides of the target.
The baseline was estimated for each individual spectrum by a running average
(within 1-![]() around the median) over 55 channels. After subtracting the
baselines, the flux density was obtained by averaging (within 3-
around the median) over 55 channels. After subtracting the
baselines, the flux density was obtained by averaging (within 3-![]() around the median) over the time series of spectra. This procedure yielded
flat baselines and effectively rejected bad spectra. Flux conservation was
tested on the well-detected H2O maser spectra of IRAS 04553-6825.
around the median) over the time series of spectra. This procedure yielded
flat baselines and effectively rejected bad spectra. Flux conservation was
tested on the well-detected H2O maser spectra of IRAS 04553-6825.
The 64 m radio telescope at Parkes, Australia, was used with the 0.7 cm single polarization receiver plus correlator to observe 43 GHz SiO masers. The background was measured by alternation between two targets every 150 seconds. Reasonably flat baselines were obtained by subtracting a fifth order polynomial plus a sine with a period of 200 channels. The useful heliocentric velocity range runs from 167 to 322 kms-1.
The 22 m radio telescope at Mopra, Australia, was used with the 3 mm SIS
receiver plus correlator to observe 86 GHz SiO masers. The spectra were
obtained simultaneously in two orthogonal polarizations that were then
averaged. The pointing was checked every few hours on R Dor, and was accurate
to <
![]() rms. The background was measured by alternation
between two of these targets every few minutes. The baselines were very flat.
rms. The background was measured by alternation
between two of these targets every few minutes. The baselines were very flat.
The 15 m Swedish-ESO Sub-mm Telescope (SEST) at the European Southern Observatory (ESO) at La Silla, Chile, was used with the 3 mm receiver plus the acousto-optical High Resolution Spectrograph (HRS) to observe 86 GHz SiO masers. This configuration was used simultaneously with the Low Resolution Spectrograph (LRS) either tuned at the same frequency or coupled to the 2 mm receiver to observe 129 GHz SiO masers.
The internal absolute flux calibration is accurate to ![]() 20%. The
observations were done in Double Beam Switch Mode, with a beam throw of
20%. The
observations were done in Double Beam Switch Mode, with a beam throw of
![]() 11.5
11.5![]() in azimuth. The pointing was checked every few hours on R
Dor, and was accurate to
in azimuth. The pointing was checked every few hours on R
Dor, and was accurate to ![]()
![]() rms. The atmospheric
conditions were very good: a relative humidity of typically 15 to 30%, an
outside air temperature of
rms. The atmospheric
conditions were very good: a relative humidity of typically 15 to 30%, an
outside air temperature of ![]() 15
15
![]() ,
and little or no cirrus.
The baselines were very flat, requiring only a zeroth order polynomial to be
subtracted from each spectrum.
,
and little or no cirrus.
The baselines were very flat, requiring only a zeroth order polynomial to be
subtracted from each spectrum.
IRAS 04553-6825, after its 86 GHz SiO maser emission had been detected (van Loon et al. 1996), was re-observed on 7 occasions during the period from July 1996 to January 1998, with the SEST and the HRS and LRS at 86 GHz using the same observing strategy as described above. The total on-source integration time at 86 GHz was 65 and 51 hr with the HRS and LRS, respectively. During this campaign IRAS 05329-6708 and IRAS 05280-6910 were re-observed in January 1998.
| IRAS-PSC | S12 | S25 | type | OH |
| SMC sources | ||||
| 00483-7347 | 0.64 | 0.49 | AGB | |
| 00486-7308 |
0.41 | <0.60 | AGB | |
| 01074-7140 | 0.36 | 0.47 | AGB | |
| LMC sources | ||||
| 04407-7000 | 0.81 | 0.70 | AGB | yes |
| 04491-6915 | 0.53 | 2.17 | H II | |
| 04498-6842 | 1.31 | 1.05 | AGB | |
| 04514-6931 | 0.36 | 3.52 | H II ? | |
| 04530-6916 | 2.12 | 5.10 | RSG ? | no |
| 04545-7000 | 0.52 | 0.84 | AGB | yes |
| 04546-6915 | 1.17 | 9.67 | H II | |
| 04553-6933 | 0.53 | 0.48 | RSG | |
| 04553-6825 | 9.15 | 14.36 | RSG | yes |
| 04571-6627 | 0.42 | 3.03 | H II | |
| 04581-7013 | 0.41 | 0.39 | RSG | |
| 05198-6941 | 2.63 | 7.15 | H II | |
| 05216-6753 | 4.10 | 14.56 | RSG ? | no |
| 05280-6910 | 4.16 | 24.18 | RSG ? | yes |
| 05298-6957 | 0.85 | 1.38 | AGB | yes |
| 05325-6743 | 1.20 | 6.47 | H II | |
| 05329-6708 | 0.98 | 1.48 | AGB | yes |
| 05346-6949 | 7.78 | 20.75 | RSG | no |
| 05402-6956 | 0.82 | 1.11 | AGB | yes |
The targets comprise the known Magellanic OH/IR stars, plus other IR objects
in the SMC and LMC: mainly dust-enshrouded AGB stars, RSGs or H II
emission objects (LHA numbers from Henize 1956) often related to sites of
recent/on-going star formation. Additional 22 GHz observations of the Galactic
AGB star R Dor are described in Appendix A. The IRAS names of the targets are
listed in Table 2, together with the IRAS flux densities at 12 and 25 ![]() m,
object classification, and whether OH maser emission has been detected (yes),
not detected (no), or not tried ( ) by Wood et al. (1986, 1992) or van Loon
et al. (1998a). The results for the targets (tentatively) detected in at
least one of the H2O or SiO maser transitions are summarised in Table 3,
whilst upper limits (3-
m,
object classification, and whether OH maser emission has been detected (yes),
not detected (no), or not tried ( ) by Wood et al. (1986, 1992) or van Loon
et al. (1998a). The results for the targets (tentatively) detected in at
least one of the H2O or SiO maser transitions are summarised in Table 3,
whilst upper limits (3-![]() noise levels) for the non detections are
summarised in Table 4.
noise levels) for the non detections are
summarised in Table 4.
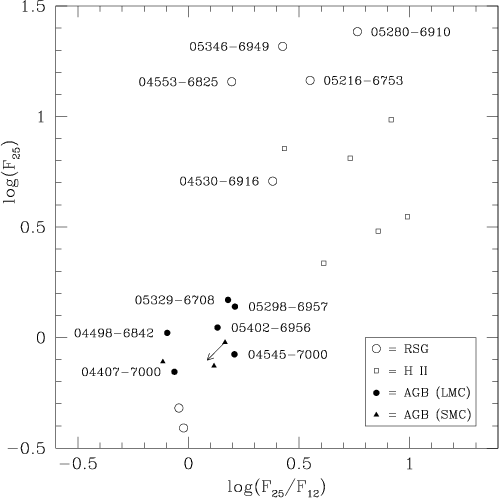 |
Figure 1:
Diagram of 25 |
| Open with DEXTER | |
| H2O | SiO | |||||||
| IRAS-PSC | P22(1997) | P22(2000) | M22 | P43 | M86 | S86(HRS) | S86(LRS) | S129 |
| LMC sources | ||||||||
| 04553-6825 |
|
|
|
<0.67 | <0.22 |
|
|
<0.15 |
| 05216-6753 | (
|
<0.90 | <0.28 | <0.16 | ||||
| 05280-6910 |
|
(
|
<1.5 | <0.34 | (
|
<0.22 | <0.18 | |
| 05329-6708 | (
|
<0.027 | <0.09 | <1.6 | (
|
<0.14 | <0.17 | |
| H2O | SiO | |||
| IRAS-PSC | P22(2000) | M22 | P43 | M86 |
| SMC sources | ||||
| 00483-7347 | 0.030 | 0.15 | ||
| 00486-7308 | 0.033 | |||
| 01074-7140 | 0.039 | |||
| LMC sources | ||||
| 04407-7000 | 0.09 | 1.5 | 0.35 | |
| 04491-6915 | 1.5 | |||
| 04498-6842 | 2.0 | |||
| 04514-6931 | 2.0 | |||
| 04530-6916 | 0.039 | 0.12 | ||
| 04545-7000 | 0.027 | 2.2 | ||
| 04546-6915 | 2.2 | |||
| 04553-6933 | 2.0 | |||
| 04571-6627 | 2.0 | |||
| 04581-7013 | 2.0 | |||
| 05198-6941 | 2.0 | |||
| 05298-6957 |
0.024 | 0.17 | 1.2 | 0.46 |
| 05325-6743 | 1.6 | |||
| 05346-6949 | 0.033 | 0.11 | 1.5 | |
| 05402-6956 | 0.036 | 0.15 | 1.2 | |
The IRAS mid-IR flux densities and flux density ratios often carry information
about the nature of the IR source (Fig. 1). The AGB stars amongst the targets
represent the most luminous AGB stars with the highest mass-loss rates
encountered in the MCs, with typical mid-IR flux densities of ![]() 1 Jy.
Because of their higher luminosity and sometimes also higher mass-loss rate,
RSGs may become somewhat redder and more than an order of magnitude brighter
at 25
1 Jy.
Because of their higher luminosity and sometimes also higher mass-loss rate,
RSGs may become somewhat redder and more than an order of magnitude brighter
at 25 ![]() m than these extreme AGB stars. RSGs, due to their short lifetimes,
may still be associated with H II regions that usually have very red
mid-IR colours. Very young supergiants may be dust-enshrouded inside of an
ultracompact H II region with similarly red colours (see, for instance,
Persi et al. 1994). The individual targets are described below - with a
general reference to Loup et al. (1997) - together with the results from our
maser search.
m than these extreme AGB stars. RSGs, due to their short lifetimes,
may still be associated with H II regions that usually have very red
mid-IR colours. Very young supergiants may be dust-enshrouded inside of an
ultracompact H II region with similarly red colours (see, for instance,
Persi et al. 1994). The individual targets are described below - with a
general reference to Loup et al. (1997) - together with the results from our
maser search.
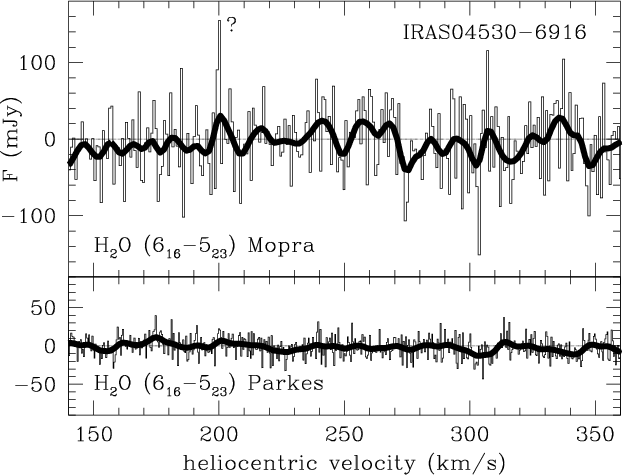 |
Figure 2:
IRAS 04530-6916: Mopra & Parkes (2000) 22 GHz spectra. The
velocities are heliocentric. The boldfaced curves are the spectra smoothed by
a Gaussian of
|
| Open with DEXTER | |
This source may be interpreted as a luminous RSG or AGB star, with a high
mass-loss rate of
![]()
![]() yr-1 (van Loon
et al. 1999b) and detected by IRAS even at 100
yr-1 (van Loon
et al. 1999b) and detected by IRAS even at 100 ![]() m (Trams et al. 1999). It
is located in the H II region DEM L15. Variability in the near-IR is
reported by Wood et al. (1992), with a period of
m (Trams et al. 1999). It
is located in the H II region DEM L15. Variability in the near-IR is
reported by Wood et al. (1992), with a period of ![]() 1260 days, but the
amplitudes are only
1260 days, but the
amplitudes are only
![]() mag even in the J-band. An I-band spectrum of the
near-IR object associated with the IRAS source reveals an early-type
emission-line spectrum (Cioni et al., in preparation) adding some confusion
with regard to the nature of this object.
mag even in the J-band. An I-band spectrum of the
near-IR object associated with the IRAS source reveals an early-type
emission-line spectrum (Cioni et al., in preparation) adding some confusion
with regard to the nature of this object.
A narrow 3-![]() peak (
peak (![]() 150 mJy) at
150 mJy) at
![]() kms-1in the Mopra 22 GHz spectrum could not be confirmed at Parkes at much lower
noise levels (Fig. 2), possibly due to temporal variability of the H2O
maser emission (see, for instance, Persi et al. 1994) or to beamsize
differences if the source is at
kms-1in the Mopra 22 GHz spectrum could not be confirmed at Parkes at much lower
noise levels (Fig. 2), possibly due to temporal variability of the H2O
maser emission (see, for instance, Persi et al. 1994) or to beamsize
differences if the source is at ![]()
![]() from IRAS 04530-6916. The
maser velocity would be rather different from the 21 cmH I that peaks
at
from IRAS 04530-6916. The
maser velocity would be rather different from the 21 cmH I that peaks
at
![]() kms-1 (Kim et al. 1999), but this is also the
case for some of the H2O masers in the giant star forming region 30 Doradus
(van Loon & Zijlstra 2000).
kms-1 (Kim et al. 1999), but this is also the
case for some of the H2O masers in the giant star forming region 30 Doradus
(van Loon & Zijlstra 2000).
This supergiant is of spectral type M2 (WOH S71: Westerlund et al. 1981).
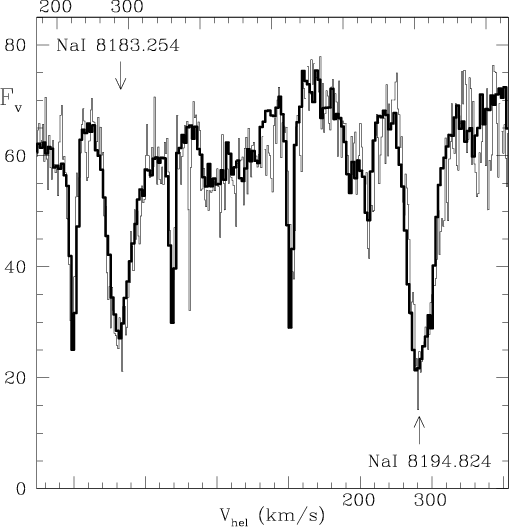
IRAS 04553-6825 is a very luminous obscured RSG that has been extensively
discussed in the past (van Loon et al. 1999a,b and references therein). OH
maser emission at 1612 and 1665 MHz was discovered by Wood et al. (1986,
1992), SiO maser emission at 86 GHz by van Loon et al. (1996), and H2O
maser emission at 22 GHz by van Loon et al. (1998b).
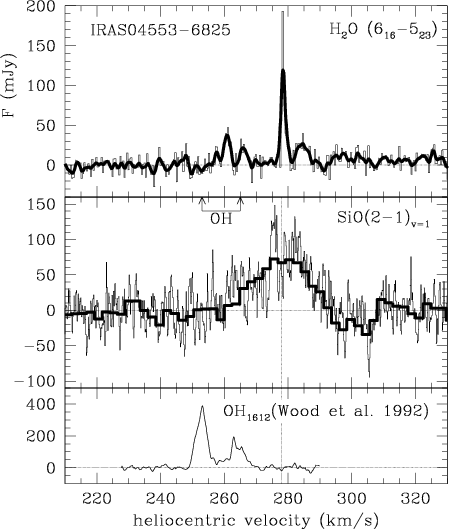 |
Figure 3:
IRAS 04553-6825: spectra of the 22 GHz H2O (top; Parkes 2000)
and 86 GHz SiO (middle; SEST) maser emission. The boldfaced curve in the upper
panel is the spectrum smoothed by a Gaussian of
|
| Open with DEXTER | |
The H2O maser emission from IRAS 04553-6825 was confirmed with Mopra, and
re-observed with Parkes on two occasions in the 2000 run. The (integration
time & system temperature weighted) average of the latter is presented in
Fig. 3 (top panel). The integrated flux of the H2O maser emission between
255 and 307 kms-1 equals 0.65 Jy kms-1, corresponding to a photon
flux of
1.0 1045 s-1. The very narrow main peak is brighter in
the 2000 run at least partly due to the higher spectral resolution, and may,
in fact, still be unresolved. The double peak at blue-shifted velocities is
intriguing, as the shape closely resembles that of the 1612 MHz OH emission
profile (Wood et al. 1992) but at slightly smaller velocity displacements of
-13 and -18 kms-1 with respect to the main H2O maser peak at
![]() kms-1, instead of -14 and -26 kms-1. This
strongly suggests that the blue-shifted H2O maser peaks and the OH maser
peaks are formed in related but displaced regions in the CSE outflow. The
blue-shifted H2O maser emission was not noticed in the discovery spectrum
(van Loon et al. 1998b) but can be recovered in that data a posteriori.
The additional red-shifted H2O maser peak perhaps arises from some local
density enhancement or increased coherent path length in part of the CSE at
the far side of the star.
kms-1, instead of -14 and -26 kms-1. This
strongly suggests that the blue-shifted H2O maser peaks and the OH maser
peaks are formed in related but displaced regions in the CSE outflow. The
blue-shifted H2O maser emission was not noticed in the discovery spectrum
(van Loon et al. 1998b) but can be recovered in that data a posteriori.
The additional red-shifted H2O maser peak perhaps arises from some local
density enhancement or increased coherent path length in part of the CSE at
the far side of the star.
The composite spectrum of all SEST observations at 86 GHz of IRAS 04553-6825
is presented in Fig. 3 (middle panel). The HRS spectrum is overlaid by the
LRS spectrum. The quality of the individual spectra is insufficient for a
detailed study of spectral changes with pulsational phase: no variability more
than a factor two is seen in the peak or integrated flux density. The SiO
maser properties have been listed in van Loon et al. (1998b). SiO maser
emission can be traced between velocities of ![]() 260 and 290 kms-1,
and there is evidence for the peak of the emission to be split into two peaks
260 and 290 kms-1,
and there is evidence for the peak of the emission to be split into two peaks
![]() 8 kms-1 apart. The shoulder of SiO maser emission between
8 kms-1 apart. The shoulder of SiO maser emission between
![]() 260 and 266 kms-1 may be related to the blue-shifted H2O maser
peaks. The velocity of the main H2O maser peak falls right in the centre of
the double-peaked SiO emission.
260 and 266 kms-1 may be related to the blue-shifted H2O maser
peaks. The velocity of the main H2O maser peak falls right in the centre of
the double-peaked SiO emission.
Two lines at 298 and 305 kms-1 are detected apparently in absorption
(Fig. 3, middle panel), and they are also visible at several individual
epochs. SiO masing lines have never been seen in absorption in Galactic
sources for good reasons: the excitation temperature is ![]() 1800 ¹K. The
features may correspond to SiO emission in the off-source beam. It is hard to
trace back this source as the beamswitching was done in azimuth and hence the
off-source beam swept across the sky during each observing session.
1800 ¹K. The
features may correspond to SiO emission in the off-source beam. It is hard to
trace back this source as the beamswitching was done in azimuth and hence the
off-source beam swept across the sky during each observing session.
This is a variable star (HV2255) of spectral type M4.
This object is very bright in the IR, with possibly an early-type supergiant
underlying its CSE (Zijlstra et al. 1996). Marginal variability is detected
by Wood et al. (1992), who suggest it may be a proto-PN or post-RSG object
and who note the similarity with IRAS 04530-6916.
| |
Figure 4:
IRAS 05216-6753: spectrum of the tentative detection of 22 GHz
H2O maser emission (indicated by the arrow). The velocities are
heliocentric. The boldfaced curve is the spectrum smoothed by a Gaussian of
|
| Open with DEXTER | |
The 22 GHz spectrum with Parkes shows a peak of ![]() 45mJy - a 3 to
4-
45mJy - a 3 to
4-![]() level after some smoothing - at
level after some smoothing - at
![]() kms-1(Fig. 4). The peak has a FWHM of
kms-1(Fig. 4). The peak has a FWHM of ![]() 3kms-1. The integrated flux of
the emission is
3kms-1. The integrated flux of
the emission is ![]() 0.5Jykms-1, corresponding to a photon flux of
0.5Jykms-1, corresponding to a photon flux of
![]() 8 1044s-1. There may be a secondary peak at 289kms-1.
8 1044s-1. There may be a secondary peak at 289kms-1.
The 1665 MHz OH maser attributed to IRAS 05280-6910 is located at the centre
of the cluster NGC 1984 (Wood et al. 1992). The IRAS 12, 25 and 60 ![]() m flux
densities suggest a very cool and luminous CSE, possibly a post-RSG object.
The proposed near-IR counterpart is with K=8.19 mag very bright, but with
(J-K)=1.01 not very red (Wood et al. 1992). Within the Parkes beam of
m flux
densities suggest a very cool and luminous CSE, possibly a post-RSG object.
The proposed near-IR counterpart is with K=8.19 mag very bright, but with
(J-K)=1.01 not very red (Wood et al. 1992). Within the Parkes beam of
![]()
![]() at OH frequencies are three luminous late type variable stars
of
at OH frequencies are three luminous late type variable stars
of ![]() and
and ![]() mag, a PN (SMP LMC 64), several IR objects, the H
II region DEM L198 at
mag, a PN (SMP LMC 64), several IR objects, the H
II region DEM L198 at
![]() W, and the cluster NGC 1994
(IRAS 05287-6910) at
W, and the cluster NGC 1994
(IRAS 05287-6910) at ![]()
![]() E. It may well be that only the 1612 MHz
emission arises from the CSE of an evolved star in the region of NGC 1984,
whilst the 1665 MHz emission arises from the ISM.
E. It may well be that only the 1612 MHz
emission arises from the CSE of an evolved star in the region of NGC 1984,
whilst the 1665 MHz emission arises from the ISM.
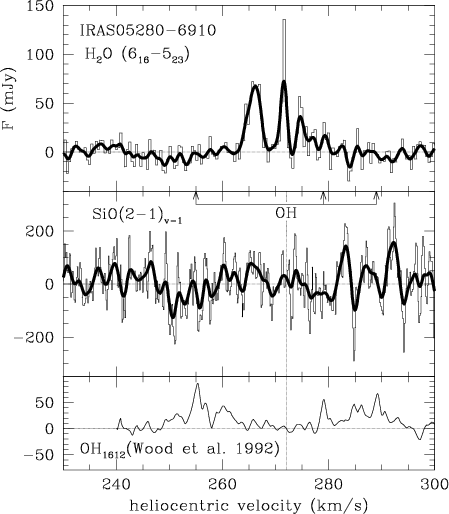 |
Figure 5:
IRAS 05280-6910: spectra of the 22 GHz H2O (top; Parkes 2000)
and 86 GHz SiO (middle; SEST) maser emission. The boldfaced curves are the
spectra smoothed by a Gaussian of
|
| Open with DEXTER | |
Bright and complex H2O maser emission was detected with Parkes (Fig. 5,
top panel). The very narrow and probably unresolved main peak is at
![]() kms-1, which also defines the centroid velocity of the OH 1612
MHz maser emission as observed by Wood et al. (1992). This confirms the
cluster object IRAS 05280-6910 to be the source of the 1612 MHz OH maser
emission. A rather broad and bright additional peak is blue-shifted by
kms-1, which also defines the centroid velocity of the OH 1612
MHz maser emission as observed by Wood et al. (1992). This confirms the
cluster object IRAS 05280-6910 to be the source of the 1612 MHz OH maser
emission. A rather broad and bright additional peak is blue-shifted by ![]() 5
kms-1, and fainter and possibly sub-structured emission is seen at
red-shifted velocities of
5
kms-1, and fainter and possibly sub-structured emission is seen at
red-shifted velocities of ![]() 3 to 8 kms-1 with respect to the main
peak. The integrated flux of the H2O maser emission between 260 and 284 km
s-1 equals 0.42 Jy kms-1, corresponding to a photon flux of
6.5 1044 s-1, not much less than IRAS 04553-6825. Both the
main and the blue-shifted additional peaks can be recovered a posteriori
in the Mopra 22 GHz data of IRAS 05280-6910.
3 to 8 kms-1 with respect to the main
peak. The integrated flux of the H2O maser emission between 260 and 284 km
s-1 equals 0.42 Jy kms-1, corresponding to a photon flux of
6.5 1044 s-1, not much less than IRAS 04553-6825. Both the
main and the blue-shifted additional peaks can be recovered a posteriori
in the Mopra 22 GHz data of IRAS 05280-6910.
The 86 GHz SiO maser spectrum of IRAS 05280-6910 is presented in Fig. 5
(middle panel). A constant baseline offset of 2 mJy has been subtracted. The
strongest peak, at a heliocentric velocity of 292 kms-1, has a peak flux
density of 0.30 Jy (
![]() ). There is another (
). There is another (![]() )
peak at a
velocity of 284 kms-1, and a hint of faint emission at
)
peak at a
velocity of 284 kms-1, and a hint of faint emission at
![]() kms-1 (at which also H2O maser emission is seen). The
integrated flux of the emission around 265, 284 and 292 kms-1 equals
kms-1 (at which also H2O maser emission is seen). The
integrated flux of the emission around 265, 284 and 292 kms-1 equals
![]() Jy kms-1, corresponding to a photon flux of
1.2 1045s-1. The SiO detection is rather uncertain, though, and might still be
(strong) noise.
Jy kms-1, corresponding to a photon flux of
1.2 1045s-1. The SiO detection is rather uncertain, though, and might still be
(strong) noise.
This is thought to be a very luminous and highly obscured RSG (Elias et al. 1986), but this is still uncertain. Its IRAS-LRS spectrum is odd in that it shows a flat continuum with peculiar features (Kwok et al. 1997).
The AGB stars amongst the LMC targets are oxygen rich, very luminous, variable
on long timescales (![]() 103 days) and severely dust-enshrouded
(Wood et al. 1992; van Loon et al. 1998a, 1999a,b). For some, mid-IR spectra have
been obtained by Trams et al. (1999), showing the 10
103 days) and severely dust-enshrouded
(Wood et al. 1992; van Loon et al. 1998a, 1999a,b). For some, mid-IR spectra have
been obtained by Trams et al. (1999), showing the 10 ![]() m silicate dust
feature in absorption with some emission wings remaining (see also Groenewegen
et al. 1995; Zijlstra et al. 1996 for IRAS 05329-6708).
m silicate dust
feature in absorption with some emission wings remaining (see also Groenewegen
et al. 1995; Zijlstra et al. 1996 for IRAS 05329-6708).
These stars comprise all known AGB sources of OH maser emission in the LMC, except the bluest amongst them, IRAS 04498-6842, that has not (yet) been detected at 1612 MHz. The only typical saturated double-peaked OH maser emission profile is found in IRAS 05298-6957. IRAS 04407-7000 is single peaked at 1612 MHz (van Loon et al. 1998a), and consequently no expansion velocity of the CSE can be determined, whilst the other emission profiles are rather complex and/or faint.
This object is located in a small double association of stars (#200 & 201 in
Bica et al. 1999), with a cluster at ![]()
![]() .
.
This star is in a cluster containing a carbon star and has an initial mass of
![]()
![]() (van Loon et al. 2000).
(van Loon et al. 2000).
The brightest AGB star in the LMC at 25 ![]() m, it was first identified with
the optically visible semi-regular variable TRM060 (Reid et al. 1990) before
the IRAS source was identified in the near-IR at
m, it was first identified with
the optically visible semi-regular variable TRM060 (Reid et al. 1990) before
the IRAS source was identified in the near-IR at ![]()
![]() S of
TRM060 by Wood et al. (1992). The region around IRAS 05329-6708 is very
crowded, with a PN (TRM058 = LI-LMC1280) at
S of
TRM060 by Wood et al. (1992). The region around IRAS 05329-6708 is very
crowded, with a PN (TRM058 = LI-LMC1280) at
![]() SW, and an M4 Iab RSG
(HV5933 = TRM063 = IRAS 05334-6706) at
SW, and an M4 Iab RSG
(HV5933 = TRM063 = IRAS 05334-6706) at
![]() NE. The latter has IRAS
12 and 25
NE. The latter has IRAS
12 and 25 ![]() m flux densities of 0.30 and 0.21 Jy, respectively.
m flux densities of 0.30 and 0.21 Jy, respectively.
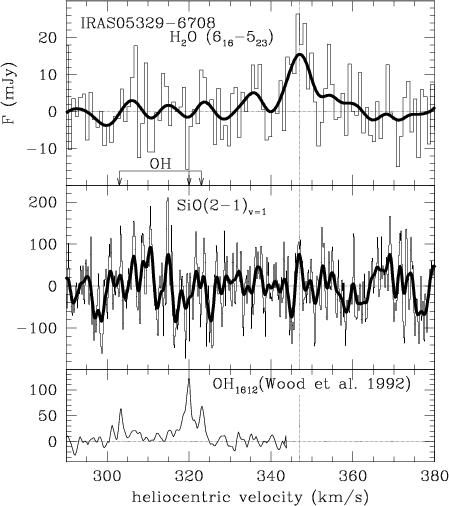 |
Figure 6:
IRAS 05329-6708: spectra of the tentative detections of 22 GHz
H2O (top; Parkes 1997) and 86 GHz SiO (middle; SEST) maser emission. The
boldfaced curves are the spectra smoothed by a Gaussian of |
| Open with DEXTER | |
H2O maser emission was tentatively detected (Fig. 6, top panel) at 22 GHz
at Parkes (1997 run), centred at
![]() kms-1. The peak has a
FWHM of
kms-1. The peak has a
FWHM of ![]() 5 kms-1. The integrated flux of the emission is 0.11 Jy km
s-1, corresponding to a photon flux of
1.7 1044 s-1. It is
not certain whether the 22 GHz peak corresponds to the stellar velocity, or
whether the OH and H2O masers refer to the same source. The 86 GHz SiO
maser spectrum (Fig. 6, middle panel) is noisy, but there is positive signal
(integrated flux
5 kms-1. The integrated flux of the emission is 0.11 Jy km
s-1, corresponding to a photon flux of
1.7 1044 s-1. It is
not certain whether the 22 GHz peak corresponds to the stellar velocity, or
whether the OH and H2O masers refer to the same source. The 86 GHz SiO
maser spectrum (Fig. 6, middle panel) is noisy, but there is positive signal
(integrated flux ![]() 0.11 Jy kms-1) within 1 kms-1 of the H2O
maser peak, and some spikes within the velocity range of the OH emission.
0.11 Jy kms-1) within 1 kms-1 of the H2O
maser peak, and some spikes within the velocity range of the OH emission.
This star is ![]()
![]() W of an H II region (DEM L275 & 277).
W of an H II region (DEM L275 & 277).
No H2O maser emission could be positively detected. To date, no circumstellar maser emission has been detected from any source in the SMC.
This star is a late-M type LPV of
![]() mag (Wood et al. 1992;
Groenewegen & Blommaert 1998). Castilho et al. (1998) measure some
Li-enhancement. Their data suggest that the stellar photosphere is only mildly
metal-poor - quite surprising for a star in the SMC. An H I shell
(#157 in Staveley-Smith et al. 1997) is located at
mag (Wood et al. 1992;
Groenewegen & Blommaert 1998). Castilho et al. (1998) measure some
Li-enhancement. Their data suggest that the stellar photosphere is only mildly
metal-poor - quite surprising for a star in the SMC. An H I shell
(#157 in Staveley-Smith et al. 1997) is located at ![]()
![]() and
and
![]() 156 kms-1.
156 kms-1.
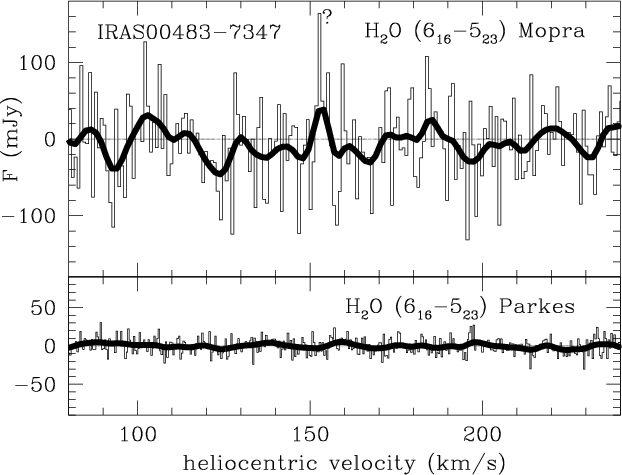 |
Figure 7:
IRAS 00483-7347: Mopra & Parkes (2000) 22 GHz spectra. The
velocities are heliocentric. The boldfaced curves are the spectra smoothed by
a Gaussian of
|
| Open with DEXTER | |
A 3-![]() peak (
peak (![]() 150 mJy) at
150 mJy) at
![]() kms-1 in the
22 GHz spectrum with Mopra could not be confirmed with Parkes (Fig. 7). It
would coincide with the maximum optical depth of the self-absorbed 21 cmH
I (ATCA+Parkes) at
kms-1 in the
22 GHz spectrum with Mopra could not be confirmed with Parkes (Fig. 7). It
would coincide with the maximum optical depth of the self-absorbed 21 cmH
I (ATCA+Parkes) at
![]() kms-1 (Stanimirovic
et al. 1999).
kms-1 (Stanimirovic
et al. 1999).
This source is in the IRAS-FSC rather than the IRAS-PSC. The mid-IR flux
densities were determined by Groenewegen & Blommaert (1998). It coincides
with the extended source IRAS 0048-731, which may be identified with the H
II region LHA 115-N 36 and an H I shell (#156 in Staveley-Smith
et al. 1997). The most plausible counterpart of the IRAS point source is
GM103, a luminous late-M type AGB star (Groenewegen & Blommaert 1998) from
which 10 ![]() m silicate dust emission was detected by Groenewegen et al. (1995). An emission-line star (#368 in Meyssonnier & Azzopardi 1993) and a
carbon star (#323 in Rebeirot et al. 1993) are
m silicate dust emission was detected by Groenewegen et al. (1995). An emission-line star (#368 in Meyssonnier & Azzopardi 1993) and a
carbon star (#323 in Rebeirot et al. 1993) are ![]()
![]() away.
away.
This is a luminous M5e-type Li-enhanced variable AGB star (Wood et al. 1983;
Whitelock et al. 1989; Smith et al. 1995; Zijlstra et al. 1996; van Loon et al. 1998a; Groenewegen & Blommaert 1998), located ![]()
![]() from the
centre of an H I shell (#369 in Staveley-Smith et al. 1997).
from the
centre of an H I shell (#369 in Staveley-Smith et al. 1997).
No 43 GHz SiO masers were found in any of these objects, but at rather high detection thresholds. No other radio observations were made.
This source is associated with the H II region DEM L2 (LHA 120-N77D).
The extremely red mid-IR colour suggests that this is a (compact) H II region.
This source is associated with the Wolf Rayet star HD 32014 in/and the cluster NGC 1748, situated in the complex H II region DEM L22.
This source is located in the open cluster IC 2116 that contains other (early-type) evolved stars and that is embedded in the H II region LHA 120-N 11A (Parker et al. 1992; Rosado et al. 1996).
This luminous IR object is in a region of high stellar and nebular density
(LHA 120-N 120: Laval et al. 1992). Loup et al. (1997) identify the IRAS
point source with the WC star HD 35517 (#559 in Bohannan & Epps 1974; see
also Laval et al. 1994). Within ![]()
![]() are a multiple system (IDS
05201-6945) containing a B0 Iab supergiant, and an emission-line star (#560
in Bohannan & Epps 1974).
are a multiple system (IDS
05201-6945) containing a B0 Iab supergiant, and an emission-line star (#560
in Bohannan & Epps 1974).
This is associated with the H II region LHA 120-N 57A.
| IRAS-PSC | OH alone | OH + SiO/H2O | LR-1992 | ||
|
|
|||||
| 04407-7000 | - | 239 | - | - | [250, 255] |
| 04545-7000 | (8) | 266 | - | - | [245, 250] |
| 04553-6825 | 7 | 260 | 26 | 278 | [280, 285] |
| 05216-6753 | - | - | - | 284 | [295, 300] |
| 05280-6910 | 17 | 272 | 17 | 272 | [270, 275] |
| 05298-6957 | 11 | 282 | - | - | [265, 270] |
| 05329-6708 | 11 | 312 | (44) | (347) | [300, 305] |
| 05402-6956 | 11 | 272 | - | - | [260, 265] |
The presently available data on the stellar and outflow velocities of OH/IR stars in the MCs are summarised in Table 5. Literature values are largely based on the OH maser emission profile alone. The listed expansion velocities in that case are derived from the separation of the strongest peaks in the blue- and red-shifted emission components, respectively. Some authors use instead the maximum extension of the emission (rather than the peaks) as a measure for the expansion velocity (e.g. Zijlstra et al. 1996). Groenewegen et al. (1998) compare expansion velocities derived from the OH peaks with those derived from the width of the thermal CO emission and find that the former are on average smaller by a factor 1.12 (see also Lewis 1991). In some cases for which additional SiO and/or H2O maser emission was discovered, the OH masers appear to represent the part of the CSE in front of the star. Hence the outflow velocities may have been severely underestimated. Revised values are listed, using the OH peak velocities in relation to other maser peaks. The interpretation of the maser emission from IRAS 05329-6708, and hence its stellar and expansion velocities, is rather uncertain.
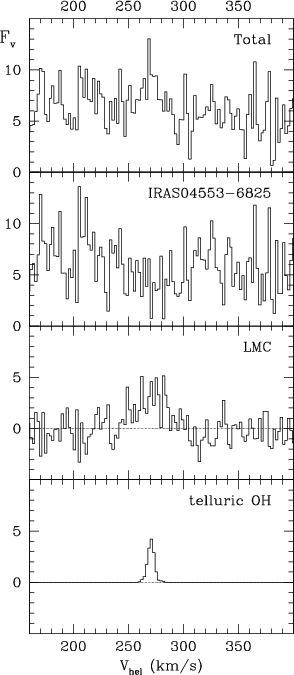
The velocities of the OH/IR stars may be compared with the velocity of the local ISM. Luks & Rohlfs (1992) present a low spatial resolution map of 21 cm H I velocities for the LMC disk, from which approximate heliocentric velocities are listed in Table 5. Kim et al. (1999) present a high spatial resolution map of 21 cmH I velocities, from which nine individual spectra centred on and around the position of each OH/IR star are extracted and averaged (Fig. 8).
There is good agreement between the radio H I emission and the H![]() emission around IRAS 04553-6825 (Fig. B.1). Both agree with its SiO and
H2O maser velocities, as is to be expected for such a massive RSG. The
H2O maser emission from IRAS 05216-6753 provides for the first time a
radial stellar velocity for this heavily obscured object, consistent with the
local H I velocity. The H2O maser emission from IRAS 05280-6910
peaks at the OH 1612 MHz centroid. Its stellar radial velocity deviates
significantly from the bulk of the H I emission, with which the OH 1665
MHz emission is associated. The H2O maser in IRAS 05329-6708 suggests an
exceptionally high stellar velocity. It is seen projected on LMC4 (Meaburn
1980), a supergiant shell aged
emission around IRAS 04553-6825 (Fig. B.1). Both agree with its SiO and
H2O maser velocities, as is to be expected for such a massive RSG. The
H2O maser emission from IRAS 05216-6753 provides for the first time a
radial stellar velocity for this heavily obscured object, consistent with the
local H I velocity. The H2O maser emission from IRAS 05280-6910
peaks at the OH 1612 MHz centroid. Its stellar radial velocity deviates
significantly from the bulk of the H I emission, with which the OH 1665
MHz emission is associated. The H2O maser in IRAS 05329-6708 suggests an
exceptionally high stellar velocity. It is seen projected on LMC4 (Meaburn
1980), a supergiant shell aged ![]() 107yr, and peculiar velocities are not
surprising: high-velocity H2O masers are also found in 30 Doradus (van Loon
& Zijlstra 2000). Although most supergiants in the same (projected) region
have stellar velocities similar to the centre velocity of the OH profile
(Prévot et al. 1989), a few stars are found with radial velocities
107yr, and peculiar velocities are not
surprising: high-velocity H2O masers are also found in 30 Doradus (van Loon
& Zijlstra 2000). Although most supergiants in the same (projected) region
have stellar velocities similar to the centre velocity of the OH profile
(Prévot et al. 1989), a few stars are found with radial velocities
![]() 350 kms-1 (Fehrenbach & Duflot 1982).
350 kms-1 (Fehrenbach & Duflot 1982).
Most OH/IR stars in the LMC follow the kinematics of the gas - in particular
the AGB stars IRAS 04545-7000, IRAS 05298-6957 and IRAS 05402-6956. As the
referee pointed out, this is remarkable because Galactic AGB stars show a
large velocity spread. The observation that the velocities of the OH/IR stars
in the LMC do not generally deviate (much) from the motion of the gas may be
due to the fact that the OH/IR stars are relatively massive. Even the AGB
stars amongst them probably have initial masses
![]() ,
otherwise they would have become carbon stars (Wood 1998; van Loon
et al. 2000), and their ages are
,
otherwise they would have become carbon stars (Wood 1998; van Loon
et al. 2000), and their ages are
![]() Myr. If they have formed in the
disk of the LMC, they may still trace its rotation.
Myr. If they have formed in the
disk of the LMC, they may still trace its rotation.
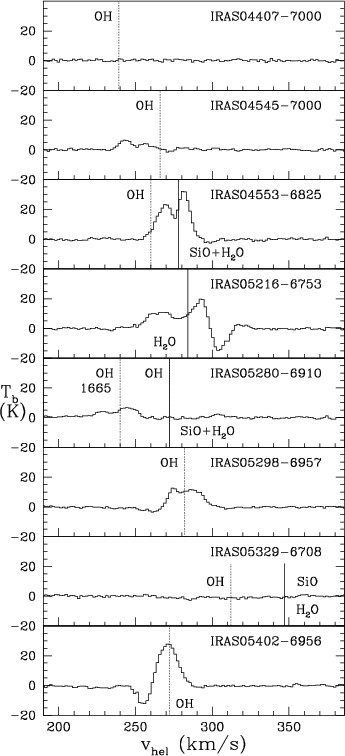 |
Figure 8: 21 cmH I spectra, constructed by averaging nine spectra from Kim et al. (1999) centred on and around the position of each OH/IR star. The stellar velocities are indicated as a vertical line (solid: SiO and/or H2O; dotted: 1612 MHz OH) |
| Open with DEXTER | |
The H2O maser emission from IRAS 04553-6825 (Fig. 2), with its double
blue-shifted emission peaks, reveals important information about the
acceleration of the outflow. In first instance only the central main peak of
H2O maser emission was discovered (van Loon et al. 1998b). Although most
(circum-)stellar and maser properties of IRAS 04553-6825 are virtually
identical to those of NML Cyg, a Galactic RSG (Morris & Jura 1983; van Loon
et al. 1998b), the H2O maser emission from NML Cyg (Richards et al. 1996)
nearly entirely arises from a bright double peaked structure at blue-shifted
velocities indicating outflow velocities in the H2O masing region of
![]() 15 kms-1 - a main peak of H2O maser emission centred at the
stellar velocity has only occasionally been reported for NML Cyg. Comparison
with its OH maser emission indicative of outflow velocities of
15 kms-1 - a main peak of H2O maser emission centred at the
stellar velocity has only occasionally been reported for NML Cyg. Comparison
with its OH maser emission indicative of outflow velocities of ![]() 27 km
s-1 led to the interpretation of the H2O masing region in NML Cyg to
be located in the accelerating part of the outflow where the matter has not
yet reached the local escape velocity (Richards et al. 1996). The detection
of similar blue-shifted H2O maser emission from IRAS 04553-6825 now for
the first time also allows us to measure the acceleration of the outflow for
this metal-poor RSG in the LMC.
27 km
s-1 led to the interpretation of the H2O masing region in NML Cyg to
be located in the accelerating part of the outflow where the matter has not
yet reached the local escape velocity (Richards et al. 1996). The detection
of similar blue-shifted H2O maser emission from IRAS 04553-6825 now for
the first time also allows us to measure the acceleration of the outflow for
this metal-poor RSG in the LMC.
The main H2O maser peak in IRAS 04553-6825 was interpreted by van Loon
et al. (1998b) either (i) to be radially beamed and hence indicate very low
outflow velocities of ![]() 1 kms-1 in a dust-free inner CSE, or (ii) to
be tangentially beamed and centred at the stellar velocity. The detection of
the blue-shifted H2O maser emission now strongly favours the latter. The
blue-shifted maser peaks suggest the emission is radially beamed and thus
measures the radial outflow velocity of the material expelled from the star,
in the region where the dust formation is thought to take place. Material is
accelerated from 18 kms-1 in the H2O masing zone to 26 km
s-1 in the OH masing zone. The duplicity of both the H2O and OH
blue-shifted emission suggests a second kinematic component in the CSE,
accelerating from 13 (H2O) to 14 (OH) kms-1. This slower component
may be closer to the star as suggested by the relatively stronger mainline OH 1665 MHz maser emission from that component (Wood et al. 1992). It is
remarkable that the OH 1665 MHz emission profile is broader than that of the
OH 1612 emission, a phenomenon that is attributed to either (or a combination
of) Zeeman broadening, clumpiness, velocity fluctuations or axi-symmetric
winds (Sivagnanam & David 1999).
1 kms-1 in a dust-free inner CSE, or (ii) to
be tangentially beamed and centred at the stellar velocity. The detection of
the blue-shifted H2O maser emission now strongly favours the latter. The
blue-shifted maser peaks suggest the emission is radially beamed and thus
measures the radial outflow velocity of the material expelled from the star,
in the region where the dust formation is thought to take place. Material is
accelerated from 18 kms-1 in the H2O masing zone to 26 km
s-1 in the OH masing zone. The duplicity of both the H2O and OH
blue-shifted emission suggests a second kinematic component in the CSE,
accelerating from 13 (H2O) to 14 (OH) kms-1. This slower component
may be closer to the star as suggested by the relatively stronger mainline OH 1665 MHz maser emission from that component (Wood et al. 1992). It is
remarkable that the OH 1665 MHz emission profile is broader than that of the
OH 1612 emission, a phenomenon that is attributed to either (or a combination
of) Zeeman broadening, clumpiness, velocity fluctuations or axi-symmetric
winds (Sivagnanam & David 1999).
The kinematic data for the CSE of IRAS 04553-6825 are very similar to the
kinematics in the CSE of NML Cyg, suggesting that the outflow kinematics
including the acceleration mechanism does not depend on metallicity. Other
data, however, seem to support theoretical expectations of lower velocities in
CSEs of lower metallicity (van Loon 2000). One way to reconcile both views is
if the distance to NML Cyg were ![]() 1.3 kpc rather than 2 kpc: the outflow
velocity scales with metallicity Z and luminosity L as
1.3 kpc rather than 2 kpc: the outflow
velocity scales with metallicity Z and luminosity L as
![]() (van Loon 2000) with
(van Loon 2000) with ![]() for NML Cyg (solar) and
for NML Cyg (solar) and
![]() for IRAS 04553-6825 (van Loon et al. 1998b and Appendix B).
for IRAS 04553-6825 (van Loon et al. 1998b and Appendix B).
The velocity range over which SiO maser emission is seen from IRAS 04553-6825
covers the entire velocity range of the H2O maser emission. If the strong
double peak of SiO maser emission is tangentially beamed then the velocity
separation might imply a rotational velocity component of the inner CSE. If
the double SiO peak is radially beamed, however, then it suggests moderate
outflow velocities in the dust-free inner CSE of ![]() 4 kms-1. In any
case, the simultaneous presence of SiO emission over a large velocity extent
and strong discrete peaks of SiO emission indicate that the velocity field of
the inner CSE is highly complex.
4 kms-1. In any
case, the simultaneous presence of SiO emission over a large velocity extent
and strong discrete peaks of SiO emission indicate that the velocity field of
the inner CSE is highly complex.
Results from echelle spectroscopic observations of IRAS 04553-6825 in the 0.6
to 0.9 ![]() m region that generally support the kinematic picture for the CSE
of this star are described in Appendix B.
m region that generally support the kinematic picture for the CSE
of this star are described in Appendix B.
The H2O maser emission from IRAS 05280-6910 essentially shows the same
features as seen in IRAS 04553-6825, and thus carries the same potential for
analysing the kinematics of its CSE: the narrow main peak is interpreted as
tangentially beamed radiation centred at the stellar velocity, and the
blue-shifted emission (in the case of IRAS 05280-6910 probably its
red-shifted counterpart is seen as well) can be explained as radially beamed
radiation indicating the radial outflow velocity in the H2O masing region
of the CSE close to the region of dust formation. The outflow in the CSE of
IRAS 05280-6910 is being accelerated from ![]() 6 kms-1 in the H2O
masing region to
6 kms-1 in the H2O
masing region to ![]() 17 kms-1 in the outer CSE from where the OH 1612
MHz maser emission arises.
17 kms-1 in the outer CSE from where the OH 1612
MHz maser emission arises.
Double-peaked red-shifted SiO emission may have been detected, with equal velocity separation but slightly larger receding velocities than the red-shifted OH emission. This suggests that material in the dust-free inner CSE may exhibit a wide range of velocities, possibly exceeding the final wind velocity (Cernicharo et al. 1997).
Expansion velocities from the separation of the two OH peaks versus maximum
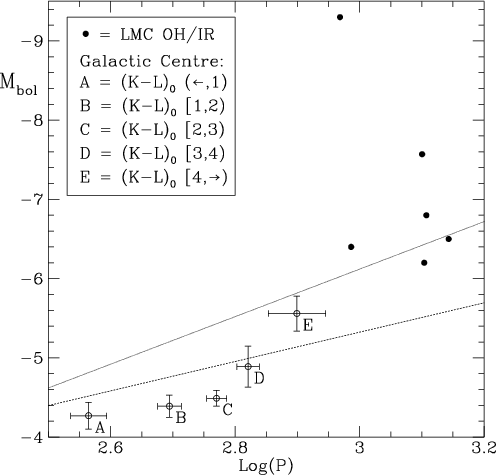
peak flux density are plotted in Fig. 9 for the OH/IR stars in the Galactic
Centre from Lindqvist et al. (1992a) and Sjouwerman et al. (1998), after
scaling their flux densities from the distance of the Galactic Centre to the
distance of the LMC. Also plotted are the expansion velocities for the OH/IR
stars in the LMC, as derived from the combination of all detected maser peaks.
Expansion velocities tend to be below average for the brightest OH sources.
For the LMC sources the statistics are very poor, with only one
well-determined expansion velocity for an AGB star (IRAS 05298-6957)
suggestive of smaller expansion velocities at lower metallicity (see also Wood
et al. 1992; Zijlstra et al. 1996; van Loon 2000). The new maser data
presented here for IRAS 05329-6708, however, suggest that this source may
exhibit an exceptionally large expansion velocity even when compared to the
expansion velocities of Galactic post-AGB objects (Zijlstra et al. 2000).
Disregarding IRAS 04553-6825 and IRAS 05329-6708, the average expansion
velocity of the remaining four LMC objects is
![]() kms-1, which
may be compared to
kms-1, which
may be compared to
![]() kms-1 of the six brightest OH masers in
the Galactic Centre. Hence the expansion velocity of bright OH sources in the
LMC is
kms-1 of the six brightest OH masers in
the Galactic Centre. Hence the expansion velocity of bright OH sources in the
LMC is ![]() 20% lower than that of similarly bright OH masers in the
Galactic Centre, but the data is also consistent with no difference in
expansion velocity.
20% lower than that of similarly bright OH masers in the
Galactic Centre, but the data is also consistent with no difference in
expansion velocity.
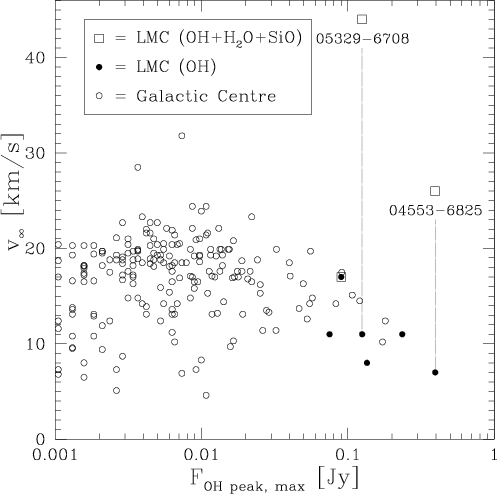 |
Figure 9: Expansion velocities of the circumstellar shells derived from the separation of the OH maser peaks, versus the flux density of the brightest OH maser peak (at the LMC distance). Expansion velocities derived from the combination of all detected masers are given too for the LMC sources (squares) |
| Open with DEXTER | |
In the Galactic Centre, unlike the 13 SiO masers (Lindqvist et al. 1991) that peak within a few kms-1 of the mid-velocity of the OH peaks - i.e. centred at the stellar velocity - the H2O detections (Lindqvist et al. 1990) peak at or very near the OH peak velocities. This suggests that the wind has already (nearly) reached its terminal velocity before leaving the H2O masing zone. In three out of four cases the blue-shifted H2O peak is (much) brighter than the red-shifted peak. H2O masers in the LMC, however, peak at the stellar velocity indicated by the centroid of the SiO maser emission, rather than at (one of) the OH maser peak(s). Secondary H2O peaks suggest that the wind must still experience substantial acceleration after leaving the H2O masing zone. This may be understood by a less efficient acceleration in the H2O masing zone of low-metallicity CSEs, which results in a stellar wind that is still being accelerated upon entering the OH masing zone. This could cause multiple, thin OH masing shells to give rise to the rather irregular OH emission profiles as observed in the LMC.
All masers observed in the LMC are blue-asymmetric in the sense that the
masing material approaching Earth (after correcting for the stellar velocity
with respect to Earth) appears brighter than the receding matter (Fig. 10):
the OH, H2O and SiO maser emission from IRAS 04553-6825, the OH and H2O
maser emission from IRAS 05280-6910, the OH maser emission from all four AGB
stars detected by Wood et al. (1992) - if interpreting IRAS 05329-6708 in
combination with the tentative H2O maser detection - and possibly also
the single-peaked OH maser emission from IRAS 04407-7000. Does this reflect
outflow complexity (Zijlstra et al. 2000), or is it merely due to the origin
and propagation of the amplified radiation field? Blue-asymmetric emission
profiles (Norris et al. 1984; Sivagnanam et al. 1990) arise if the
(radially-beamed) masers amplify stellar light or free-free emission from the
inner part of the CSE, rather than radiation from the dusty CSE, and/or the
receding maser spots are occulted by the star or an optically thick
free-electron reservoir.
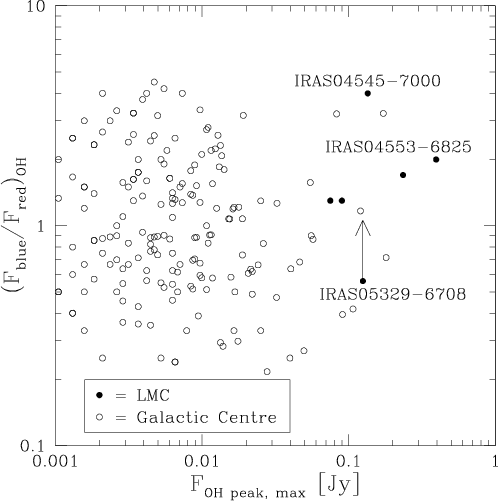 |
Figure 10: Ratio of the flux densities of the blue- and red-shifted OH maser peaks, versus the flux density of the brightest OH maser peak (at the LMC distance) |
| Open with DEXTER | |
The blue asymmetry is expected to be more pronounced in RSGs such as IRAS 04553-6825 than in AGB stars such as IRAS 05298-6957, because (i) at mm wavelengths, the ratio of stellar light to CSE radiation is larger for RSGs than for more compact AGB stars that have optically thicker CSEs (van Loon 2000), and (ii) RSGs are generally warmer than AGB stars and hence the free-electron abundance is higher around RSGs. The blue asymmetry may be more pronounced at lower metallicity, because (i) at mm wavelengths, the ratio of stellar light to CSE radiation is smaller because of the lower dust-to-gas ratio, and (ii) the free-electron abundance is higher due to the warmer photospheres of low-metallicity stars.
The OH masers in the LMC have large photon fluxes compared to what is typical
for the Galactic Centre (see Fig. 9), where the OH luminosity function peaks
at
2.5 1043 s-1 (Sjouwerman et al. 1998). The OH maser
emission from IRAS 04553-6825 is ![]() 100 times brighter (and so is NML Cyg,
a very similar RSG in the Milky Way). The sixth brightest maser in the
Galactic Centre is equally bright as the sixth brightest maser in the LMC,
which suggests that a similar number of intermediate-age stars exist in the
Galactic Centre and in the LMC. Saturated OH masers have flux densities
100 times brighter (and so is NML Cyg,
a very similar RSG in the Milky Way). The sixth brightest maser in the
Galactic Centre is equally bright as the sixth brightest maser in the LMC,
which suggests that a similar number of intermediate-age stars exist in the
Galactic Centre and in the LMC. Saturated OH masers have flux densities
![]() .
Although the detected OH
masers in the Magellanic AGB stars meet the saturation criterion within a
factor
.
Although the detected OH
masers in the Magellanic AGB stars meet the saturation criterion within a
factor ![]() 2, the detected OH masers in the two Magellanic RSGs are an order
of magnitude below the saturation level.
2, the detected OH masers in the two Magellanic RSGs are an order
of magnitude below the saturation level.
The deepest search for OH sources in the LMC has been performed with a
detection limit of ![]() 50 mJy, and several single-peaked sources were found,
including IRAS 04407-7000 (van Loon et al. 1998a). A flux density of 50 mJy
from the LMC corresponds to 2 Jy from the Galactic Centre. Of the 134 double
and 16 single-peaked OH sources in Lindqvist et al. (1992a), only 12 have
maximum flux densities >2 Jy. Out of these 12 sources, 8 would appear as a
single peak. Hence, when searching for OH masers close to the detection limit,
one is likely to find more single than double-peaked sources.
50 mJy, and several single-peaked sources were found,
including IRAS 04407-7000 (van Loon et al. 1998a). A flux density of 50 mJy
from the LMC corresponds to 2 Jy from the Galactic Centre. Of the 134 double
and 16 single-peaked OH sources in Lindqvist et al. (1992a), only 12 have
maximum flux densities >2 Jy. Out of these 12 sources, 8 would appear as a
single peak. Hence, when searching for OH masers close to the detection limit,
one is likely to find more single than double-peaked sources.
Many of the 1612 MHz peaks of van Loon et al. (1998a) could not be identified with IR-bright point sources associated with CSEs around evolved stars. Interestingly, none of the Galactic Centre OH sources with maximum flux densities >2 Jy were recovered in the near-IR by Wood et al. (1998), who did identify a number of the fainter Galactic Centre OH sources with near-IR objects. Only two of these bright OH sources are identified with IRAS point sources (Appendix C).
Amongst the LPVs with known pulsation periods and bolometric magnitudes from
Wood et al. (1998) the fraction of stars with detected OH emission incre0ases
with redder (K-L)0: 0.22, 0.77, 0.90, 0.95 and 1.00 for colour bins
![]() ,
[1,2], [2,3], [3,4] and
,
[1,2], [2,3], [3,4] and
![]() mag,
respectively. No OH masers are detected from LPVs with
mag,
respectively. No OH masers are detected from LPVs with
![]() d. The OH/IR
stars in the LMC all have periods
d. The OH/IR
stars in the LMC all have periods
![]() d, but their colours are
with
d, but their colours are
with
![]() mag not extremely red (Trams et al. 1999) due to the low
dust content as a result of a low metallicity.
mag not extremely red (Trams et al. 1999) due to the low
dust content as a result of a low metallicity.
Lindqvist et al. (1990) detected 22 GHz H2O maser emission from 4 out of
33 OH sources in the Galactic Centre. Their detections typically have peak
flux densities of 0.5 to 1 Jy, corresponding to ![]() 20 mJy if the sources
were at the distance of the LMC. The 3-
20 mJy if the sources
were at the distance of the LMC. The 3-![]() upper limits for their
non-detections correspond to
upper limits for their
non-detections correspond to ![]() 10 mJy at the distance of the LMC, which is
comparable to the sensitivity of our search for H2O maser emission from
Magellanic sources. Of the 13 Magellanic IRAS sources that were observed at 22
GHz, four were detected. Three of the IRAS-PSC identifications with OH masers
in the Galactic Centre (Table C.1) were observed at 22 GHz: OH359.675+0.069
and OH359.946-0.047 were detected (both identified with near-IR LPVs), but
the bright OH maser OH359.762+0.120 (for which no near-IR counterpart has
been identified) was not detected. Lewis (1998) already remarked that 22 GHz
detection rates are always <100% (namely,
10 mJy at the distance of the LMC, which is
comparable to the sensitivity of our search for H2O maser emission from
Magellanic sources. Of the 13 Magellanic IRAS sources that were observed at 22
GHz, four were detected. Three of the IRAS-PSC identifications with OH masers
in the Galactic Centre (Table C.1) were observed at 22 GHz: OH359.675+0.069
and OH359.946-0.047 were detected (both identified with near-IR LPVs), but
the bright OH maser OH359.762+0.120 (for which no near-IR counterpart has
been identified) was not detected. Lewis (1998) already remarked that 22 GHz
detection rates are always <100% (namely, ![]() 80%), and even some bright
OH sources are undetected at 22 GHz. He suggests that this may be due to the
absence of density enhancements ("blobs'') or an unfavourable orientation of
a bipolar geometry. Hence, not all Magellanic OH/IR stars should be expected
to exhibit (strong) H2O masers. Significant mass loss is required for the
presence of circumstellar H2O masers, though: AGB stars with modest mass
loss are far below the sensitivity of both the Magellanic and Galactic Centre
22 GHz surveys (see Appendix A).
80%), and even some bright
OH sources are undetected at 22 GHz. He suggests that this may be due to the
absence of density enhancements ("blobs'') or an unfavourable orientation of
a bipolar geometry. Hence, not all Magellanic OH/IR stars should be expected
to exhibit (strong) H2O masers. Significant mass loss is required for the
presence of circumstellar H2O masers, though: AGB stars with modest mass
loss are far below the sensitivity of both the Magellanic and Galactic Centre
22 GHz surveys (see Appendix A).
The ratio of H2O and OH photon fluxes is ![]() 0.1 to 1, and the ratio of
H2O and OH peak flux densities is
0.1 to 1, and the ratio of
H2O and OH peak flux densities is ![]() 1, both for the Galactic Centre as
well as the LMC masers. At lower metallicities the CSEs are optically thinner
and provide less self-shielding from the interstellar UV radiation field, and
hence H2O may be expected to be dissociated over a larger extent of CSEs in
the LMC compared to those in the Galactic Centre (Huggins & Glassgold 1982),
thus yielding relatively faint H2O maser emission compared to the OH maser
emission. The fact that no difference is seen between these relative
intensities in the LMC and the Galactic Centre suggests that the effect of
stronger dissociation might be cancelled by the effect of longer coherent
paths throughout the more slowly accelerating wind in lower metallicity CSEs.
1, both for the Galactic Centre as
well as the LMC masers. At lower metallicities the CSEs are optically thinner
and provide less self-shielding from the interstellar UV radiation field, and
hence H2O may be expected to be dissociated over a larger extent of CSEs in
the LMC compared to those in the Galactic Centre (Huggins & Glassgold 1982),
thus yielding relatively faint H2O maser emission compared to the OH maser
emission. The fact that no difference is seen between these relative
intensities in the LMC and the Galactic Centre suggests that the effect of
stronger dissociation might be cancelled by the effect of longer coherent
paths throughout the more slowly accelerating wind in lower metallicity CSEs.
Lindqvist et al. (1991) detected 43 GHz SiO maser emission from 13 out of 31
OH sources in the Galactic Centre, peaking at
![]() Jy (
Jy (![]() 30 mJy
at the LMC). Upper limits for the photon rates of Galactic non-detections at
43 GHz were a few 1044 s-1. The upper limits for LMC sources using
the Parkes dish are a few dozen times brighter and thus not very useful. None
of the Galactic Centre 43 GHz masers could be detected at 86 GHz down to
typical photon rates
30 mJy
at the LMC). Upper limits for the photon rates of Galactic non-detections at
43 GHz were a few 1044 s-1. The upper limits for LMC sources using
the Parkes dish are a few dozen times brighter and thus not very useful. None
of the Galactic Centre 43 GHz masers could be detected at 86 GHz down to
typical photon rates ![]() 1044 s-1. This is similar to the SEST
limits for LMC sources and thus explains the difficulty in detecting 86 GHz
masers in the LMC.
1044 s-1. This is similar to the SEST
limits for LMC sources and thus explains the difficulty in detecting 86 GHz
masers in the LMC.
Two of the Galactic Centre OH masers with IRAS-PSC identifications (Table C.1)
were observed at 43 GHz, and both were detected (OH359.675+0.069 and
OH359.762+0.120). Three Galactic Centre H2O masers were observed at 43
GHz, of which two were detected (including OH359.675+0.069). In the LMC too,
the brightest (circumstellar) H2O masers are also the brightest SiO masers.
However, some quite bright mid-IR objects could not be detected in any maser
transition - e.g. IRAS 05346-6949.
| |
Figure 11:
Detection fraction for SiO
|
| Open with DEXTER | |
SiO maser emission may be detected from IR objects with pulsation periods
![]() d, and it is always present when
d, and it is always present when
![]() d (Fig. 11). The OH/IR
stars in the LMC all have
d (Fig. 11). The OH/IR
stars in the LMC all have
![]() d and are thus expected to exhibit SiO
maser emission, probably not much below the sensitivity limits of our
searches. With
d and are thus expected to exhibit SiO
maser emission, probably not much below the sensitivity limits of our
searches. With
![]() mag their 86 GHz SiO maser emission is expected
to be similarly bright as their 43 GHz masers (Nyman et al. 1993). Lindqvist
et al. (1991) find that for Miras - probably the progenitors of OH/IR stars
- the SiO masers can often be 102 times as intense as the OH masers. OH
luminosities scale with 35
mag their 86 GHz SiO maser emission is expected
to be similarly bright as their 43 GHz masers (Nyman et al. 1993). Lindqvist
et al. (1991) find that for Miras - probably the progenitors of OH/IR stars
- the SiO masers can often be 102 times as intense as the OH masers. OH
luminosities scale with 35 ![]() m luminosities, and OH outflow velocities
reach a maximum for OH/IR stars (Sivagnanam et al. 1989), indicating that
OH/IR stars experience stronger mass outflows than Miras. The ratio of SiO and
OH photon fluxes (or peak flux densities) is about unity both for the Galactic
Centre and LMC sources, which suggests that also in the LMC the brightest OH
masers are already experiencing heavy mass loss for some time.
m luminosities, and OH outflow velocities
reach a maximum for OH/IR stars (Sivagnanam et al. 1989), indicating that
OH/IR stars experience stronger mass outflows than Miras. The ratio of SiO and
OH photon fluxes (or peak flux densities) is about unity both for the Galactic
Centre and LMC sources, which suggests that also in the LMC the brightest OH
masers are already experiencing heavy mass loss for some time.
| Star | K | N | SiO | ||
| LMC masers | |||||
| IRAS 04407-7000 | 9.05 | 1.40 | 5.03 | <0.35 | |
| IRAS 04553-6825 | 6.99 | 0.30 | 1.74 | 0.15 | |
| IRAS 05216-6753 | 10.38 | 0.20 | 2.43 | <0.28 | |
| IRAS 05280-6910 | 8.19 | 2.41 | (0.30) | ||
| IRAS 05298-6957 | 10.29 | 2.00 | 4.14 | <0.29 | |
| IRAS 05329-6708 | 9.87 | 1.90 | 3.81 | (0.12) | |
| Milky Way masers | |||||
| IRAS 00193-4033 | 3.28 | 1.30 | -1.61 | 1.04 | 23 |
| IRAS 22231-4529 | 3.11 | 1.09 | -0.55 | 0.82 | 12 |
| IRC-30100 | 1.79 | 0.27 | 34 | ||
| IRC-30050 | 2.55 | 0.67 | 11 | ||
| IRC-20540 | 2.21 | 0.99 | 10 | ||
| IRC-20197 | 2.49 | 1.26 | -2.42 | 1.30 | 45 |
| IRC-10529 | 2.33 | 1.50 | -3.31 | 2.85 | 53 |
| IRC+10011 | 2.47 | 1.79 | -3.00 | 1.70 | 66 |
| IRC+10523 | 1.85 | 1.07 | 10 | ||
| NML Cyg | 0.60 | 0.51 | -5.30 | 0.51 | 42 |
| NML Tau | -0.68 | 1.09 | 350 | ||
| OH 02.60-0.4 | 3.42 | 1.52 | 27 | ||
| OH 26.5+0.6 | 8.55 | 3.27 | 5 | ||
| OH 285.05+0.07 | 5.32 | 1.50 | -0.12 | 1.27 | 4 |
| OH 286.50+0.06 | 5.27 | 1.41 | -0.43 | 1.27 | 12 |
| OH 300.93-0.03 | 4.95 | 1.20 | 2 | ||
| OH 315.22+0.01 | 5.87 | 1.35 | 4 | ||
| OH 341.12-0.01 | 6.04 | 1.16 | 2 | ||
| OH 342.01+0.25 | 3.90 | 1.21 | 11 | ||
| OH 344.83-1.67 | 7.02 | 1.28 | 2 | ||
| OH 346.86-0.18 | 4.01 | 1.53 | 3 | ||
| OH 349.18+0.20 | 8.34 | 1.64 | 2 | ||
| OH 358.16+0.50 | 3.08 | 1.88 | 10 | ||
| R Aql | -0.70 | 0.58 | -2.40 | 0.51 | 37 |
| R Aqr | -1.09 | 0.81 | -3.58 | 0.70 | 140 |
| RR Aql | 0.50 | 1.12 | -2.40 | 1.08 | 29 |
| S Col | 1.63 | 0.57 | 0.02 | 0.29 | 3 |
| S CrB | 0.10 | 0.81 | -2.50 | 0.58 | 100 |
| U Her | -0.20 | 0.81 | -2.50 | 0.51 | 140 |
| U Ori | -0.60 | 0.90 | -2.70 | 0.58 | 110 |
| VX Sgr | 0.20 | 1.30 | -4.20 | 0.90 | 280 |
| VY CMa | -0.70 | 0.15 | -5.90 | 0.15 | 1700 |
| W Hya | -3.10 | 0.51 | -5.00 | 0.28 | 680 |
Alcolea et al. (1990) found a clear correlation between the visual amplitude
of pulsation and the pumping efficiency of the SiO masers. For our obscured
LMC sources no visual photometric monitoring data is available. It is known,
however, that the SiO maser emission correlates with the IR lightcurve (Nyman
& Olofsson 1986; Alcolea et al. 1999), and hence we investigate here whether
the SiO maser intensity correlates with the IR amplitude. In Table 6 IR
photometric variability data is summarised for relatively nearby stars in the
Milky Way that were monitored by Harvey et al. (1974) and Le Bertre (1993).
The latter source, if available, is preferred because it is more modern by
nearly two decades. Where only narrow-band N1,2,3 was obtained the
broad-band N is approximated by an unweighted average. SiO
![]() peak flux densities were compiled from recent
literature and averaged if more data was available. For the LMC sources
similar data is compiled, but at 10
peak flux densities were compiled from recent
literature and averaged if more data was available. For the LMC sources
similar data is compiled, but at 10 ![]() m too few epochs of measurements
exist to allow an estimate of the amplitude.
m too few epochs of measurements
exist to allow an estimate of the amplitude.
The flux density ratio of the peak of the SiO
![]() and
the stellar flux at 2.2
and
the stellar flux at 2.2 ![]() m increases for larger 2.2
m increases for larger 2.2 ![]() m amplitudes
(Fig. 12). This means that larger amplitudes cause relatively stronger maser
pumping, probably because of the relatively stronger shocks travelling through
the inner dust-free part of the CSE. A similar correlation is found for other
near-IR amplitudes and for integrated fluxes of the SiO maser emission, but
their lower accuracy leads to more scatter. The one secure and two tentative
detections of SiO
m amplitudes
(Fig. 12). This means that larger amplitudes cause relatively stronger maser
pumping, probably because of the relatively stronger shocks travelling through
the inner dust-free part of the CSE. A similar correlation is found for other
near-IR amplitudes and for integrated fluxes of the SiO maser emission, but
their lower accuracy leads to more scatter. The one secure and two tentative
detections of SiO
![]() maser emission in the LMC, as
well as the three useful upper limits are all consistent with SiO
maser emission in the LMC, as
well as the three useful upper limits are all consistent with SiO
![]() masers that are equally strong in the LMC and the Milky Way. Figure 12 suggests
masers that are equally strong in the LMC and the Milky Way. Figure 12 suggests
![]() to 2 mag for IRAS 05280-6910, but the
DENIS K-band magnitude is with 8.195 (Cioni et al. 2000) very similar to the
photometry of Wood et al. (1992).
to 2 mag for IRAS 05280-6910, but the
DENIS K-band magnitude is with 8.195 (Cioni et al. 2000) very similar to the
photometry of Wood et al. (1992).
Interestingly, the flux density ratio of the peak of the SiO
![]() and the stellar flux at 10
and the stellar flux at 10 ![]() m (N-band) is virtually
independent of any near-IR amplitude (Fig. 13; plotted against the amplitude
at 10
m (N-band) is virtually
independent of any near-IR amplitude (Fig. 13; plotted against the amplitude
at 10 ![]() m), and shows rather little scatter. This indicates a close
connection between the shocks that pump the SiO maser, and the dust formation.
It also suggests that both the SiO luminosity and the dust heating have a
common origin, namely the stellar flux. Again, the LMC data (no 10
m), and shows rather little scatter. This indicates a close
connection between the shocks that pump the SiO maser, and the dust formation.
It also suggests that both the SiO luminosity and the dust heating have a
common origin, namely the stellar flux. Again, the LMC data (no 10 ![]() m
amplitudes available) is roughly compatible with the same trend. Thus there is
no strong evidence for a difference in maser strength at LMC metallicities
compared to
m
amplitudes available) is roughly compatible with the same trend. Thus there is
no strong evidence for a difference in maser strength at LMC metallicities
compared to ![]() solar metallicity.
solar metallicity.
| |
Figure 12:
Flux density ratio of SiO
|
| Open with DEXTER | |
| |
Figure 13: Same as Fig. 12, but for the N-band |
| Open with DEXTER | |
A five year effort to search for SiO and H2O maser emission from
circumstellar envelopes in the LMC resulted in:
- The secure detection of 86 GHz SiO
![]() and 22 GHz
H2O
and 22 GHz
H2O
![]() maser emission from the luminous red
supergiant IRAS 04553-6825. The average SiO spectrum of 65 hours worth of
monitoring data shows unprecedented kinematic detail, probably indicating
outflow and/or turbulent motions with
maser emission from the luminous red
supergiant IRAS 04553-6825. The average SiO spectrum of 65 hours worth of
monitoring data shows unprecedented kinematic detail, probably indicating
outflow and/or turbulent motions with
![]() a few kms-1 up
to
a few kms-1 up
to ![]() 18 kms-1 with respect to the stellar velocity. A new, improved
signal-to-noise H2O spectrum also shows emission components at
18 kms-1 with respect to the stellar velocity. A new, improved
signal-to-noise H2O spectrum also shows emission components at
![]() kms-1, that likely correspond to matter that is being further
accelerated before exhibiting OH masers at
kms-1, that likely correspond to matter that is being further
accelerated before exhibiting OH masers at
![]() kms-1;
kms-1;
- The first detection of 22 GHz H2O maser emission from the cluster
supergiant IRAS 05280-6910. It consists of a central emission peak and
additional emission components indicating outflows with
![]() km
s-1, that are accelerated further before reaching the OH masing regions
that expand with
km
s-1, that are accelerated further before reaching the OH masing regions
that expand with
![]() kms-1;
kms-1;
- The tentative detection of 22 GHz H2O maser emission from
IRAS 05216-6753, probably a massive star inside an H II region. No
other masers have been detected;
- The tentative detection of 22 GHz H2O maser emission from the AGB star
IRAS 05329-6708 is puzzling as it suggests an extremely fast outflow of
![]() kms-1;
kms-1;
- Masers in the LMC are generally blue-asymmetric and/or single-peaked. We
propose that this may be due to the amplification of stellar and/or free-free
radiation, rather than dust emission. This may be more pronounced in low
metallicity envelopes due to the low dust content;
- There is weak evidence for the expansion velocities in LMC objects to be
lower than of similar Galactic objects. The data is also consistent with no
difference in expansion velocities, due to the limited sample of LMC objects
with reliable estimates of the expansion velocity. The acceleration through
the CSE also seems to be slower in LMC objects, with the outflow velocity
increasing by a factor of two between the H2O and OH masing zones;
- SiO, H2O and OH maser emission from circumstellar envelopes in the LMC
is found to be equally strong as from similar envelopes in the Milky Way. A
larger IR amplitude of variability leads to an increase in the flux density
ratio of the SiO
![]() peak and the 2.2
peak and the 2.2 ![]() m
continuum, but the flux density ratio of the SiO
m
continuum, but the flux density ratio of the SiO
![]() peak and the 10
peak and the 10 ![]() m spectral region is virtually a constant. This suggests
a close connection between the shocked SiO masing region and the dusty
outflow, which seems to be similar in the Milky Way and in the LMC.
m spectral region is virtually a constant. This suggests
a close connection between the shocked SiO masing region and the dusty
outflow, which seems to be similar in the Milky Way and in the LMC.
Present-day facilities for observing SiO, H2O and OH masers offer an angular resolution and sensitivity capable of detecting only the very brightest masers in the Magellanic Clouds. In the future, ALMA may provide considerably larger samples of Magellanic SiO and H2O masers, but for 1612 MHz OH masers no major improvement is envisaged. Detection of H2O masers in OH/IR stars in the Magellanic Clouds would, in principle, allow to derive the total (gas+dust) mass-loss rates. Comparison of H2O and OH deduced expansion velocities yields the acceleration of the radiation-driven wind, if the location of the H2O and OH masers is known with sufficient accuracy. As the distances and hence the luminosities for these stars are known, the gas-to-dust ratios and total mass-loss rates are derived simultaneously (Netzer & Elitzur 1993).
Acknowledgements
We would like to thank the staff at the SEST, Parkes and Mopra observatories for their kind and helpful support, and in particular Drs. Peter te Lintel Hekkert, Marcus Price and Ian Stewart for help with the 22 GHz observations at Parkes in August 1997. We also thank Dr. Roland Gredel for help with the NTT observations at La Silla in January 1996. We acknowledge the granting of Director's Discretionary Time for obtaining the NTT data. We made use of the SIMBAD database, operated at CDS, Strasbourg, France. We thank the referee Dr. Anders Winnberg for critical comments that helped improve the presentation. Jacco thanks Joana Oliveira for help in reading funny formats of data, improving this manuscript, and much more.
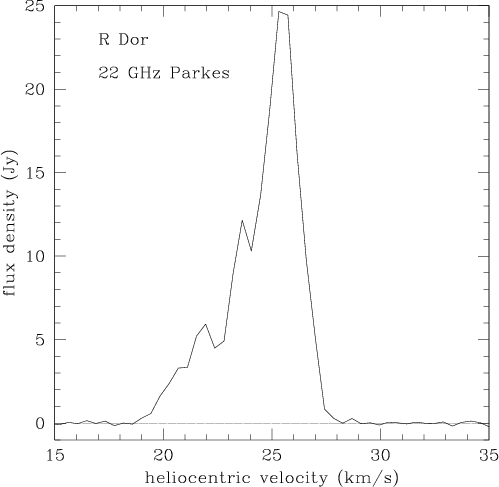 |
Figure A.1: R Doradus: Circumstellar 22 GHz (Parkes 2000) H2O maser emission. The velocities are heliocentric |
R Doradus (IRAS 04361-6210: F12=5157, F25=1594 Jy) is a famous 6th magnitude (V-band) SRb variable AGB star with a period of 338 days and a spectral type M8 IIIe. It is at a distance of only 61 pc, making it the biggest star on the night sky (Bedding et al. 1997 and references therein).
The 22 GHz spectrum with Parkes is presented in Fig. A.1, with an on-source
integration time of 228 seconds resulting in an rms noise of 74 mJy. The
(heliocentric) stellar restframe velocity is at
![]() kms-1. The
blue-asymmetric CO(
kms-1. The
blue-asymmetric CO(
![]() )
line profile indicates an expansion
velocity of
)
line profile indicates an expansion
velocity of
![]() kms-1 (Lindqvist et al. 1992b) and a
mass-loss rate of
kms-1 (Lindqvist et al. 1992b) and a
mass-loss rate of
![]()
![]() yr-1 (Loup et al. 1993).
The H2O maser emission appears red-asymmetric, but as the peak very nearly
coincides with the stellar velocity there is actually more emission at the
blue-shifted rather than at the red-shifted side. Possibly the red-shifted
part of the emission is being occulted by the star. The blue-shifted emission
extends to (blue-shifted) velocities of almost
yr-1 (Loup et al. 1993).
The H2O maser emission appears red-asymmetric, but as the peak very nearly
coincides with the stellar velocity there is actually more emission at the
blue-shifted rather than at the red-shifted side. Possibly the red-shifted
part of the emission is being occulted by the star. The blue-shifted emission
extends to (blue-shifted) velocities of almost ![]() 6 kms-1 with
respect to the stellar restframe. The H2O masers thus seem to trace
material that includes matter that has already nearly reached the final
outflow velocity.
6 kms-1 with
respect to the stellar restframe. The H2O masers thus seem to trace
material that includes matter that has already nearly reached the final
outflow velocity.
R Dor is a good example of an AGB star with moderate mass loss. If placed at
the distance of the LMC, it would have been barely detectable by ISO in the
mid-IR (several mJy), and three orders of magnitude too faint to be detectable
at 22 GHz (few
![]() mJy).
mJy).
The 3.5 m New Technology Telescope (NTT) at the European Southern Observatory
(ESO) at La Silla, Chile, was used on October 7, 1995, and January 7, 1996,
with the ESO Multi-Mode Instrument (EMMI) to obtain echelle spectra of
IRAS 04553-6825. Grating #14 was used with grism #6 as cross disperser in
October, and grism #4 in January, yielding a spectral coverage from 6100 to
8300 Å and from 6000 to 9000 Å, respectively. The slit width and length
were
![]() and
and
![]() in October, and
in October, and
![]() and
and
![]() in January. The total integration
time was 1.5 hr in October, and 1 hr in January. The data were reduced in the
normal way using the Munich Interactive Data Analysis Software (MIDAS)
package. The wavelength calibration was done by taking a ThAr lamp spectrum in
conditions identical to the spectrum of IRAS 04553-6825. The measured
spectral resolving power is
in January. The total integration
time was 1.5 hr in October, and 1 hr in January. The data were reduced in the
normal way using the Munich Interactive Data Analysis Software (MIDAS)
package. The wavelength calibration was done by taking a ThAr lamp spectrum in
conditions identical to the spectrum of IRAS 04553-6825. The measured
spectral resolving power is ![]() 7.5 104 for the spectrum taken in
October, and
7.5 104 for the spectrum taken in
October, and ![]() 4 104 for the January spectrum. The average seeing
was
4 104 for the January spectrum. The average seeing
was ![]()
![]() on both nights.
on both nights.
Our echelle spectra resemble the lower resolution spectrum published by Elias
et al. (1986), confirming the spectral type of M7.5. Photometry obtained
using the 0.9 m Dutch telescope at ESO, La Silla, yield an approximate average
I-band magnitude
![]() and
and
![]() mag. Van Loon et al. (1998b) concluded on the basis of the equivalent widths of the Ca II
triplet lines that IRAS 04553-6825 has a typical LMC metallicity (Z=0.008).
mag. Van Loon et al. (1998b) concluded on the basis of the equivalent widths of the Ca II
triplet lines that IRAS 04553-6825 has a typical LMC metallicity (Z=0.008).
The echelle spectrum of IRAS 04553-6825 around the Na I
![]() 8183,8195 lines is presented in Fig. B.1, on an arbitrary flux
scale. Note the perfect match between the spectra taken with a time interval
of 3 months or 0.1 in pulsation phase, both between minimum and average light
in the K-band. The absorption is maximum at a heliocentric velocity between
280 and 290 kms-1, whereas the K I
8183,8195 lines is presented in Fig. B.1, on an arbitrary flux
scale. Note the perfect match between the spectra taken with a time interval
of 3 months or 0.1 in pulsation phase, both between minimum and average light
in the K-band. The absorption is maximum at a heliocentric velocity between
280 and 290 kms-1, whereas the K I ![]() 7699 and Ca II
7699 and Ca II
![]() 8498, 8542, 8662 absorption is maximum at 295 km
s-1. This is due to scattering of the photospheric spectrum by an
extended, expanding dust shell (see Romanik & Leung 1981, and references
therein). The equivalent widths are measured as
8498, 8542, 8662 absorption is maximum at 295 km
s-1. This is due to scattering of the photospheric spectrum by an
extended, expanding dust shell (see Romanik & Leung 1981, and references
therein). The equivalent widths are measured as
![]() Å and
Å and
![]() Å in October 1995, and
Å in October 1995, and
![]() Å and
Å and
![]() Å in January 1996. Their sum is on average
Å in January 1996. Their sum is on average
![]() Å. The equivalent widths of the Na I lines
reach their minima in giants, and are larger in both dwarfs and supergiants.
Comparison with Schiavon et al. (1997), and excluding a dwarf status,
confirms that IRAS 04553-6825 has a supergiant-type optical spectrum.
Å. The equivalent widths of the Na I lines
reach their minima in giants, and are larger in both dwarfs and supergiants.
Comparison with Schiavon et al. (1997), and excluding a dwarf status,
confirms that IRAS 04553-6825 has a supergiant-type optical spectrum.
Elias et al. (1986) claim the association with H![]() and forbidden line
emission from N+ and S+ ions. However, the red-shift of IRAS 04553-6825
is such that the expected observed wavelengths of both the H
and forbidden line
emission from N+ and S+ ions. However, the red-shift of IRAS 04553-6825
is such that the expected observed wavelengths of both the H![]() ,
N
II
,
N
II ![]() 6548, and S II
6548, and S II
![]() 6717, 6731 emission lines
coincide within
6717, 6731 emission lines
coincide within ![]() 20 kms-1 with telluric OH emission lines. A
stretch of
20 kms-1 with telluric OH emission lines. A
stretch of ![]() 10 Å of photospheric spectrum around 6590 Å that is
relatively free of molecular absorption is easily mistaken for the N II
10 Å of photospheric spectrum around 6590 Å that is
relatively free of molecular absorption is easily mistaken for the N II ![]() 6583 line in a lower resolution spectrum like that of Elias et al.
6583 line in a lower resolution spectrum like that of Elias et al.
Other telluric OH lines in the spectrum were used to derive an empirical
relation between the intensity and quantum numbers associated with the
vibrational and rotational levels of the transition, making use of Osterbrock
& Martel (1992) for identifications. A template line shape of the telluric OH
line was created by averaging 20 bright isolated lines. The telluric line was
then subtracted from the spectrum of the star (Fig. B.2). What remains is
spatially extended H![]() emission covering
emission covering ![]() 50 kms-1, and weak
photospheric H
50 kms-1, and weak
photospheric H![]() absorption. A 10 min exposure taken through an
H
absorption. A 10 min exposure taken through an
H![]() filter with the NTT of the region around IRAS 04553-6825
(http://www.eso.org/outreach/press-rel/pr-1996/phot-15-96.gif) shows extended
nebular complexes a few arcmin SW and faint filamentary emission due E of the
star, but no H
filter with the NTT of the region around IRAS 04553-6825
(http://www.eso.org/outreach/press-rel/pr-1996/phot-15-96.gif) shows extended
nebular complexes a few arcmin SW and faint filamentary emission due E of the
star, but no H![]() emission that can be attributed to the emission
detected in the spectrum at
emission that can be attributed to the emission
detected in the spectrum at ![]() 1 pc from the star.
1 pc from the star.
Wood et al. (1998), Blommaert et al. (1998) and Ortiz et al. (2000) have searched for near- and mid-IR counterparts of OH sources in the direction of the Galactic Centre, mainly from Lindqvist et al. (1992a). Their studies are suitable for comparison of the properties of maser emission, expansion velocities, pulsation periods and amplitudes, and CSE optical depths. A distance to the Galactic Centre of 8 kpc is adopted (Reid 1993).
| (L)WHM | IRAS-PSC |
|
|
|
|
id | (H-K) | K | S12 | S25 | S60 |
|
P | |||
| 5. | 17421-2931 | 3 | 2 | 3 | 26 | 5 | 93 | + | 3.3 | 5.2 | <30 | 17.6 | ||||
| 13. | 17423-2924 | 9 | 8 | 12 | 34 | 6 | 93 | ? | 4.7: | 16 | <362 | 14.2 | ||||
| 13.015 | 17423-2924 | 33 | 16 | 36 | 34 | 6 | 93 | ? | 1.29 | 9.43 | 4.7: | 16 | <362 | -2.33 | 213 | |
| 21.031 | 17413-2909 | 1 | 1 | 2 | 31 | 7 | 93 | + | 3.02 | 9.27 | 6.5 | <52 | <606 | -5.26 | 698 | 18.8 |
| 33. | 17413-2903 | 29 | 2 | 29 | 28 | 6 | 93 | + | 9.0 | <16 | <42 | 15. | ||||
| 34.004 | 17419-2907 | 37 | 27 | 46 | 26 | 13 | 93 | ? | 0.88 | 7.14 | 4.6 | 117 | 467: | -4.69 | 453 | 14.2 |
| 34.063 | 17419-2907 | 55 | 9 | 56 | 26 | 13 | 93 | ? | 2.52 | 9.60 | 4.6 | 117 | 467: | -3.70 | 915 | |
| 39.001 | 17433-2918 | 49 | 2 | 49 | 31 | 6 | 93 | ? | 0.82 | 7.12 | <7.3 | 6.3 | <77 | -4.25 | 355 | |
| 39.002 | 17433-2918 | 50 | 5 | 50 | 31 | 6 | 93 | ? | 2.23 | 7.53 | <7.3 | 6.3 | <77 | -4.69 | 559 | 13.3 |
| 60.001 | 17421-2857 | 4 | 13 | 14 | 19 | 5 | 93 | ? | 1.02 | 6.13 | 16 | 298 | <4318 | -5.25 | 576 | |
| 64.028 | 17412-2849 | 7 | 2 | 7 | 22 | 6 | 93 | + | 2.25 | 8.42 | 4.1 | 5.8 | <56 | -5.70 | 692 | 17.0 |
| 65.119 | 17424-2859 | 4 | 6 | 7 | 22 | 7 | 93 | + | 1.86 | 8.07 | 1360 | 5147 | 18560 | -5.01 | 799 | 19.9 |
| 71.002 | 17417-2851 | 29 | 7 | 30 | 31 | 9 | 93 | + | 2.82 | 9.38 | 11: | 54 | 671: | -4.76 | 636 | 24.4 |
| 79.001 | 17411-2843 | 30 | 3 | 30 | 32 | 5 | 102 | + | 1.07 | 6.48 | 3.4 | 4.2 | <53 | -5.02 | 477 | 9.7 |
| 82.007 | 17428-2854 | 16 | 2 | 16 | 23 | 7 | 93 | + | 1.83 | 7.99 | 12 | 151: | <57 | -4.89 | 701 | 23.9 |
| 101.014 | 17419-2837 | 61 | 1 | 61 | 74 | 7 | 93 | + | 3.41 | 10.33 | <10 | 4.3 | <99 | -4.98 | 825 | 15.8 |
| 134. | 17436-2807 | 1 | 8 | 8 | 47 | 5 | 93 | ? | 4.7 | <30 | <451 | 16.3 | ||||
| S02. | 17428-2918 | 39 | 1 | 39 | 46 | 10 | 92 | + | 2.8: | 6.3 | <212 | |||||
| S07. | 17429-2903 | 55 | 17 | 58 | 30 | 7 | 102 | ? | <7.6 | 23 | 548: | |||||
| S15. | 17441-2822 | 7 | 3 | 7 | 23 | 6 | 93 | + | <7.7 | 69 | 12952 |
Cross-identifications of the samples of stars in Lindqvist et al. (1992a) and
Wood et al. (1998) with the IRAS Point Source Catalogue (PSC) are summarised
in Table C.1. Where the OH source and/or LPV lies inside of the error ellipse
as given in the PSC, the identification was tagged positive (+). If the
distances along both axes of the error ellipse are less than ![]() ,
the
identification was tagged questionable (?). This resulted in 11 likely IRAS
counterparts. All of these that have known near-IR counterparts have IR
colours that suggest oxygen-rich CSEs (from (K-[12]) versus (H-K), see van
Loon et al. 1998a). The identification of 65.119 with IRAS 17424-2859 is
uncertain because the 12
,
the
identification was tagged questionable (?). This resulted in 11 likely IRAS
counterparts. All of these that have known near-IR counterparts have IR
colours that suggest oxygen-rich CSEs (from (K-[12]) versus (H-K), see van
Loon et al. 1998a). The identification of 65.119 with IRAS 17424-2859 is
uncertain because the 12 ![]() m emission is much too bright to arise from a
CSE around an evolved star given its near-IR colours, and this object is
further ignored. Ortiz et al. (2000) searched for 7 and 15
m emission is much too bright to arise from a
CSE around an evolved star given its near-IR colours, and this object is
further ignored. Ortiz et al. (2000) searched for 7 and 15 ![]() m
counterparts of OH/IR stars in the Galactic Centre using the ISOGAL (Omont
et al. 1999) database. All of their identifications of Lindqvist sources with
IRAS sources are also recovered by us, but there are at least as many more
identifications that they did not find. The ISOGAL survey had to avoid strong
IRAS point sources and is therefore biased, whereas the IRAS survey and our
approach of identifying OH/IR stars are expected to be more homogeneous.
m
counterparts of OH/IR stars in the Galactic Centre using the ISOGAL (Omont
et al. 1999) database. All of their identifications of Lindqvist sources with
IRAS sources are also recovered by us, but there are at least as many more
identifications that they did not find. The ISOGAL survey had to avoid strong
IRAS point sources and is therefore biased, whereas the IRAS survey and our
approach of identifying OH/IR stars are expected to be more homogeneous.
The IRAS 12 ![]() m flux densities of the positively identified sources are all
in the range 2.8 to 12 Jy. This corresponds to flux densities from 0.07 to 0.3
Jy at the distance of the LMC. OH/IR stars with IRAS 12
m flux densities of the positively identified sources are all
in the range 2.8 to 12 Jy. This corresponds to flux densities from 0.07 to 0.3
Jy at the distance of the LMC. OH/IR stars with IRAS 12 ![]() m flux densities
corresponding to
m flux densities
corresponding to ![]() 1 Jy at the LMC are not encountered in the Galactic
Centre, but do exist in the MCs (e.g. Table 2). This is especially surprising
as it has been suggested that among the Galactic Centre OH/IR stars are
massive, metal-rich mass-losing LPVs that are expected to have a large IR
excess emission from their dusty CSEs. At the other extreme, if most of the
Galactic Centre CSEs have 12
1 Jy at the LMC are not encountered in the Galactic
Centre, but do exist in the MCs (e.g. Table 2). This is especially surprising
as it has been suggested that among the Galactic Centre OH/IR stars are
massive, metal-rich mass-losing LPVs that are expected to have a large IR
excess emission from their dusty CSEs. At the other extreme, if most of the
Galactic Centre CSEs have 12 ![]() m flux densities lower than the positively
identified IRAS sources, they would have been largely undetected by IRAS in
the MCs.
m flux densities lower than the positively
identified IRAS sources, they would have been largely undetected by IRAS in
the MCs.
Wood et al. (1998) find LPVs with K-band magnitudes from 5 to 13 after
correction for interstellar extinction, with the faintest IRAS associated LPV
to have K0=10.33 mag. At the distance of the LMC this would yield K-band
magnitudes from 9 to 17, so most of these would also have been found by the
IRAC2 searches for near-IR counterparts of IRAS sources in the MCs by Zijlstra
et al. (1996), van Loon et al. (1997), and Groenewegen & Blommaert (1998). The
(H-K)0 colours of the Galactic Centre LPVs are ![]() 2 mag on average and
2 mag on average and
![]() 4 mag maximum, similar to the (H-K) colours of the obscured AGB stars
in the MCs.
4 mag maximum, similar to the (H-K) colours of the obscured AGB stars
in the MCs.
The mean values of ![]() and
and
![]() according to the (K-L)0colour (corrected for interstellar extinction) for the LPVs in the Galactic
Centre follow a sequence in the period-luminosity (P-L) diagram (Fig. C.1).
Also plotted are the OH maser sources in the LMC that have known pulsation
periods and bolometric magnitudes, and the P-L relations that have been
derived from samples of oxygen-rich LPVs (dotted) and carbon-rich LPVs
(dashed) with periods P<420 d (Feast et al. 1989). The LMC OH maser stars
with known pulsation period have typically
according to the (K-L)0colour (corrected for interstellar extinction) for the LPVs in the Galactic
Centre follow a sequence in the period-luminosity (P-L) diagram (Fig. C.1).
Also plotted are the OH maser sources in the LMC that have known pulsation
periods and bolometric magnitudes, and the P-L relations that have been
derived from samples of oxygen-rich LPVs (dotted) and carbon-rich LPVs
(dashed) with periods P<420 d (Feast et al. 1989). The LMC OH maser stars
with known pulsation period have typically
![]() mag. Yet they appear
to be on the extension of the (K-L) colour sequence as traced by the
Galactic Centre LPVs, despite that this sequence already reaches (K-L)>4 mag
before reaching the long periods and high luminosities of the LMC stars. This
illustrates that LMC stars with a similar stellar structure as Galactic Centre
stars have less dusty CSEs due to their lower metallicity (see also van Loon
2000).
mag. Yet they appear
to be on the extension of the (K-L) colour sequence as traced by the
Galactic Centre LPVs, despite that this sequence already reaches (K-L)>4 mag
before reaching the long periods and high luminosities of the LMC stars. This
illustrates that LMC stars with a similar stellar structure as Galactic Centre
stars have less dusty CSEs due to their lower metallicity (see also van Loon
2000).