A&A 367, L9-L13 (2001)
DOI: 10.1051/0004-6361:20010065
M. Haas1 - U. Klaas1 - S. A. H. Müller2 - R. Chini2 - I. Coulson3
1 -
Max-Planck-Institut für Astronomie (MPIA), Königstuhl 17,
69117 Heidelberg, Germany
2 -
Astronomisches Institut, Ruhr-Universität Bochum, 44780 Bochum, Germany
3 -
Joint Astronomy Centre, 660 N. Aohuku Place, University Park, Hilo 96720, Hawaii, USA
Received 11 December 2000 / Accepted 11 January 2001
Abstract
A new method is presented to reveal high
mid-infrared (MIR) extinction in ultraluminous infrared galaxies (ULIRGs):
the ratio between the PAH 7.7 ![]() m feature and the
sub-mm continuum at 850
m feature and the
sub-mm continuum at 850 ![]() m.
While the sub-mm radiation is optically thin and serves for normalization,
any high MIR extinction reduces the observed PAH 7.7
m.
While the sub-mm radiation is optically thin and serves for normalization,
any high MIR extinction reduces the observed PAH 7.7 ![]() m strength.
Since the emitters (PAH carriers) and the absorbers (large dust grains reemitting at 850
m strength.
Since the emitters (PAH carriers) and the absorbers (large dust grains reemitting at 850 ![]() m)
are typically mixed along the line of sight,
the new method probes the absorption along the entire dust column,
and not only the properties of a shallow surface.
13 out of a sample of 15 ULIRGs as well as 20 normal galaxies of a comparison sample
populate the same well confined range of the PAH 7.7
m)
are typically mixed along the line of sight,
the new method probes the absorption along the entire dust column,
and not only the properties of a shallow surface.
13 out of a sample of 15 ULIRGs as well as 20 normal galaxies of a comparison sample
populate the same well confined range of the PAH 7.7 ![]() m/850
m/850 ![]() m flux ratio (
m flux ratio (![]() ).
Their MIR extinction may be moderate.
In contrast, two ULIRGs show an exceptionally low PAH 7.7
).
Their MIR extinction may be moderate.
In contrast, two ULIRGs show an exceptionally low PAH 7.7 ![]() m/850
m/850 ![]() m ratio
indicative of high extinction:
UGC 5101 has
m ratio
indicative of high extinction:
UGC 5101 has
![]() consistent with former spectroscopic estimates.
Arp 220 has a huge extinction of at least
consistent with former spectroscopic estimates.
Arp 220 has a huge extinction of at least
![]() ,
exceeding former estimates of
,
exceeding former estimates of
![]() based on
the [SIII] 18.7
based on
the [SIII] 18.7 ![]() m/33.5
m/33.5 ![]() m ratio.
As an application of the new diagnostics,
after dereddening of the central MIR continuum
and with the assumption of a disk-like dust distribution seen under a tilted angle,
we find increasing evidence for a hidden quasar in Arp 220.
m ratio.
As an application of the new diagnostics,
after dereddening of the central MIR continuum
and with the assumption of a disk-like dust distribution seen under a tilted angle,
we find increasing evidence for a hidden quasar in Arp 220.
Key words: ISM: dust extinction - galaxies: Arp 220 - ISM - quasars - starburst - infrared: galaxies
AGN (active galactic nuclei) have been
detected so far only in about a third of the nearby ULIRGs (Genzel et al. 1998),
in the remaining two thirds they may
have escaped detection due to enormous extinction (Sanders 1999).
Since most of the known AGN are pronounced MIR emitters,
the extinction required to hide an AGN must be very high,
but so far no technique is known to probe the entire MIR extinction.
When the amount of extinction is determined exclusively from data,
which are themselves affected by extinction - like the
9.7 and 18 ![]() m silicate absorption features or the [SIII] 18.7
m silicate absorption features or the [SIII] 18.7 ![]() m/33.5
m/33.5 ![]() m line ratio -,
the result can be biased toward too low values,
representing only the properties of a shallow surface,
but not the entire dust column.
Yet, a robust technique is required which provides the order of extinction and
clues to
whether the absorbing dust is located in a foreground
screen or whether it is mixed with the emitters.
m line ratio -,
the result can be biased toward too low values,
representing only the properties of a shallow surface,
but not the entire dust column.
Yet, a robust technique is required which provides the order of extinction and
clues to
whether the absorbing dust is located in a foreground
screen or whether it is mixed with the emitters.
Extinction estimates of ULIRGs have also been
derived from longer wavelengths, for example the shape of the
spectral energy distribution from the moderately affected
far-infrared (FIR)
to the optically thin sub-mm regimes. These spectra can be fitted
by one modified blackbody with a single temperature.
This approach, however, ignores the multitude of dust temperatures suggested from the
patchy optical morphology, and the formally derived extinction
values up to
![]() are questionable.
Refinements using several modified blackbodies rely on the
choice of the dust emissivity
are questionable.
Refinements using several modified blackbodies rely on the
choice of the dust emissivity ![]() and the decomposition into the various temperature components
(Klaas et al. 1997; Lisenfeld et al. 2000; Klaas et al. 2001),
hence the opacities cannot unambigously be determined.
and the decomposition into the various temperature components
(Klaas et al. 1997; Lisenfeld et al. 2000; Klaas et al. 2001),
hence the opacities cannot unambigously be determined.
In order to determine the total amount of extinction,
we here propose a different method,
using the PAH 7.7 ![]() m to continuum 850
m to continuum 850 ![]() m flux ratio.
While the sub-mm radiation is optically thin and represents
the emission from essentially all dust grains,
the PAH strength (measured by the peak height of the
Polycyclic Aromatic Hydocarbonates at 7.7
m flux ratio.
While the sub-mm radiation is optically thin and represents
the emission from essentially all dust grains,
the PAH strength (measured by the peak height of the
Polycyclic Aromatic Hydocarbonates at 7.7 ![]() m)
is sensitive to dust extinction in the MIR.
m)
is sensitive to dust extinction in the MIR.
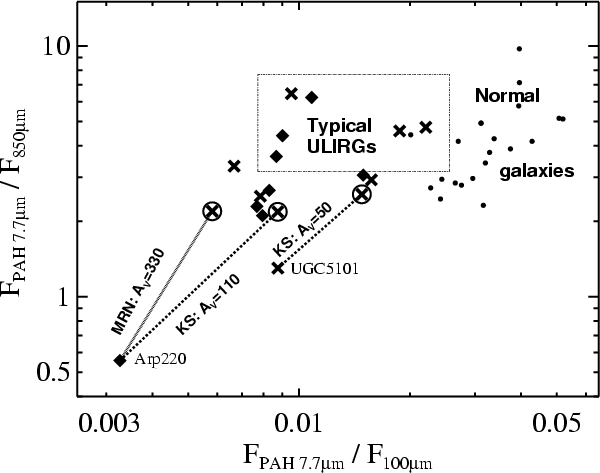 |
Figure 1:
Two-colour diagram
PAH 7.7 |
| Open with DEXTER | |
 |
Figure 2:
Two-"colour'' diagram
PAH 7.7 |
| Open with DEXTER | |
A comparison sample of 20 "normal galaxies'' was constructed
as a subset of
the SCUBA 850 ![]() m local universe galaxy survey (Dunne et al. 2000)
containing dusty galaxies with
m local universe galaxy survey (Dunne et al. 2000)
containing dusty galaxies with
![]() .
We selected those for which PAH spectra are available in the ISO data archive
and for which the ISOPHOT-S aperture (24
.
We selected those for which PAH spectra are available in the ISO data archive
and for which the ISOPHOT-S aperture (24
![]() )
contains the entire 850
)
contains the entire 850 ![]() m flux,
as is the case for the ULIRGs.
m flux,
as is the case for the ULIRGs.
The synchrotron contribution (clearly below 10%) has been subtracted from
the 850 ![]() m fluxes.
m fluxes.
Figure 1 (y-axis) shows
the PAH 7.7 ![]() m/850
m/850 ![]() m distribution of the ULIRGs
and the reference sample.
m distribution of the ULIRGs
and the reference sample.
Strikingly, all ULIRGs except Arp 220 and UGC 5101 lie in a confined range,
which is also the same as for the normal galaxies.
This suggests that for both samples the PAH and the sub-mm emission
are related, and that no extraordinary excitation conditions are needed.
The ISM in the galactic disk
exhibits PAH emission with a low ISRF over a large range of different
environmental parameters (Mattila et al. 1996).
Léger & Puget (1989) predicted that PAH formation
takes place in molecular clouds, and these are
typically bright at 850 ![]() m.
m.
| deredd. |
|
deredd. |
|
|
|
| factor | 10
|
factor | 10
|
|
|
| observed | 1.0 | 2.1 | 1.0 | 9.0 | 0.23 |
| MRN: AV=330 | 10 (4...20) | 3.2 | 28.8 | 0.72 | |
| KS: AV=110 | 4.0 | 8.4 | 1.7 (1.3 ... 2.0) | 15.3 | 0.54 |
| KS:
|
20.0 | 42.0 | " | " | 2.75 |
The PAH 7.7 ![]() m/100
m/100 ![]() m ratio is lower for the ULIRGs than for the reference
sample by a factor of about three (x-axis in Fig. 1).
ULIRGs have warmer dust (
m ratio is lower for the ULIRGs than for the reference
sample by a factor of about three (x-axis in Fig. 1).
ULIRGs have warmer dust (
![]() )
than normal
galaxies (
)
than normal
galaxies (
![]() ), and therefore
their 100
), and therefore
their 100 ![]() m flux relative to that at 850
m flux relative to that at 850 ![]() m is higher.
Again, along the PAH 7.7
m is higher.
Again, along the PAH 7.7 ![]() m/100
m/100 ![]() m distribution Arp 220
lies below the other obviously more "typical
ULIRGs'' which populate a confined range.
We consider three possibilities to explain the exceptional position of Arp 220 in Fig. 1:
m distribution Arp 220
lies below the other obviously more "typical
ULIRGs'' which populate a confined range.
We consider three possibilities to explain the exceptional position of Arp 220 in Fig. 1:
The difference in the PAH 7.7 ![]() m/100
m/100 ![]() m distributions
between ULIRGs and the normal galaxies can be entirely
explained by the higher 100
m distributions
between ULIRGs and the normal galaxies can be entirely
explained by the higher 100 ![]() m/850
m/850 ![]() m colour
temperature of the dust in ULIRGs.
Hence, the PAH emitters do not appear particularily related to the
warm - presumably starburst heated
- dust in ULIRGs.
Rather, the similar PAH 7.7
m colour
temperature of the dust in ULIRGs.
Hence, the PAH emitters do not appear particularily related to the
warm - presumably starburst heated
- dust in ULIRGs.
Rather, the similar PAH 7.7 ![]() m/850
m/850 ![]() m distributions
for the typical ULIRGs and the normal galaxies
suggests that the PAH emitters and the sub-mm emitting dust
grains are intimately coupled and
actually mixed along the line of sight through the galaxies.
Therefore, in the following we will use the mixed case, unless otherwise stated.
m distributions
for the typical ULIRGs and the normal galaxies
suggests that the PAH emitters and the sub-mm emitting dust
grains are intimately coupled and
actually mixed along the line of sight through the galaxies.
Therefore, in the following we will use the mixed case, unless otherwise stated.
Now we consider the minimum additional mixed case extinction required to shift
Arp 220 towards the lower border of the PAH 7.7 ![]() m/850
m/850 ![]() m range for
the other ULIRGs (Fig. 1).
This depends on the extinction curves used.
m range for
the other ULIRGs (Fig. 1).
This depends on the extinction curves used.
![]() ,
when using the
interstellar extinction curve
for graphite and silicate grains in our Galaxy,
with a grain size distribution cutoff at about 0.3
,
when using the
interstellar extinction curve
for graphite and silicate grains in our Galaxy,
with a grain size distribution cutoff at about 0.3 ![]() m
(MRN-model: Mathis et al. 1983, Table C1).
m
(MRN-model: Mathis et al. 1983, Table C1).
In ULIRGs the dust may have properties more like those found in
protostellar cold dense clouds.
Their observed extinction curves have been successfully modelled
using flaky grains with a large size cutoff at about 30 ![]() m
(KS model: Krügel & Siebenmorgen 1994).
Using even larger grains (>30
m
(KS model: Krügel & Siebenmorgen 1994).
Using even larger grains (>30 ![]() m) would result in a low emissivity
exponent of
m) would result in a low emissivity
exponent of
![]() ,
contrary to the observed value of
,
contrary to the observed value of
![]() (Lisenfeld et al. 2000; Klaas et al. 2001).
In contrast to the MRN model, the KS extinction curve
has no 5-25
(Lisenfeld et al. 2000; Klaas et al. 2001).
In contrast to the MRN model, the KS extinction curve
has no 5-25 ![]() m features in the MIR, consistent with the smooth
curve observed toward the Galactic centre (Lutz et al. 1996).
Therefore we give the KS model a slightly higher preference.
If the entire dust in Arp 220 has such properties
m features in the MIR, consistent with the smooth
curve observed toward the Galactic centre (Lutz et al. 1996).
Therefore we give the KS model a slightly higher preference.
If the entire dust in Arp 220 has such properties![]() ,
then the extinction required to provide the PAH 7.7
,
then the extinction required to provide the PAH 7.7 ![]() m/850
m/850 ![]() m
offset to the other ULIRGs is at least
m
offset to the other ULIRGs is at least
![]() ,
which we adopt as a conservative estimate. It is also consistent with
the lower limit
,
which we adopt as a conservative estimate. It is also consistent with
the lower limit
![]() ,
which corresponds to
,
which corresponds to
![]() derived from [SIII] 18.7
derived from [SIII] 18.7 ![]() m/33.5
m/33.5 ![]() m line ratio (Genzel et al. 1998).
Our value
m line ratio (Genzel et al. 1998).
Our value
![]() is a lower limit,
since it refers to the minimum extinction required to shift Arp 220
to the range of the other ULIRGs.
is a lower limit,
since it refers to the minimum extinction required to shift Arp 220
to the range of the other ULIRGs.
So far, we have derived the average extinction of Arp 220 which, however, could vary between different lines of sight.
The central region of Arp 220 exhibits a complex geometry on
NICMOS images (Scoville et al. 1999) with two nuclei,
each intersected by dust lanes, which are coincident with the
CO disks (Downes & Solomon 1998).
At 2 ![]() m the actual nuclear centres appear to be entirely hidden behind the dust lanes.
On KECK high resolution 3-24.5
m the actual nuclear centres appear to be entirely hidden behind the dust lanes.
On KECK high resolution 3-24.5 ![]() m images
the PAH emission, the silicate absorption and the 12.5
m images
the PAH emission, the silicate absorption and the 12.5 ![]() m continuum show
similar morphologies and only a moderate variation in the intensity ratios
for various image areas (Soifer et al. 1999).
Most of the MIR emission arises from an extremely compact area
with a diameter of less than 100 pc centred on the western nucleus (Soifer et al. 1999).
It contributes to the total flux by 66% at the 12.5
m continuum show
similar morphologies and only a moderate variation in the intensity ratios
for various image areas (Soifer et al. 1999).
Most of the MIR emission arises from an extremely compact area
with a diameter of less than 100 pc centred on the western nucleus (Soifer et al. 1999).
It contributes to the total flux by 66% at the 12.5 ![]() m continuum and 55% at the
7.7
m continuum and 55% at the
7.7 ![]() m PAH line.
m PAH line.
We argue now, that the extinction of the western nuclear MIR continuum
is higher than previously inferred.
If the extinction of the western nucleus
were actually as low (
![]() )
as inferred from the 18
)
as inferred from the 18 ![]() m
silicate absorption, then its dereddening does not increase the
PAH strength significantly.
m
silicate absorption, then its dereddening does not increase the
PAH strength significantly.
In this case the "rest'' (= total - western nucleus) of Arp 220
must contain all the hidden PAH emission necessary to reach
the PAH 7.7 ![]() m/850
m/850 ![]() m and PAH 7.7
m and PAH 7.7 ![]() m/100
m/100 ![]() m levels
of the other ULIRGs. Hence this "rest'' has to be
much more extinguished (
m levels
of the other ULIRGs. Hence this "rest'' has to be
much more extinguished (
![]() (average)).
But this contradicts to the moderate variation in the intensity ratios
for various image areas emphasized above.
Furthermore, a detailed calculation shows that the
dereddened position of the entire galaxy Arp 220 then lies in the same range as for the
simple average dereddening (Fig. 1).
Since the silicate absorption feature may probe only the
shallow surface,
the actual extinction of the western nucleus may well be much
higher than
(average)).
But this contradicts to the moderate variation in the intensity ratios
for various image areas emphasized above.
Furthermore, a detailed calculation shows that the
dereddened position of the entire galaxy Arp 220 then lies in the same range as for the
simple average dereddening (Fig. 1).
Since the silicate absorption feature may probe only the
shallow surface,
the actual extinction of the western nucleus may well be much
higher than
![]() .
.
These arguments support the picture that in Arp 220
both the regions emitting the PAH 7.7 ![]() m
and those emitting the 12.5
m
and those emitting the 12.5 ![]() m continuum are affected by a high MIR extinction
of similar order of
m continuum are affected by a high MIR extinction
of similar order of
![]() .
Thus the extinction is so high
that it might be difficult to discover a hidden AGN with common tracers.
.
Thus the extinction is so high
that it might be difficult to discover a hidden AGN with common tracers.
The effects of reddening depend on the geometry of the absorbing/reemitting dust and we consider here the extreme cases "ideal sphere'' and "axis-symmetric geometry''.
If the dust were distributed in an ideal sphere, then
the absorbed MIR continuum could only escape via reemission at longer wavelengths.
In this case "dereddening'' will not increase the total luminosity, but only
the
![]() ratio via a shift of
ratio via a shift of
![]() towards
towards
![]() .
But this case can be rejected as follows:
.
But this case can be rejected as follows:
The presence of CO disks already indicates a non-spherical
axis-symmetric geometry tilted about 45![]() with respect
to our line of sight (Downes & Solomon 1998).
Therefore, a significant portion of the MIR continuum might escape along the
polar directions, but along the line of sight a reduced portion of the luminosity is seen.
In order to derive the true MIR luminosity,
dereddening has to be applied. It will actually increase
with respect
to our line of sight (Downes & Solomon 1998).
Therefore, a significant portion of the MIR continuum might escape along the
polar directions, but along the line of sight a reduced portion of the luminosity is seen.
In order to derive the true MIR luminosity,
dereddening has to be applied. It will actually increase
![]() ,
and to a less extent
,
and to a less extent
![]()
![]() .
.
If the emitters of the MIR continuum are mixed with the absorbing dust, then the same AV as derived from the PAH diagnostics can be used for dereddening. The results are listed in Table 1 and shown in Fig. 2.
Dereddening with the MRN model
shifts Arp 220 from the cool ULIRGs to the warm ones,
each of which houses a strong AGN.
With the KS model such a shift is present, but less pronounced.
Nevertheless, in both cases
![]() reaches high
quasar-like values (
reaches high
quasar-like values (![]() 10
10![]() ).
).
The compactness of the MIR emitting region and the
presence of the dusty CO disks suggests, that the MIR continuum emitters
are not as well mixed with the absorbing dust as the PAHs.
This does not conflict with the low variation of the
observed MIR colours across the KECK images mentioned above.
In this case the (hidden) MIR continuum originates more in the centre,
which is surrounded by the absorbing material.
Such a situation is typically seen in Seyfert2s (Clavel et al. 2000).
Then half of the dust column according to
![]() will work effectively on the central MIR continuum
as screen absorber with an amount of
will work effectively on the central MIR continuum
as screen absorber with an amount of
![]() ,
placing Arp 220 clearly in the
,
placing Arp 220 clearly in the
![]() range of quasars (Table 1).
With
range of quasars (Table 1).
With
![]() the screen
dereddening of the centre becomes even more extreme.
the screen
dereddening of the centre becomes even more extreme.
With conservative dereddening of
![]() by a factor
of 4 (Table 1, KS:
by a factor
of 4 (Table 1, KS:
![]() ), the
MIR luminosity density of the western nucleus
reaches 7.310
), the
MIR luminosity density of the western nucleus
reaches 7.310![]() /pc
/pc![]()
(![]() ,
,
![]() pc),
about a factor of 1000 higher than in the prototype nearby starburst galaxy M 82
(
pc),
about a factor of 1000 higher than in the prototype nearby starburst galaxy M 82
(
![]() ,
,
![]() pc).
Since the dust (and the gas) is more dissipative than the stars, is
tends to be distributed in a more compact area than the stars.
Bearing this in mind,
it is difficult to imagine, how starbursts alone can create such a high
luminosity density, and simultaneously how the dust hides them entirely.
pc).
Since the dust (and the gas) is more dissipative than the stars, is
tends to be distributed in a more compact area than the stars.
Bearing this in mind,
it is difficult to imagine, how starbursts alone can create such a high
luminosity density, and simultaneously how the dust hides them entirely.
Therefore, a more natural explanation would be that - in addition to the prominent starbursts mainly responsible for the FIR luminosity - one (or perhaps both) of the nuclei of Arp 220 contains a powerful AGN providing the quasar-like MIR luminosity which is hidden to us.
To summarize, Arp 220 shows an extraordinarily high - presumably mixed case - extinction, which also works on the MIR continuum of the western nuclear region. The presence of tilted non-spherical geometry justifies that after dereddening the true MIR luminosity reaches quasar-like values. Moreover, the MIR luminosity density of the western nucleus exceeds that of known circumnuclear starbursts, thus increasing the evidence for a hidden quasar in Arp 220.