A&A 367, 770-779 (2001)
DOI: 10.1051/0004-6361:20000465
Rapid polarization variations at 20 cm in 0917+624
S. J. Qian1,2 - A. Witzel1
- A. Kraus1
- T. P. Krichbaum1 - J. A. Zensus1
1 - Max-Planck-Institut für Radioastronomie,
Auf dem Hügel 69, 53121 Bonn, Germany
2 - Beijing Astronomical Observatory, National Astronomical
Observatories (CAS), Beijing 100012, China
Received 15 May 2000 / Accepted 28 November 2000
Abstract
The intraday variations (IDV hereafter) of the total
and the polarized flux density
observed at 20 cm in 0917+624 (in May 1989)
are analysed. It is shown that the IDV can be interpreted
in terms of refractive interstellar scintillation.
The observed variations are dominated by one scintillating component
with a timescale
 days and a scintillation
index
days and a scintillation
index
 .
In addition,
one more scintillating
component with a shorter timescale and a smaller scintillation index
is needed to improve the fit to the observed Q- and
U-light curves. The relationship between
the scintillating components and the VLBI components
are also discussed. It is shown that Doppler beaming of
the 20cm scintillating components with a Lorentz factor
.
In addition,
one more scintillating
component with a shorter timescale and a smaller scintillation index
is needed to improve the fit to the observed Q- and
U-light curves. The relationship between
the scintillating components and the VLBI components
are also discussed. It is shown that Doppler beaming of
the 20cm scintillating components with a Lorentz factor
 7
may be needed to reduce their intrinsic brightness temperatures
significantly below the inverse-Compton limit.
7
may be needed to reduce their intrinsic brightness temperatures
significantly below the inverse-Compton limit.
Key words: galaxies: compact - polarization - scattering -
radiation mechanisms: non-thermal - quasars:
individual: 0917+62
The nature of IDV observed in compact extragalactic radio sources
and blazars
(Heeschen et al. 1987;
Quirrenbach et al. 1992; Witzel 1992; Krichbaum et al.
1992; Kraus et al. 1999; Kedziora-Chudzcer et al.
1997; Romero et al. 1997;
Quirrenbach et al. 2000)
has not been
fully understood.
Owing to their short timescales,
the derived apparent
brightness temperatures are mostly in the range of
1016-1018 K (and can in extreme cases even reach
1021 K), severely violating the inverse Compton limit
(Kellermann & Pauliny-Toth 1969).
Many models (both intrinsic and extrinsic)
have been proposed to explain
this phenomenon (Wagner & Witzel 1995; Qian 1994a).
Refractive interstellar scintillation
(RISS, Rickett 1990; Rickett et al. 1995;
Qian 1994a,b; Qian et al. 1995)
has been suggested to
explain intraday variations, assuming that
IDV sources contain very compact components of angular size
 50-100
 as and a distance
of the scattering
screen (or the scale height of the interstellar scattering medium) of
0.2-0.5kpc. Recently, extremely
rapid variations,
with timescales of hours, were observed in a few sources
(for example, PKS0405-385,
PKS1519-273 and J1815+3845) and
have been interpreted in terms of
refractive interstellar scintillation (Kedziora-Chudczer et al.
1997; Macquart et al. 2000; Dennett-Thorpe
& de Bruyn 2000).
In these cases the angular sizes of the scintillating components
are derived to be
as and a distance
of the scattering
screen (or the scale height of the interstellar scattering medium) of
0.2-0.5kpc. Recently, extremely
rapid variations,
with timescales of hours, were observed in a few sources
(for example, PKS0405-385,
PKS1519-273 and J1815+3845) and
have been interpreted in terms of
refractive interstellar scintillation (Kedziora-Chudczer et al.
1997; Macquart et al. 2000; Dennett-Thorpe
& de Bruyn 2000).
In these cases the angular sizes of the scintillating components
are derived to be  5-20as and the
distance of the scattering screen then needs
to be 20-50pc. Generally, an RISS interpretation
can avoid the Compton catastrophe problem. However, for the IDV events
observed in PKS0405-385 and PKS1519-273, the derived apparent
brightness temperatures are in the range of
1014-1015 K.
If these high brightness temperatures are due to
Doppler beaming,
the required Lorentz factors of bulk motion
would reach 100-1000.
In contrast, the correlated optical-radio intraday variations
observed in the BL Lac object 0716+714 (Wagner & Witzel 1995;
Qian et al. 1996; Wagner et al. 1996)
imply that this IDV event is due to an intrinsic mechanism,
because RISS cannot produce optical variations.
Among the different intrinsic models, shock models have been proposed
to explain the IDV phenomenon
(Qian et al. 1991; Marscher 1998;
Spada et al. 1999). It was suggested that in some
specific geometries the apparent size of IDV components may be much
larger than those derived from the
light-travel-time arguments, and
by applying a Lorentz
factor of 10-20, the high brightness
temperatures (1016-1018) observed could be explained.
Although the most extreme IDV events are likely to be caused by
refractive interstellar scintillation, it might be difficult to
explain all IDV events in this way (Gabuzda et al. 1999;
Marscher 1996; Kochanev & Gabuzda 1998).
Therefore, it is most important to distinguish between IDV as a
phenomenon intrinsic to compact radio sources and IDV which is
primarily due to scintillation. However, the disentanglement of the
intrinsic intraday variations from scintillation is very difficult
for IDV events of small-amplitude fluctuations (less than
10-15
5-20as and the
distance of the scattering screen then needs
to be 20-50pc. Generally, an RISS interpretation
can avoid the Compton catastrophe problem. However, for the IDV events
observed in PKS0405-385 and PKS1519-273, the derived apparent
brightness temperatures are in the range of
1014-1015 K.
If these high brightness temperatures are due to
Doppler beaming,
the required Lorentz factors of bulk motion
would reach 100-1000.
In contrast, the correlated optical-radio intraday variations
observed in the BL Lac object 0716+714 (Wagner & Witzel 1995;
Qian et al. 1996; Wagner et al. 1996)
imply that this IDV event is due to an intrinsic mechanism,
because RISS cannot produce optical variations.
Among the different intrinsic models, shock models have been proposed
to explain the IDV phenomenon
(Qian et al. 1991; Marscher 1998;
Spada et al. 1999). It was suggested that in some
specific geometries the apparent size of IDV components may be much
larger than those derived from the
light-travel-time arguments, and
by applying a Lorentz
factor of 10-20, the high brightness
temperatures (1016-1018) observed could be explained.
Although the most extreme IDV events are likely to be caused by
refractive interstellar scintillation, it might be difficult to
explain all IDV events in this way (Gabuzda et al. 1999;
Marscher 1996; Kochanev & Gabuzda 1998).
Therefore, it is most important to distinguish between IDV as a
phenomenon intrinsic to compact radio sources and IDV which is
primarily due to scintillation. However, the disentanglement of the
intrinsic intraday variations from scintillation is very difficult
for IDV events of small-amplitude fluctuations (less than
10-15 ).
Intraday variations of total flux density have been studied
intensively, but the properties of IDV polarization
variations have not been investigated thoroughly (Quirrenbach et al.
1989).
Qian et al. (1991) used a shock model to explain the intraday
polarization variations observed in 0917+624 in the IDV event of
December 1988. It was shown that a two-component model (one steady
component and one shock with a variable polarization degree and
polarization angle) could explain the complicated polarization
variations (anti-correlation between the total and polarized flux
density and a polarization angle swing of 18
).
Intraday variations of total flux density have been studied
intensively, but the properties of IDV polarization
variations have not been investigated thoroughly (Quirrenbach et al.
1989).
Qian et al. (1991) used a shock model to explain the intraday
polarization variations observed in 0917+624 in the IDV event of
December 1988. It was shown that a two-component model (one steady
component and one shock with a variable polarization degree and
polarization angle) could explain the complicated polarization
variations (anti-correlation between the total and polarized flux
density and a polarization angle swing of 18 ).
They found that
the polarization of the shock component was nearly perpendicular to
that of the steady component and
the polarization degree and polarization angle of the shocked
region were required to vary only in a narrow range.
Rickett et al. (1995) have shown that the 2-11cm flux
variations observed in the IDV of May 1989 in 0917+624
could be explained by refractive interstellar scintillation and the
VLBI core might be the main scintillating component.
But they found that the 20cm flux density variations
are not as well correlated
with those at 2-11cm as predicted by
scintillation theory. They suggested that the dominant
scintillating component at 20cm is a more extended component (not
the VLBI core). They have also attempted to interpret the intraday
polarization variations observed at 6cm in 0917+624
in terms of refractive scintillation.
Since RISS cannot produce variations of the polarization
degree and polarization angle of a single scintillating component,
two or more scintillating components were required to explain
the complicated polarization variations observed in 0917+624
at high frequencies. In addition,
Qian (1994a,b) applied
multi-frequency structure functions (Blandford et al. 1986;
Qian et al. 1995)
to investigate the possibility of
interpreting the IDV in 0917+624 and other sources in terms of
refractive interstellar scintillation.
In this paper,
we discuss the rapid polarization variations observed
at 20cm in 0917+624 and suggest that the polarization variations
must be due to more than one component.
).
They found that
the polarization of the shock component was nearly perpendicular to
that of the steady component and
the polarization degree and polarization angle of the shocked
region were required to vary only in a narrow range.
Rickett et al. (1995) have shown that the 2-11cm flux
variations observed in the IDV of May 1989 in 0917+624
could be explained by refractive interstellar scintillation and the
VLBI core might be the main scintillating component.
But they found that the 20cm flux density variations
are not as well correlated
with those at 2-11cm as predicted by
scintillation theory. They suggested that the dominant
scintillating component at 20cm is a more extended component (not
the VLBI core). They have also attempted to interpret the intraday
polarization variations observed at 6cm in 0917+624
in terms of refractive scintillation.
Since RISS cannot produce variations of the polarization
degree and polarization angle of a single scintillating component,
two or more scintillating components were required to explain
the complicated polarization variations observed in 0917+624
at high frequencies. In addition,
Qian (1994a,b) applied
multi-frequency structure functions (Blandford et al. 1986;
Qian et al. 1995)
to investigate the possibility of
interpreting the IDV in 0917+624 and other sources in terms of
refractive interstellar scintillation.
In this paper,
we discuss the rapid polarization variations observed
at 20cm in 0917+624 and suggest that the polarization variations
must be due to more than one component.
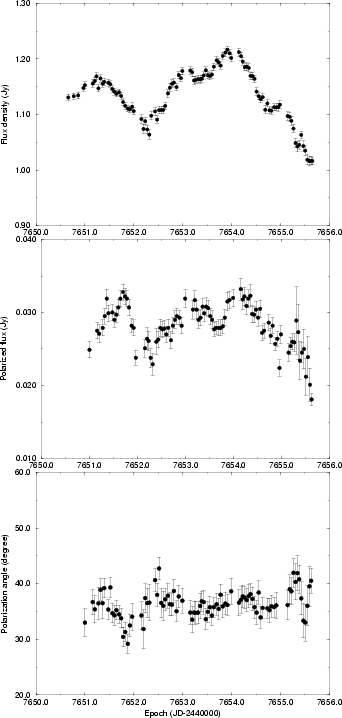
In May 1989 (JD2447650-2447656), multifrequency flux density and linear
polarization observations were carried out at five frequencies (1.4,
2.7, 5, 8.3 and 15GHz) using the VLA (Quirrenbach et al. 2000).
Here we mainly investigate
the variations observed at 20cm and discuss their origin. The light
curves of the total flux density (I), polarized flux density (P) and
polarization angle ( )
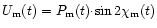
are shown in Fig. 1.
)
are shown in Fig. 1.
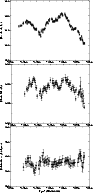 |
Figure 1:
Intraday variations observed at 20cm in 0917+624
(May 1989, JD2447650.0-2447656.0, from top to bottom):
total flux density
I(Jy), polarized flux density P(Jy) and polarization
angle
 ). (Unsmoothed data) ). (Unsmoothed data) |
| Open with DEXTER |
The typical interval
between samples is 0.04 days and the observational
errors are approximately: 7-8mJy (total flux density),
1-1.5mJy (polarized
flux density) and 2- (polarization angle). In order to
remove high frequency noise due to observational uncertainties, in
the following discussions we will use five-point running averages
for the three quantities.
The main properties of the variations observed
at 20 cm can be described as follows.
(polarization angle). In order to
remove high frequency noise due to observational uncertainties, in
the following discussions we will use five-point running averages
for the three quantities.
The main properties of the variations observed
at 20 cm can be described as follows.
- The mean values of the total flux density, polarized flux
density and the polarization angle are 1.137Jy (
 ),
28.5mJy (
),
28.5mJy ( )
and 36
)
and 36
 (
(
 )
with their standard deviations being 0.045Jy, 2.3mJy
and 1
)
with their standard deviations being 0.045Jy, 2.3mJy
and 1
 respectively;
- The variability indices of the fluctuations of the total and
polarized flux density are 5.7
and 11.6,
respectively, showing that the polarized flux density has a much
larger fractional variability amplitude;
- The polarization angle varies only in a very narrow range.
Its maximal deviation from the mean value is only about
5-
 (see Fig. 1), but the variations appear systematic;
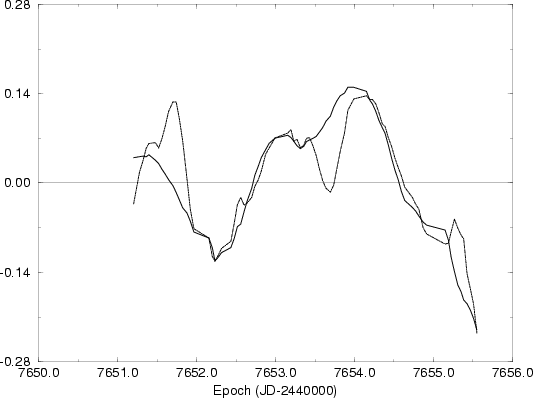
- During about half of the observing period (2.3 days),
the fractional variations
of the polarized flux density are precisely
proportional to those of the total
flux density.
This can be seen more clearly in Fig. 2, where the
fractional variations of the total flux density
(
 )
and the
polarized flux density (
)
and the
polarized flux density (
 )
are shown.
)
are shown.
 |
Figure 2:
The observed fractional variations of the total flux density
(
,
solid line) and
the polarized flux density
(
,
dot-dashed line)
(
 Jy, Jy,
 mJy). The fractional variations of the total
flux density have been scaled up by a factor of 2.36. A clear
correlation between mJy). The fractional variations of the total
flux density have been scaled up by a factor of 2.36. A clear
correlation between  and
and  is visible. (Smoothed data)
 |
| Open with DEXTER |
(
 and
and
 ). For the period when the
proportionality holds the correlation coefficient
between
). For the period when the
proportionality holds the correlation coefficient
between
 and
and
 reaches 0.97.
The last two of the properties listed above are considerably different
from those observed
at the higher frequencies. For example, at 5GHz both a
correlation and anti-correlation between the variations of
the total and polarized flux density, a rapid transition
between the two kinds of relationship
and relatively large polarization angle swings
(
 -
-
 )
were observed (Qian et al. 1991).
)
were observed (Qian et al. 1991).
In the following, we will
show that the characteristics of the intraday
polarization variations observed at 20cm can be explained in terms of
refractive interstellar scintillation with two scintillating
components in the source.
In this section we consider a two-component model.
A two-component model consisting of one steady and one variable
component can be generally applied to study
different kinds of variability,
extrinsic or intrinsic. However, intrinsic
variations usually imply that the
source polarization itself is variable.
As we pointed out in the last section, during half of the observing
period, the fractional variations of the polarized flux
density are proportional
to those of the total flux density
(Fig. 2). In other words, the observed quantities
and
are highly correlated. This suggests that the
polarization variations observed at 20cm are dominated by one
scintillating component. Therefore, as a
first approximation, we can use a two-component
model (one scintillating and one steady component) to explain the
observed variations.
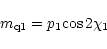
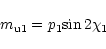
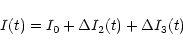
In the case of a two-component model the basic equations
for the Stokes parameters
I(t), Q(t) and U(t) are (Rickett et al. 1995):
 |
(1) |
 |
(2) |
 |
(3) |
where
 |
(5) |
 |
(6) |
 |
(7) |
 |
(8) |
 |
(9) |
 |
(10) |
is the observed fluctuation of the total flux
density caused by scintillation. (I10, p1,  )
and (I20, p2,
)
and (I20, p2,  )
are the flux density, polarization degree
and polarization angle of the steady and the
scintillating component (designated as S1 and S2), respectively.
All of these parameters
are assumed to be constants. (According to scintillation theory,
in the case of isotropic scattering, RISS cannot produce significant
variations in the
polarization degree and polarization angle
of the scintillating
component.)
)
are the flux density, polarization degree
and polarization angle of the steady and the
scintillating component (designated as S1 and S2), respectively.
All of these parameters
are assumed to be constants. (According to scintillation theory,
in the case of isotropic scattering, RISS cannot produce significant
variations in the
polarization degree and polarization angle
of the scintillating
component.)
 Jy.
It can be seen
that, taking the observed values for (
,
Q(t), U(t)),
in the Eqs. (2) and (3), there are only four
unknown constants (Q0, U0,
Jy.
It can be seen
that, taking the observed values for (
,
Q(t), U(t)),
in the Eqs. (2) and (3), there are only four
unknown constants (Q0, U0,
 ,
,
 ), so we can
use the entire observational data to find a solution
for these parameters by a least-square-fit, which minimizes
the mean square difference between the modeled
and the observed (Q(t), U(t)).
), so we can
use the entire observational data to find a solution
for these parameters by a least-square-fit, which minimizes
the mean square difference between the modeled
and the observed (Q(t), U(t)).
The appropriate parameters are found to be:
Q0= 8.46mJy,
U0= 27.14mJy,
(
p0= 0.0250,
 4),
4),
 ,
,
 ,
,
(
p2= 0.0449,

 ).
).
It can be seen that the polarization angle derived for the
scintillating component (S2) is very close to that of the steady
component, so the fluctuations due to the scintillation of this
component cannot produce a significant contribution
to the observed variations of the polarization angle.
Using these values,
we can derive the modeled Stokes parameters
 and
and
 from Eqs. (2) and (3). The modeled polarized
flux density
from Eqs. (2) and (3). The modeled polarized
flux density
 and polarization angle
 can then be derived through the relations:
![${{P_{\rm m}}(t)}=[{{Q_{\rm m}}(t)^2}+{{U_{\rm m}}(t)^2}]^{\frac{1}{2}}$](/articles/aa/full/2001/09/aa9909/img58.gif) ,
,
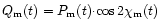 and
and
 .
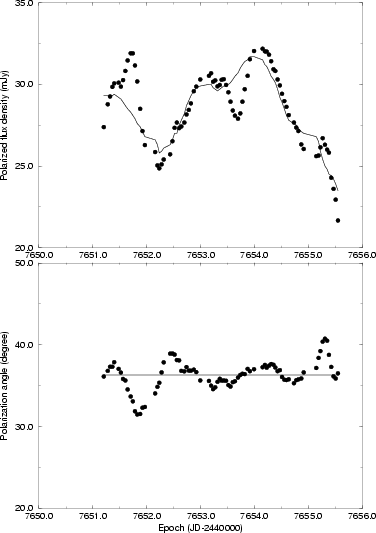
The results of model-fitting to the observed polarized
flux density and polarization angle are shown in Fig. 3.
.
The results of model-fitting to the observed polarized
flux density and polarization angle are shown in Fig. 3.
 |
Figure 3:
The model-fits to the polarized flux density
and polarization angle observed at 20cm by a two-component
model (one steady and one scintillating component).
Points - observation, solid line - model |
| Open with DEXTER |
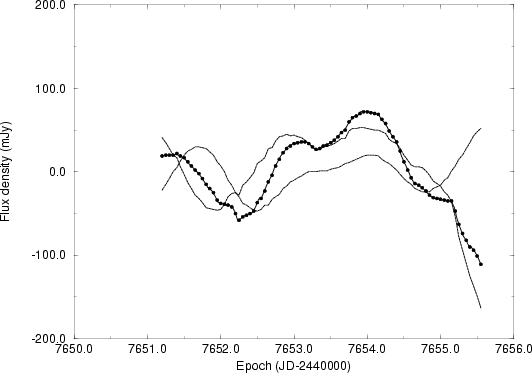
It can be seen that the two-component model can fit most
of the light curve of the observed polarized flux density. However,
there are two features (at epochs JD2447651.7 and JD2447653.6),
which deviate significantly from
the modeled light curve. Their maximal deviations are
3.5mJy and 3.0mJy (with a significance level
of 3 ), respectively.
Since the derived polarization angle of the scintillating component
(S2) is different from that of the steady component by only
,
the modeled light curve of the polarization angle is almost a
straight line. Therefore, the observed deviations of the polarization
angle (and also the residual features in the observed light curve
of the polarized flux density) could be due
to additional variable components.
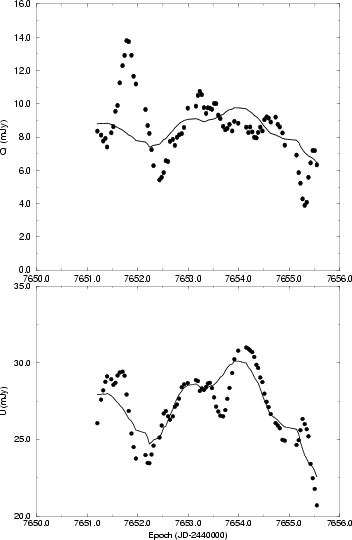
The model-fits to the Q- and U-light curves are shown in Fig. 4.
), respectively.
Since the derived polarization angle of the scintillating component
(S2) is different from that of the steady component by only
,
the modeled light curve of the polarization angle is almost a
straight line. Therefore, the observed deviations of the polarization
angle (and also the residual features in the observed light curve
of the polarized flux density) could be due
to additional variable components.
The model-fits to the Q- and U-light curves are shown in Fig. 4.
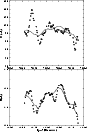 |
Figure 4:
The model-fits to the Q- and U-light curves with the same
model as in Fig. 3 |
| Open with DEXTER |
The root-mean-square fitting error is 1.76mJy (for Q) and
1.17mJy (for U).
It can be seen that the variations in Q closely follow the
variations in the polarization angle, i.e. Q increases (decreases)
while the polarization angle decreases (increases). This
characteristic can be easily understood, because for this IDV event
the Stokes parameter Q (
 (2)
and
(2)
and
 )
is most sensitive to the variations of the polarization angle.
In the observed Q-light curve the feature at epoch JD2447651.75
is clearly deviating from the model
)
is most sensitive to the variations of the polarization angle.
In the observed Q-light curve the feature at epoch JD2447651.75
is clearly deviating from the model![[*]](/icons/foot_motif.gif) . This feature corresponds
to the maximal deviations in the light curve of the polarization
angle (Fig. 3).
This may imply that there is an additional component,
which mainly causes the observed
variations of the polarization angle.
. This feature corresponds
to the maximal deviations in the light curve of the polarization
angle (Fig. 3).
This may imply that there is an additional component,
which mainly causes the observed
variations of the polarization angle.
In the observed U-light curve there are also a few features
(including that at epoch JD2447653.6) which significantly deviate
from the model. In contrast to Q,
the Stokes parameter U is not sensitive to variations in the
polarization angle. Thus the feature at epoch
JD2447653.6 appeared with
a slight variation of the observed polarization angle,
but the associated variations in
both U and polarized flux density P are significant.
From the model-fitting results given above, we
conclude that, one more scintillating component may be
needed to explain the residual variations in the flux density and
polarization with a smaller modulation amplitude and
a shorter time scale.
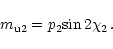
We now consider a three-component model: one steady component and
two scintillating components (S2 and S3). In this case
the basic equations for the Stokes parameters
(see Eqs. (1)-(3)) should be correspondingly modified to
include the contributions from the second scintillating
component as follows.
 |
(11) |
 |
(12) |
 |
(13) |
In these equations the quantities I0, Q0 and U0 may
be regarded as known constants which have been determined in the
two-component model. We then have four unknown constants
(
,
,
 ,
,
 )
and one time-series
)
and one time-series
 (or
(or
 )
to be solved.
Basically, this is a problem of decomposing the observed light
curve
into its two sub-components,
and
.
In general, there might be no unique solution for these
parameters. In dealing with the modeling of
the polarization variation at 6 cm, Rickett et al.
(1995) proposed a simplified model,
in which a simple time offset between the time-series of
the two scintillating components was assumed. Therefore, the
time-series
and
were obtained
from
through a procedure of Fourier
and inverse-Fourier transformation. The
remaining four parameters (
,
,
,
)
were then
determined from Eqs. (11)-(13)
by a least-square method.
However, in the present case, the angular sizes of the
two 20cm scintillating components
are significantly different and the relationship between
the two time-series may not reasonably be represented by a
simple time offset. Convolution of the scintillation pattern
with the brightness distribution of the two components may also
be involved. Therefore, we have to look for
an alternative way to solve
the problem for decomposing the observed light
curve
and consider some particular solutions.
On the basis of a comparison between the variations at 20cm
and at 6-11cm,
Rickett et al. (1995)
pointed out that
the source component causing the scintillation at 20cm is not
the source component causing the scintillation
at 2-11cm. They suggested that the scintillating
component at 2-11cm is associated with the VLBI compact
core (component-A, following the designation by Standke et al.
1996), while the 20cm scintillating component
is associated with a more extended component-D.
This scheme of two scintillating components
is just consistent with our analysis of the polarization
variability observed at 20cm, if we assume that
the second 20cm scintillating component is
associated with the compact core. Since the core component
has a smaller angular size and is optically thick at 20cm, its
scintillation could have a shorter timescale and a smaller
amplitude. This is consistent with the properties
required for the second scintillating component.
This reasonable assumption provides the possibility
that the 20cm time-series caused by the second scintillating
component (i.e.
)
can be obtained by
smoothing the 11cm time-series with an appropriate
time constant (
)
to be solved.
Basically, this is a problem of decomposing the observed light
curve
into its two sub-components,
and
.
In general, there might be no unique solution for these
parameters. In dealing with the modeling of
the polarization variation at 6 cm, Rickett et al.
(1995) proposed a simplified model,
in which a simple time offset between the time-series of
the two scintillating components was assumed. Therefore, the
time-series
and
were obtained
from
through a procedure of Fourier
and inverse-Fourier transformation. The
remaining four parameters (
,
,
,
)
were then
determined from Eqs. (11)-(13)
by a least-square method.
However, in the present case, the angular sizes of the
two 20cm scintillating components
are significantly different and the relationship between
the two time-series may not reasonably be represented by a
simple time offset. Convolution of the scintillation pattern
with the brightness distribution of the two components may also
be involved. Therefore, we have to look for
an alternative way to solve
the problem for decomposing the observed light
curve
and consider some particular solutions.
On the basis of a comparison between the variations at 20cm
and at 6-11cm,
Rickett et al. (1995)
pointed out that
the source component causing the scintillation at 20cm is not
the source component causing the scintillation
at 2-11cm. They suggested that the scintillating
component at 2-11cm is associated with the VLBI compact
core (component-A, following the designation by Standke et al.
1996), while the 20cm scintillating component
is associated with a more extended component-D.
This scheme of two scintillating components
is just consistent with our analysis of the polarization
variability observed at 20cm, if we assume that
the second 20cm scintillating component is
associated with the compact core. Since the core component
has a smaller angular size and is optically thick at 20cm, its
scintillation could have a shorter timescale and a smaller
amplitude. This is consistent with the properties
required for the second scintillating component.
This reasonable assumption provides the possibility
that the 20cm time-series caused by the second scintillating
component (i.e.
)
can be obtained by
smoothing the 11cm time-series with an appropriate
time constant (
 )
and scaling with
an appropriate amplitude factor (
)
and scaling with
an appropriate amplitude factor ( ).
Thus the time-series
can also be determined through Eq. (11).
Using the Eqs. (12), (13), we can then solve the polarization parameters (
,
)
and (
,
)
by a least-square method.
We consider the following cases, in which
a model time-series for
is obtained from the smoothing of the 11cm
time-series with
).
Thus the time-series
can also be determined through Eq. (11).
Using the Eqs. (12), (13), we can then solve the polarization parameters (
,
)
and (
,
)
by a least-square method.
We consider the following cases, in which
a model time-series for
is obtained from the smoothing of the 11cm
time-series with
 days and
 ,
and try to improve
the model-fitting to the observed
Q- and U- light curves. The choice of the values for
and
is based on the
consideration:
(1) Component S3 has a larger angular size at 20cm than
at 11cm and its scintillation at 20cm occurs in the strong
scattering regime; (2)
the scintillation timescale of component S3 is
significantly less than that of component S2;
(3) the modulation amplitude due to component S3 is
significantly smaller than that due to component S2
(see Table 1 below).
,
and try to improve
the model-fitting to the observed
Q- and U- light curves. The choice of the values for
and
is based on the
consideration:
(1) Component S3 has a larger angular size at 20cm than
at 11cm and its scintillation at 20cm occurs in the strong
scattering regime; (2)
the scintillation timescale of component S3 is
significantly less than that of component S2;
(3) the modulation amplitude due to component S3 is
significantly smaller than that due to component S2
(see Table 1 below).
Table 1:
Parameters derived for the two
scintillating components at 20cm
| Parameter |
Component S2 |
Component S3 |
| (mJy) |
48.0 |
22.5 |
 (day) (day) |
0.63 |
0.34 |
 |
0.042 |
0.020 |
 (km s-1) (km s-1) |
38.5 |
38.5 |
 (as) (as) |
120 |
65 |
| VLBI-component |
D |
A |
 (mas) (mas) |
1.3 |
0.22 |
 (mJy) (mJy) |
400 |
300 |
 (= (=
 ) ) |
0.12 |
0.075 |
SM(10-3.5
 kpc) kpc) |
0.26 |
0.26 |
 (as) (as) |
98.7 |
98.7 |
 (as) (as) |
15.3 |
15.3 |
 |
0.18 |
0.37 |
 (= (=
 ,
mJy) ,
mJy) |
267 |
60.8 |
 (= (=
 ) ) |
0.67 |
0.20 |
 (1012 K) (1012 K) |
3.7 |
2.8 |
 (H0=100km s (H0=100km s
 Mpc) Mpc) |
7.8 |
7.8 |
 (1011 K) (1011 K) |
4.7 |
3.6 |
- Case-1: The model 20cm time-series
is directly used to solve the four polarization
constants by a least-square method. It is found that
 and
and
 ,
with a
difference less than 15.
The model-fitting to the
observed light curves is almost completely similar to that
by the two-component model. Therefore,
this case is essentially equivalent to the two-component
model (with one scintillating component) presented in
Sect. 3. This may imply that the compact core at 20cm
is shifted along the jet by
optical depth effects, so we consider two more cases;
,
with a
difference less than 15.
The model-fitting to the
observed light curves is almost completely similar to that
by the two-component model. Therefore,
this case is essentially equivalent to the two-component
model (with one scintillating component) presented in
Sect. 3. This may imply that the compact core at 20cm
is shifted along the jet by
optical depth effects, so we consider two more cases;
- Case-2: The model time-series
is offset by
-0.40 days, making the prominent residual
polarization feature at epoch
JD2447651.75 (see Fig. 4) coincident with a minimum
in the model light curve.
This choice of the
time offset is mainly to obtain
a reasonable polarization degree (less than
10
or so) for the scintillating
component S3. The four polarization constants are determined
to be:
=0.0094,
=0.0422
(or p2=0.043,
=38
 );
=-0.0171,
=0.0312
(or p3=0.036,
);
=-0.0171,
=0.0312
(or p3=0.036,  =-30
=-30
 );
);
- Case-3: The model time-series
is offset by +0.15 days, making
the prominent residual polarization feature at JD2447651.75
coincident with a maximum in the model light curve.
The four polarization constants are determined to be:
=0.0147,
=0.0431 (or p2=0.046,
=35
);
=0.0336,
=0.0541
(or p3=0.064, =29
 ).
).
It can be seen that for the latter two cases, the
polarization constants
and
for the
scintillating component S2 are close to the values
obtained in the two component model. This
confirms the dominance of the scintillation caused by
component S2.
For both cases (case-2 and case-3)
the model fitting to the light curves
of Q and U (or  and )
is improved
over the two
component model, especially for the Q- and PA-light curves
during the period JD2447651.5-2447653.0. The main difference
between case-2 and case-3 is that in case-2 the
scintillating component
S3 has a polarization angle different from that of the
steady component by
and )
is improved
over the two
component model, especially for the Q- and PA-light curves
during the period JD2447651.5-2447653.0. The main difference
between case-2 and case-3 is that in case-2 the
scintillating component
S3 has a polarization angle different from that of the
steady component by
 ,
while in case-3
the difference in polarization angle is less than
,
while in case-3
the difference in polarization angle is less than
 .
This is related to the choice of the time offset for the model
time-series: in case-2 the prominent residual feature
(at epoch JD2447651.7) in the
Q-light curve corresponds to negative deviations in the
flux density, while in case-3 it corresponds to positive deviations
in the flux density.
Since the improvement
of the model-fitting in case-2 is very similar to that in
case-3,
only the results for case-3 are presented here.
In Fig. 5 we show the decomposition of the observed
flux density fluctuations.
.
This is related to the choice of the time offset for the model
time-series: in case-2 the prominent residual feature
(at epoch JD2447651.7) in the
Q-light curve corresponds to negative deviations in the
flux density, while in case-3 it corresponds to positive deviations
in the flux density.
Since the improvement
of the model-fitting in case-2 is very similar to that in
case-3,
only the results for case-3 are presented here.
In Fig. 5 we show the decomposition of the observed
flux density fluctuations.
 |
Figure 5:
Decomposition of the flux density fluctuation observed at
20cm: dashed line - scintillating component S2,
dot-dashed line - scintillating component S3, solid line -
sum of the two components, points - observation |
| Open with DEXTER |
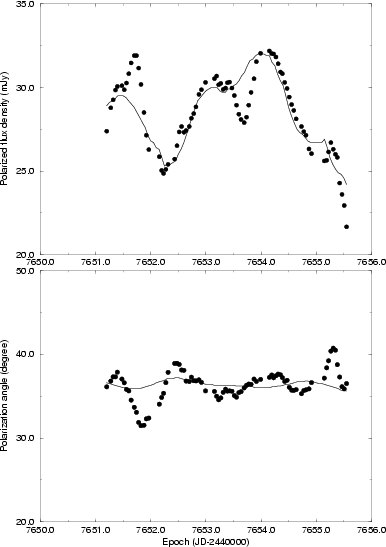
The model fitting to
the Q- and U-light curves and to the polarized flux density
and polarization angle are shown in Figs. 6 and 7, respectively.
 |
Figure 6:
The model-fitting to the observed Q- and U-light curves
by the three-component model. Points - observation,
dashed line - model (case-3) |
| Open with DEXTER |
 |
Figure 7:
The model-fitting to the observed
polarized flux density and
polarization angle light curves
observed at 20cm. Points - observation,
solid line - model |
| Open with DEXTER |
From the comparison of Fig. 6 with Fig. 4
it can be seen that
the fit with the 3-component model is improved over
the 2-component model, mainly for the
interval JD2447651.20-2447653.20. The
root-mean-square fitting error
is reduced by about 20
for Q, but only about 10
for U.
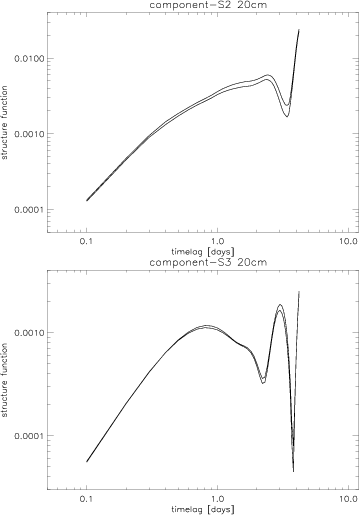
The structure functions for the variations caused by the two
scintillating components are shown in Fig. 8.
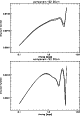 |
Figure 8:
Structure functions for the two 20cm scintillating
components S2 and S3 |
| Open with DEXTER |
From the structure
functions, it is found that the scintillation from the
component S2 has a time scale of 0.63 days and its root-mean-square fluctuation
of flux density (standard deviation )
is 48.0mJy
(or modulation index

 0.042
(normalized by the total
flux density of the source)). The
scintillation from the component S3 has a shorter
time scale of
0.34days and a smaller fluctuation amplitude of 22.5mJy
(or modulation index
0.042
(normalized by the total
flux density of the source)). The
scintillation from the component S3 has a shorter
time scale of
0.34days and a smaller fluctuation amplitude of 22.5mJy
(or modulation index
 0.020).
In addition, the
linear part of both
structure functions have a slope of 1.7, which might imply
that the interstellar medium consists of two components:
the continuous medium and a thin screen (Qian & Zhang
1996).
We point out that the two time-series (
and
,
Fig. 5) derived for the
scintillating components S2 and S3 are weakly correlated
with a correlation coefficient of <0.4.
This can be explained as
they are respectively associated with
the VLBI components D and A, which are separated along the jet
by 5mas. During the period of observation, the direction
of the projected Earth velocity
(position angle -(18-
0.020).
In addition, the
linear part of both
structure functions have a slope of 1.7, which might imply
that the interstellar medium consists of two components:
the continuous medium and a thin screen (Qian & Zhang
1996).
We point out that the two time-series (
and
,
Fig. 5) derived for the
scintillating components S2 and S3 are weakly correlated
with a correlation coefficient of <0.4.
This can be explained as
they are respectively associated with
the VLBI components D and A, which are separated along the jet
by 5mas. During the period of observation, the direction
of the projected Earth velocity
(position angle -(18-
 ))
was very closely to the jet direction
(position angle
))
was very closely to the jet direction
(position angle
 ).
Thus the separation of the two
scintillating components
is much larger than the angular scale of the
scattering pattern (0.1mas, see below) and no
significant correlation between the two time-series
should be expected.
In the previous section, we analysed the 20cm IDV event in
the scheme of a three-component model. Now we further discuss
the relationship between the two scintillating components and their
corresponding VLBI components. More information can be obtained
for the source components and
the interstellar medium in the direction towards 0917+624.
VLBI observations made by Standke et al. (1996) at multiple
frequencies (1.7, 2.3, 5, 8.3 and 22GHz during 1988-1993)
have shown that in 0917+
624 there are seven components, designated as A to G.
Components C, E, F and G are probably too extended
to scintillate at 20cm.
Component-A is the most compact (VLBI core) with its turnover
frequency at 7GHz.
Standke et al. (1996) pointed out that the optically
thick spectral index of the component-A is much less
than 2.5 and suggested that component-A is inhomogeneous
and might be a blend
of underlying subcomponents which are not resolved.
As Rickett et al. (1995) suggested, the intraday
variations at
2-11cm are due to scintillation of the
most compact component-A, in which there is a subcomponent having
an angular size of 70 as with 44
of the total
flux density of the source at 6cm. As shown above, we have
suggested that the 20cm
scintillating component S3 is associated with this VLBI
component. According to Standke et al.
its flux density at 20cm is about 300mJy (
).
Thus the separation of the two
scintillating components
is much larger than the angular scale of the
scattering pattern (0.1mas, see below) and no
significant correlation between the two time-series
should be expected.
In the previous section, we analysed the 20cm IDV event in
the scheme of a three-component model. Now we further discuss
the relationship between the two scintillating components and their
corresponding VLBI components. More information can be obtained
for the source components and
the interstellar medium in the direction towards 0917+624.
VLBI observations made by Standke et al. (1996) at multiple
frequencies (1.7, 2.3, 5, 8.3 and 22GHz during 1988-1993)
have shown that in 0917+
624 there are seven components, designated as A to G.
Components C, E, F and G are probably too extended
to scintillate at 20cm.
Component-A is the most compact (VLBI core) with its turnover
frequency at 7GHz.
Standke et al. (1996) pointed out that the optically
thick spectral index of the component-A is much less
than 2.5 and suggested that component-A is inhomogeneous
and might be a blend
of underlying subcomponents which are not resolved.
As Rickett et al. (1995) suggested, the intraday
variations at
2-11cm are due to scintillation of the
most compact component-A, in which there is a subcomponent having
an angular size of 70 as with 44
of the total
flux density of the source at 6cm. As shown above, we have
suggested that the 20cm
scintillating component S3 is associated with this VLBI
component. According to Standke et al.
its flux density at 20cm is about 300mJy (
 ).
The VLBI component-D, which is associated with the scintillating
component S2, has a flux density
400mJy (
).
The VLBI component-D, which is associated with the scintillating
component S2, has a flux density
400mJy (
 )
at 20cm.
We should point out that the 20cm flux densities
were derived
by Standke et al. by decomposing the integral spectrum and
could have large uncertainties.
In the following, we will use these values
to estimate some physical parameters
for the VLBI-components and the interstellar medium.
The formulae relevant to the derivation of the scintillation
parameters are given by Goodmann
(1997) and Narayan (1992), assuming that the
scattering medium is characteristic of Kolmogolov turbulence.
)
at 20cm.
We should point out that the 20cm flux densities
were derived
by Standke et al. by decomposing the integral spectrum and
could have large uncertainties.
In the following, we will use these values
to estimate some physical parameters
for the VLBI-components and the interstellar medium.
The formulae relevant to the derivation of the scintillation
parameters are given by Goodmann
(1997) and Narayan (1992), assuming that the
scattering medium is characteristic of Kolmogolov turbulence.
- (1) Scattered path length and transition frequency
First, as in the scintillation model of Rickett et al.,
the scattered path length d
is assumed to be 0.2kpc and
the frequency of transition (
 )
from weak to strong scattering
is assumed to be 4GHz;
)
from weak to strong scattering
is assumed to be 4GHz;
- (2) Scattering measure
Using the values given above,
the scattering
measure SM (in units of 10-3.5
 kpc)
of the interstellar scattering medium can be determined:
kpc)
of the interstellar scattering medium can be determined:
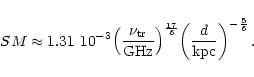 |
(14) |
We obtain
 .
.
- (3) Scattering angle
The scattering angle
 (as)
of the medium is given by the formula:
(as)
of the medium is given by the formula:
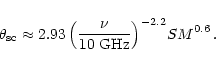 |
(15) |
Having the
value for SM, we can estimate the scattering angle at 20 cm
( GHz):
GHz):
 as.
The Fresnel angle
(as) is given by:
as.
The Fresnel angle
(as) is given by:
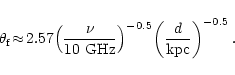 |
(16) |
We obtain
 as. Thus,
 and the scintillation
at 20cm occurs in the strong scattering regime.
and the scintillation
at 20cm occurs in the strong scattering regime.
- (4) Angular sizes of the scintillating components
The observed timescales
(days)
of the scintillating components are
related to their effective size
 (as),
the scattered path length d and the projected
relative velocity
(as),
the scattered path length d and the projected
relative velocity  (km s-1) between the Earth
and the scattering screen:
(km s-1) between the Earth
and the scattering screen:
 |
(17) |
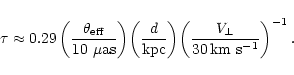
Here the effective angular size of the scintillating components
is given by:
![\begin{displaymath}{{\theta}_{\rm eff}\approx[{{{\theta}_{\rm s}}^2}+
{(0.71{{\theta}_{\rm sc}})^2}]^{0.5}}{\,{;}}
\end{displaymath}](/articles/aa/full/2001/09/aa9909/img134.gif) |
(18) |
(as) is the angular size
of the scintillating components.
From the time scales ( and
and  )
derived in the previous section for the
two scintillating components S2 and S3, the effective
angular sizes can be estimated to be
)
derived in the previous section for the
two scintillating components S2 and S3, the effective
angular sizes can be estimated to be
 139as (S2) and
 75as (S3). (During
the observing period the projected velocity of the Earth relative
to the scattering medium is about 38.5km s-1). Since
75as (S3). (During
the observing period the projected velocity of the Earth relative
to the scattering medium is about 38.5km s-1). Since
 ,
the intrinsic angular size of the scintillating
component S2 can be estimated from Eq. (18)
to be
,
the intrinsic angular size of the scintillating
component S2 can be estimated from Eq. (18)
to be
 as. For the scintillating component S3,
 ,
its intrinsic angular size cannot be estimated from Eq. (18); we assume that
,
its intrinsic angular size cannot be estimated from Eq. (18); we assume that


 65 as.
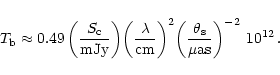
- (5) Modulation index
For the effective angular sizes obtained above, the modulation
index
for the scintillating components can be derived as
follows:
We obtain
 and
and
 for the scintillating
components S2 and S3 of 0.18 and
0.37 respectively.
Thus, the flux density (mJy) at 20cm
of the scintillating components is
obtained by:
for the scintillating
components S2 and S3 of 0.18 and
0.37 respectively.
Thus, the flux density (mJy) at 20cm
of the scintillating components is
obtained by:
 |
(20) |
They are
 mJy
and
mJy
and
 mJy. Thus,
the VLBI component-A contains a compact scintillating component
S3 with 20
(
mJy. Thus,
the VLBI component-A contains a compact scintillating component
S3 with 20
(
 )
of its flux density and the VLBI component-D
contains a compact scintillating component with 67
(
)
of its flux density and the VLBI component-D
contains a compact scintillating component with 67
(
 )
of its
flux density.
)
of its
flux density.
- (6) Apparent and intrinsic brightness temperatures
The apparent brightness temperature (K) for the
scintillating components can be derived as follows:
 |
(21) |
We obtain the apparent brightness temperature for the
scintillating component S2 and S3 to be
 K and
K and
 K respectively.
VLBI observations have shown that component-D
shows superluminal motion with an apparent
velocity 7.8c (c = speed of light; Hubble constant is assumed to be
H0=100km
K respectively.
VLBI observations have shown that component-D
shows superluminal motion with an apparent
velocity 7.8c (c = speed of light; Hubble constant is assumed to be
H0=100km

 ).
If the viewing angle is assumed to
be
).
If the viewing angle is assumed to
be
 (
( =
Lorentz factor of the superluminal motion), then the
Doppler factor 7.8. Thus the intrinsic
brightness temperature for the two scintillating components
can be estimated:
=
Lorentz factor of the superluminal motion), then the
Doppler factor 7.8. Thus the intrinsic
brightness temperature for the two scintillating components
can be estimated:
 |
(22) |
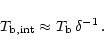
(Since the angular sizes of the source components are
derived from the scintillation theory, not from
the causality effect,
the transformation between the intrinsic and
apparent brightness temperature only involves
 ).
Thus we find
).
Thus we find
 and
and
 to be
4.71011K and 3.61011K. Both are significantly
below the inverse-Compton limit (1012K).
to be
4.71011K and 3.61011K. Both are significantly
below the inverse-Compton limit (1012K).
All these values derived above are summarized
in Table 1, in which
 denotes the
angular size of the VLBI components measured at 6 cm.
In summary, in the three-component model,
the VLBI component-D contains a very small
subcomponent with an angular size of 0.12mas and with
60
of its flux density at 20cm. This subcomponent
causes most of the scintillation. The VLBI component-A
contains a subcomponent with an angular size of 0.065mas
and with only 13
of its flux density.
This is consistent with the
results given by Standke et al. (1996) in which component-A
has an optically thick spectral index
denotes the
angular size of the VLBI components measured at 6 cm.
In summary, in the three-component model,
the VLBI component-D contains a very small
subcomponent with an angular size of 0.12mas and with
60
of its flux density at 20cm. This subcomponent
causes most of the scintillation. The VLBI component-A
contains a subcomponent with an angular size of 0.065mas
and with only 13
of its flux density.
This is consistent with the
results given by Standke et al. (1996) in which component-A
has an optically thick spectral index
 and
could be a blend of inhomogeneous components which are not
resolved. The scintillating component S3 is the optically
thick subcomponent at 20cm.
The most interesting result may be that,
for both the scintillating
components, the derived intrinsic brightness temperatures are
significantly below the inverse-Compton limit (1012 K).
This result is based on the adopted value for the Doppler
factor 7.8,
which is derived from the superluminal
velocity observed for the VLBI component-D, assuming that the
viewing angle is equal to 1/7
(where -
Lorentz factor of the motion). In other words, from the
analysis of the intraday variations at 20cm in the
scintillation model presented here,
the Doppler beaming factor in 0917+624
could still be quite large, i.e. both scintillation and
Doppler beaming may be involved in the IDV phenomenon.
Further VLBI observations would
be desirable to check this result and would help to constrain
the parameters of the interstellar medium.
Finally, we point out that even the proposed three-component
model seems incapable of fully fitting the residual features
in the polarization light curves, for example the feature at
epoch JD2447651.75 (see Fig. 6). Such a feature
could be due to another compact component scintillating
with a timescale less than 0.2 days. However, some kind of
low level intrinsic (intermittent) activity
cannot be ruled out (Qian et al. 2000a,b).
and
could be a blend of inhomogeneous components which are not
resolved. The scintillating component S3 is the optically
thick subcomponent at 20cm.
The most interesting result may be that,
for both the scintillating
components, the derived intrinsic brightness temperatures are
significantly below the inverse-Compton limit (1012 K).
This result is based on the adopted value for the Doppler
factor 7.8,
which is derived from the superluminal
velocity observed for the VLBI component-D, assuming that the
viewing angle is equal to 1/7
(where -
Lorentz factor of the motion). In other words, from the
analysis of the intraday variations at 20cm in the
scintillation model presented here,
the Doppler beaming factor in 0917+624
could still be quite large, i.e. both scintillation and
Doppler beaming may be involved in the IDV phenomenon.
Further VLBI observations would
be desirable to check this result and would help to constrain
the parameters of the interstellar medium.
Finally, we point out that even the proposed three-component
model seems incapable of fully fitting the residual features
in the polarization light curves, for example the feature at
epoch JD2447651.75 (see Fig. 6). Such a feature
could be due to another compact component scintillating
with a timescale less than 0.2 days. However, some kind of
low level intrinsic (intermittent) activity
cannot be ruled out (Qian et al. 2000a,b).
Acknowledgements
We thank I. I. K. Pauliny-Toth and T. Beckert
for critically reading the manuscript and valuable comments. We also thank the anonymous referee for enlightening suggestions.
SJQ thanks the Max-Planck-Institut für
Radioastronomie for hospitality and support during his visit.
-
Blandford, R., Narayan, R., & Romani, R. W. 1986, ApJ, 301, L53
In the text
NASA ADS
-
Dennett-Thorpe, J., & de Bruyn, A. G. 2000, ApJ, 529, L65
In the text
NASA ADS
-
Gabuzda, D. C., Kochanev, P. Yu., Cawthorne, T. V., & Kollgaard, R. I. 1999, in BL Lac Phenomenon,
ed. L. O. Takalo, & A. Sillanpää, ASP, San Francisco, 447
In the text
-
Goodmann, J. 1997, New Astron., 2, 449
In the text
NASA ADS
-
Heeschen, D. S., Krichbaum, T., Schalinski, C. J., & Witzel, A. 1987,
AJ, 94, 1493
In the text
NASA ADS
-
Kedziora-Chudzcer, L., Jauncey, D. L., Wieringa, M. H., et al.
1997, ApJ, 490, L9
In the text
NASA ADS
-
Kellermann, K. I., & Pauliny-Toth, I. I. K. 1969, ApJ, 155, L71
In the text
NASA ADS
-
Kochanev, P. Yu., & Gabuzda, D. C. 1998, in Radio Emission From
Galactic and Extragalactic Compact Sources,
ed. J. A. Zensus, G. B. Taylor,
& J. M. Wrobel, ASP, San Francisco, p. 273
In the text
-
Kraus, A., Krichbaum, T. P., & Witzel, A. 1999, in BL Lac Phenomenon, ed. L. O. Takalo,
& A. Sillanpää, ASP, San Francisco, 49
In the text
-
Krichbaum, T. P., Quirrenbach, A., Witzel, A., et al. 1992, in Variability in Blazars,
ed. E. Valtaoja,
& M. Valtonen (Cambridge Univ. Press, Cambridge), 331
In the text
-
Macquart, J. P., Kedziora-Chudczer, L., Rayner, D. P., & Jauncey, D. L. 2000, ApJ [astro-ph/0002192], in press
In the text
-
Marscher, A. P. 1996, in Proceedings of the Heidelberg Workshop on
Gamma-ray Emitting AGN, ed. J. G. Kirk, M. Camenzind, C. von Montigny,
& S. Wagner, MPIfK, Heidelberg, 103
In the text
-
Marscher, A. P. 1998, in
Radio Emission From Galactic and Extragalactic Compact Sources,
ed. J. A. Zensus, G. B. Taylor, & J. M. Wrobel, ASP, San Francisco, 25
In the text
-
Narayan, R. 1992, Phil. Trans. R. Soc. Lond. A, 341, 151
In the text
-
Qian, S. J., Quirrenbach, A., Witzel, A., et al. 1991, A&A, 241, 15
In the text
NASA ADS
-
Qian, S. J., Britzen, S., Witzel, A., et al. 1995, A&A, 295, 47
In the text
NASA ADS
-
Qian, S. J. 1994a, Acta Astron. Sin., 35, 362 (Transl.: Chin.
Astron., 1995, 19, 267)
In the text
-
Qian, S. J. 1994b, Acta Astrophys. Sin., 14, 333 (Transl.: Chin.
Astron., 1995, 19, 69)
In the text
-
Qian, S. J., Li, X. C., Wegner, R., et al. 1996, Chin. Astron., 20, 15
In the text
-
Qian, S. J., & Zhang, X. Z. 1996, Acta Astron. Sin., 37, 421
(Transl.: Chin. Astron., 1997, 21, 162)
In the text
-
Qian, S. J., Kraus, A., Witzel, A., et al. 2000a, A&A, 357, 84
In the text
NASA ADS
-
Qian, S. J., Kraus, A., Krichbaum, T. P., et al. 2000b, in Proceedings of
IAU Colloquium 182, April 2000, Quiyang, China, in press
In the text
-
Quirrenbach, A., Witzel, A., Krichbaum, T. P., et al. 1992,
A&A, 258, 279
In the text
NASA ADS
-
Quirrenbach, A., Witzel, A., Qian, S. J., et al. 1989, A&A, 226, L1
In the text
NASA ADS
-
Quirrenbach, A., Kraus, A., Witzel, A., et al. 2000, A&AS, 141, 221
In the text
NASA ADS
-
Rickett, B. J. 1990, ARA&A, 28, 561
In the text
NASA ADS
-
Rickett, B. J., Quirrenbach, A., Wegner, R., et al.
1995, A&A, 293, 479
In the text
NASA ADS
-
Romero, G. E., Combi, J. A., Benaglia, P., et al. 1997, A&A, 326 77
In the text
NASA ADS
-
Spada, M., Salvati, M., & Pacini, F. 1999, ApJ, 511, 136
In the text
NASA ADS
-
Standke, K. J., Quirrenbach, A., Krichbaum, T. P., et al.
1996, A&A, 306, 27
In the text
NASA ADS
-
Wagner, S., & Witzel, A. 1995, ARA&A, 33, 163
In the text
NASA ADS
-
Wagner, S. J., Witzel, A., Heidt, J., et al. 1996, AJ, 111, 2187
In the text
NASA ADS
-
Witzel, A. 1992, in Physics of
Active Galactic Nuclei, ed. W. J. Duschl, & S. Wagner (Springer, Heidelberg), 484
In the text
Copyright ESO 2001