A new digital spectrograph for obtaining a dynamic spectrum of radio burst emission from the Sun in the frequency range 30-80 MHz has been recently commissioned at the Gauribidanur Radio Observatory (Lat: 13
A&A 367, 1112-1116 (2001)
DOI: 10.1051/0004-6361:20000540
E. Ebenezer - R. Ramesh - K. R. Subramanian - M. S. SundaraRajan - Ch. V. Sastry
Indian Institute of Astrophysics, Bangalore 560 034, India
Received 4 August 2000 / Accepted 4 December 2000
Abstract
A new digital spectrograph for obtaining a dynamic spectrum of
radio burst emission from the Sun in the frequency range 30-80 MHz
has been recently commissioned
at the Gauribidanur Radio Observatory
(Lat: 13![]() 36
36![]() 12
12
![]() N and Long: 77
N and Long: 77![]() 27
27![]() 07
07
![]() E),
about 100 km north of Bangalore, India.
This paper describes various aspects of the antenna system, frontend
receiver and digital hardware of the spectrograph.
Some of the initial results obtained with the instrument are also
presented.
E),
about 100 km north of Bangalore, India.
This paper describes various aspects of the antenna system, frontend
receiver and digital hardware of the spectrograph.
Some of the initial results obtained with the instrument are also
presented.
Key words: Sun: Corona; radio radiation - instrumentation: spectrograph
The Indian Institute of Astrophysics recently began operating a new digital spectrograph at the Gauribidanur radio observatory (Sastry 1995), to observe radio burst emission from the Sun in the frequency range 30-80 MHz. It works on the principle of measuring the autocorrelation function of the input signal, and then Fourier transforming it to obtain its power spectrum. To our knowledge, this is the first time a solar radio spectrograph based on the above principle is implemented. This instrument is expected to play a useful role, particularly during the maximum of the present solar cycle (Cycle 23), since we have the unique opportunity to also locate the position of the burst sources using two-dimensional images obtained with the existing Gauribidanur radioheliograph (GRH, Ramesh et al. 1998) in the frequency range 40-150 MHz.
The basic receiving element used in the present system is a Log periodic
dipole (LPD) which has an almost continuous coverage of a wide range
of frequencies.
Its effective collecting
area is about 0.5
![]() ,
and has a
characteristic impedance of
,
and has a
characteristic impedance of
![]()
![]() .
The dipoles are made of aluminium tubes and
are designed to operate
in the frequency range 40-150 MHz with a VSWR < 2, and a
directional gain of 8 dB.
The measured half-power beamwidths of the LPD are approximately
.
The dipoles are made of aluminium tubes and
are designed to operate
in the frequency range 40-150 MHz with a VSWR < 2, and a
directional gain of 8 dB.
The measured half-power beamwidths of the LPD are approximately
![]() in the E-plane
and
in the E-plane
and
![]() in the H-plane, enabling observations to be carried
out over a wide range of hour angle and declination (Ramesh 1999).
in the H-plane, enabling observations to be carried
out over a wide range of hour angle and declination (Ramesh 1999).
At present, the R.F. signal
from one of the antenna groups in the east-west arm of the GRH
forms the input to the spectrograph.
The group consists of 8 LPDs with an inter-element spacing of 10 m.
The elements are oriented in the east-west direction and they accept linear
polarisation in that direction (Fig. 1).
The R.F. output from each element
is passed through a high pass filter and then amplified in a
broadband amplifier of noise figure ![]() 300 K.
The high pass filter is used to cut off large interfering signals
at frequencies <40 MHz which otherwise might give
rise to spurious intermodulation products. In addition, it also reduces the
dynamic range requirements on the subsequent stages of electronics.
The various individual LPDs
in the group are connected using RG8U cables and power combiners
300 K.
The high pass filter is used to cut off large interfering signals
at frequencies <40 MHz which otherwise might give
rise to spurious intermodulation products. In addition, it also reduces the
dynamic range requirements on the subsequent stages of electronics.
The various individual LPDs
in the group are connected using RG8U cables and power combiners
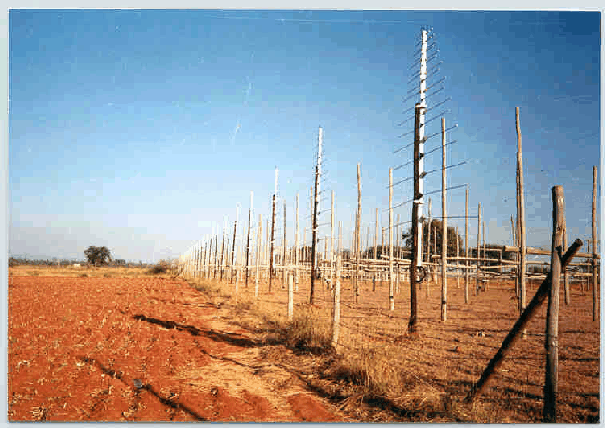 |
Figure 1: East-West arm of the GRH |
| Open with DEXTER | |
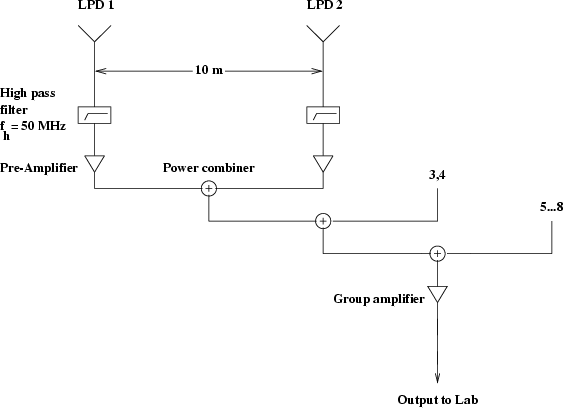 |
Figure 2: Array configuration |
| Open with DEXTER | |
In the receiver building, the R.F. signal from the field
goes through a series of amplification and mixing operations
before fed into the digital receiver.
It is first up-converted to an intermediate frequency (I.F.)
of 170 MHz. This conversion
places all the image frequencies well above the frequency of observation.
The different R.F. signals are selected
by sweeping the first local oscillator (L.O.)
to different frequencies from 200 to 250 MHz, in steps of 1 MHz. The
dwell time
at each frequency is about 64 msec. The I.F. signal is amplified and
passed through a bandpass
filter with a center frequency (![]() )
of 170 MHz and a bandwidth
(
)
of 170 MHz and a bandwidth
(
![]() )
of 6 MHz to suppress the possible spurious pick-ups through harmonics.
Then it is
down-converted to a 2nd I.F. of 10 MHz
by mixing with a fixed L.O. of 180 MHz. The output is again
amplified and passed through a band pass filter with
)
of 6 MHz to suppress the possible spurious pick-ups through harmonics.
Then it is
down-converted to a 2nd I.F. of 10 MHz
by mixing with a fixed L.O. of 180 MHz. The output is again
amplified and passed through a band pass filter with
![]() MHz
and
MHz
and
![]() MHz to minimize contributions from
unwanted signals at
other frequencies. Figure 3
shows the schematic of the
analog frontend reciever. The present
minimum detectable flux density of the system
is about
2000 Jy (1 Jy =
MHz to minimize contributions from
unwanted signals at
other frequencies. Figure 3
shows the schematic of the
analog frontend reciever. The present
minimum detectable flux density of the system
is about
2000 Jy (1 Jy =
![]() )
at f=80 MHz, and for an integration time of 64 msec.
This enables us to carry out observations of radio emission from the
"quiet" Sun also (Fig. 7).
)
at f=80 MHz, and for an integration time of 64 msec.
This enables us to carry out observations of radio emission from the
"quiet" Sun also (Fig. 7).
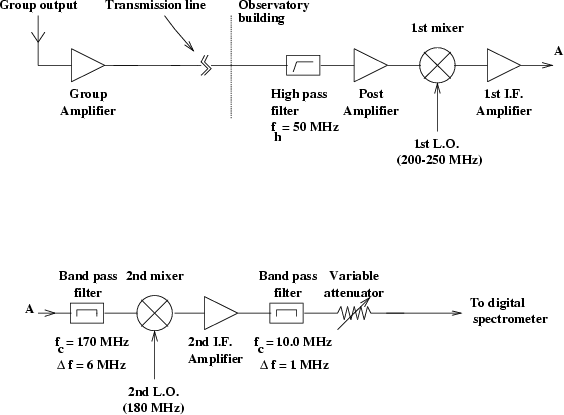 |
Figure 3: Schematic diagram of the analog frontend receiver |
| Open with DEXTER | |
In the digital receiver,
the 10 MHz I.F. signals are first quantised
to two levels using a zero crossing detector (AD 790).
Its output is a TTL signal corresponding to whether the input I.F. signal is
below the "ground" level or above it.
The quantised signal is sampled (the sampling rate used in the present case
is 2 MHz)
in a dual D-type positive edge triggered flip-flop
(74LS74), and its output is then passed through a delay circuit.
Figure 4 shows the block diagram of the digitizer (quantiser + sampler)
used in the spectrograph.
| |
Figure 4: Block diagram of the 1-bit digitizer |
| Open with DEXTER | |
As mentioned earlier, the power spectrum of the
input signal in the present case is
estimated by measuring its
autocorrelation function (Weinreb 1963). To carry out this, the
sampler output
is fed to a set of two 8-bit
serial-shift registers (74LS164)
which converts each sampled data into a 16-bit
stream (Boxes S-A & B-J in Fig. 5).
The shift registers are clocked at the
sampling rate, and the
8th bit of the first unit (Box A in Fig. 5)
is taken as the reference.
This implies that the adjacent data bits
lag/lead each other by ![]() sec, and the
various delay values
range from
sec, and the
various delay values
range from ![]() to
to ![]() ,
where
,
where ![]() = 0.5
= 0.5 ![]() sec.
This arrangement gives a frequency resolution
of
sec.
This arrangement gives a frequency resolution
of ![]() 125 KHz in the final power spectrum.
125 KHz in the final power spectrum.
| |
Figure 5: Delay setup |
| Open with DEXTER | |
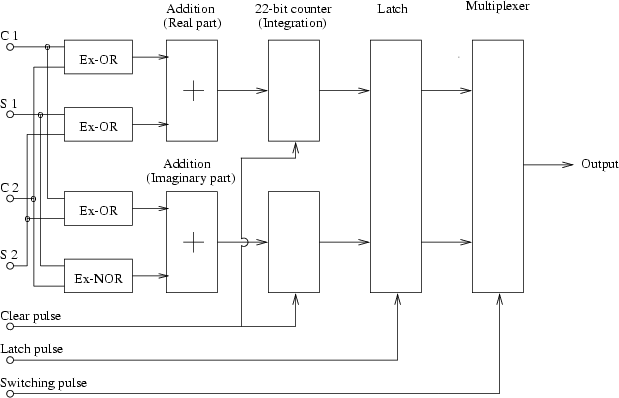 |
Figure 6: An elementary circuit of the correlator chip |
| Open with DEXTER | |
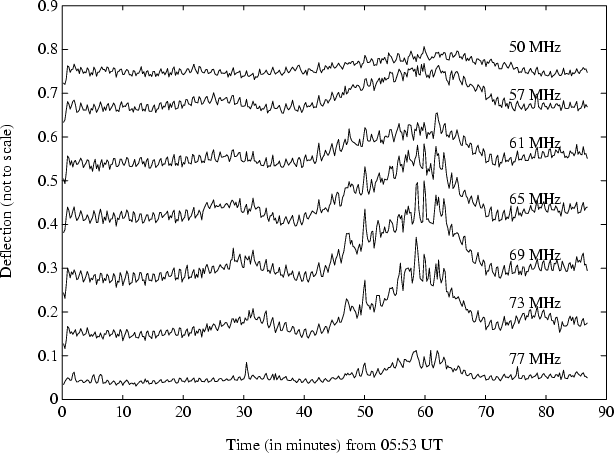 |
Figure 7: Radio emission from the "quiet" Sun observed on April 4, 2000 |
| Open with DEXTER | |
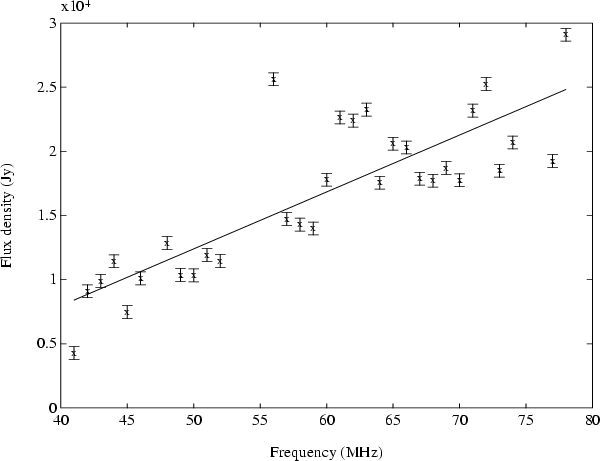 |
Figure 8: Flux density of the "quiet" Sun observed on April 4, 2000 at different frequencies in the range 40-80 MHz. The error involved in the measurement is also shown. The straight line is the least squares fit to the measured values |
| Open with DEXTER | |
The correlator chip used in our spectrograph
was basically designed for measuring the complex visibility of a radio source
in an interferometer array.
These are custom built chips using the
CMOS gate array technology. The architecture of the chip is shown
in Fig. 6. The output of the cosine correlator
is
![]() and
that of the sine correlator is
and
that of the sine correlator is
![]() ,
where C1, C2 and S1, S2
are the cosine and sine inputs
to the correlator from the two antennas of an interferometer,
respectively.
In the present case, the chip is used in the
autocorrelation mode, and only the first
of the above two outputs
from each chip is read. The sine inputs S1 & S2 are forced to zero.
As mentioned in the earlier section, the sampler output is delayed by various
values ranging from
,
where C1, C2 and S1, S2
are the cosine and sine inputs
to the correlator from the two antennas of an interferometer,
respectively.
In the present case, the chip is used in the
autocorrelation mode, and only the first
of the above two outputs
from each chip is read. The sine inputs S1 & S2 are forced to zero.
As mentioned in the earlier section, the sampler output is delayed by various
values ranging from
![]() to
to ![]() by passing through a set of two 8-bit
shift registers. Each bit from the latter
is correlated with the reference bit (the 8th bit of the
first shift-register) to yield the autocorrelation function
of the input signal for a particular time t.
Likewise, the
autocorrelation values corresponding to the various samples
are measured, and
are accumulated in a counter for a pre-determined length
of time (integration time). Later, the output of the counter (the
correlation count
for a particular integration period)
is read into the computer. The stored data is Fourier
transformed offline to obtain the power spectrum of the
R.F. signal selected by the L.O.
Note that at any given time the spectrum is obtained
for only a small bandwidth (1 MHz). To obtain the spectrum for the entire
band from 30-80 MHz, we change the L.O.
to different frequencies (200-250 MHz),
as mentioned earlier.
by passing through a set of two 8-bit
shift registers. Each bit from the latter
is correlated with the reference bit (the 8th bit of the
first shift-register) to yield the autocorrelation function
of the input signal for a particular time t.
Likewise, the
autocorrelation values corresponding to the various samples
are measured, and
are accumulated in a counter for a pre-determined length
of time (integration time). Later, the output of the counter (the
correlation count
for a particular integration period)
is read into the computer. The stored data is Fourier
transformed offline to obtain the power spectrum of the
R.F. signal selected by the L.O.
Note that at any given time the spectrum is obtained
for only a small bandwidth (1 MHz). To obtain the spectrum for the entire
band from 30-80 MHz, we change the L.O.
to different frequencies (200-250 MHz),
as mentioned earlier.
In this section, we present observations on the "quiet" Sun carried out with the spectrograph on April 4, 2000. Figure 7 shows the observed drift scan on this day at a few selected frequencies. It can be seen that the intensity rises above the background around 06:40 UT, reaches a maximum at 06:53 UT, and falls back at 07:05 UT. The Sun was "quiet", and no burst emission was seen in our data. The observations were calibrated using the cosmic radio source Cas "A", and the measured flux density at different frequencies is shown in Fig. 8. The estimated average spectral index is 2.98. The error in the flux density values is mainly due to the difference in the declination between the Sun and the calibrator, and is expected to be approximately 10% at all the frequencies. Figure 9 shows the radioheliogram obtained with the GRH on April 4, 2000 at 109 MHz. The Sun was "quiet", and no strong, localised, non-thermal sources were seen in our data. The observed peak brightness temperature was 1.2 106 K.
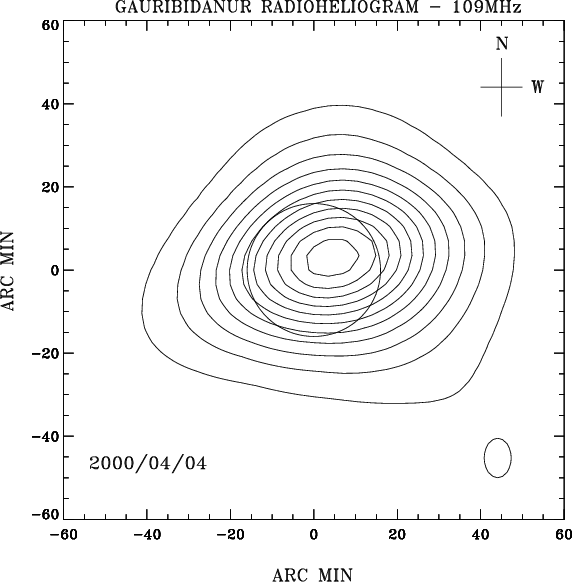 |
Figure 9: Radioheliogram obtained with the GRH on April 4, 2000. The open circle at the center is the solar limb. The instrumental beam is shown at the bottom right hand corner |
| Open with DEXTER | |
In this section we present a
radio burst event observed on March 5, 2000 with our spectrograph.
The observed dynamic spectrum on this day is shown in Fig. 10.
One can clearly notice a
drift in the observed intensity from 80 to 30 MHz,
starting around 06:48:40 UT.
The calculated drift rate (![]() 10 MHz/s) suggests
that it might be a type III radio burst.
Figure 11 shows the radioheliogram obtained with the GRH on March 5, 2000
around 06:50 UT.
10 MHz/s) suggests
that it might be a type III radio burst.
Figure 11 shows the radioheliogram obtained with the GRH on March 5, 2000
around 06:50 UT.
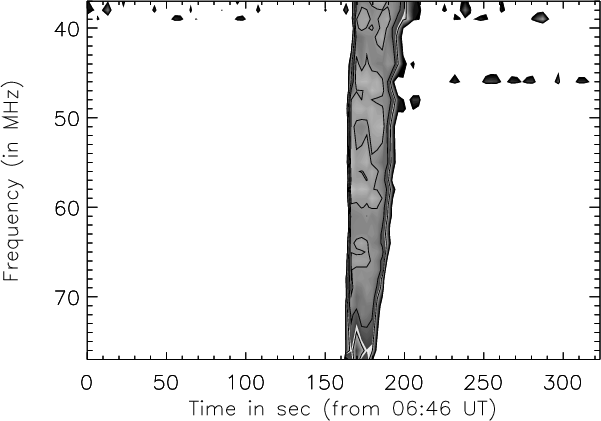 |
Figure 10: Radio burst emission from the Sun observed on March 5, 2000 |
| Open with DEXTER | |
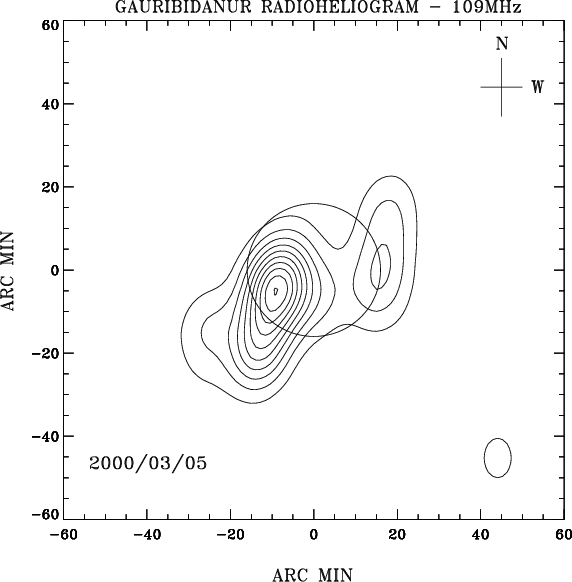 |
Figure 11: Radioheliogram obtained with the GRH on March 5, 2000 |
| Open with DEXTER | |
According to the Solar Geophysical Data
(April 2000), a SF/C4.2 class white-light/X-ray flare was observed
on that day from 06:47-06:53 UT with a maximum
at 06:51 UT.
The event took place at the heliographic location S12 E41, and
was associated with the active region NOAA 8898. One can notice
that there is a good
positional correspondence between the flare site and the intense
radio source in the south-east quadrant in Fig. 11. It is
possible that the latter might be
the location of the radio burst in Fig. 10 since it is well established
that there is a close
correspondence between flares and type III radio bursts
(Kundu 1965).
Also no other strong, non-thermal radio source(s) were observed
on the Sun that day with the GRH.
The estimated brightness temperature (![]() )
of the source is about 7 108 K.
The weak source
close to the west limb in Fig. 11 is a noise storm continuum, and
its
)
of the source is about 7 108 K.
The weak source
close to the west limb in Fig. 11 is a noise storm continuum, and
its ![]() is
is
![]() 5 106 K.
5 106 K.
As mentioned earlier,
presently the spectrograph is connected to one of the antenna groups
in the east-west arm of the existing heliograph in the Gauribidanur radio
observatory. Work is in progress to connect the instrument to a stand
alone antenna system which would allow longer
observation duration (![]() 6 hrs). Also, it is planned to increase the
bandwidth of the spectrograph to about 300 MHz. The present instrument
is mainly to show that it is practically possible to obtain a dynamic spectrum
of the solar radio bursts by a Fourier transformation of
the autocorrelation function
of the input signal. Table 1 lists the various
low frequency solar radio spectrographs in operation at present (data
taken from Aurass 1999).
Except for the Gauribidanur
instrument, all the others use an analog configuration (spectrum analysers,
multi-channel spectrograph, sweep spectrograph, etc.) to observe
radio burst emission
from the Sun (Boischot et al. 1980; Mann et al. 1992; Kondo et al. 1995;
Krüger & Voigt 1995;
Prestage 1995; Erickson 1997).
6 hrs). Also, it is planned to increase the
bandwidth of the spectrograph to about 300 MHz. The present instrument
is mainly to show that it is practically possible to obtain a dynamic spectrum
of the solar radio bursts by a Fourier transformation of
the autocorrelation function
of the input signal. Table 1 lists the various
low frequency solar radio spectrographs in operation at present (data
taken from Aurass 1999).
Except for the Gauribidanur
instrument, all the others use an analog configuration (spectrum analysers,
multi-channel spectrograph, sweep spectrograph, etc.) to observe
radio burst emission
from the Sun (Boischot et al. 1980; Mann et al. 1992; Kondo et al. 1995;
Krüger & Voigt 1995;
Prestage 1995; Erickson 1997).
| Location | Range | Resolution | |
| temporal | spectral | ||
| (MHz) | (s) | (
|
|
| Bruny Island (Australia) | 37-3 | 3 | 0.05 |
| Culgoora (Australia) | 1800-18 | 3 | -0.5 |
| Hiraiso (Japan) | 2500-25 | 3 | 0.1 |
| Gauribidanur (India) | 80-30 | 3 | 0.25 |
| IZMIRAN (Russia) | 240-45 | 0.1 | - |
| Nancay (France) | 75-25 | 0.1 | > 0.2 |
| Tremsdorf (Germany) | 800-40 | 0.1 | 0.23 |
| USAF (USA, Network) | 80-30 | 3 | - |
We have built a new digital radio spectrograph
to obtain a dynamic spectrum of the transient burst emission
from the solar corona in the frequency range 30-80 MHz i.e.,
at distances of about 1.2-1.6 ![]() from the
center of the Sun.
The two main advantages of the present system
over the existing conventional solar radio spectrographs are:
(i) it allows the
user to select
frequency bands which are completely free of inteference, and
(ii) the desired spectral accuracy can be achieved by just changing
the delay resolution in the digital receiver.
This instrument is expected
to play a useful role particularly during the maximum of the
present solar cycle
(Cycle 23) since
we have the unique opportunity
to also locate the position
of the burst sources using two-dimensional images obtained with
the GRH.
A multi-wavelength collaborative
study using data obtained with ground-based instruments, and those on
board space missions
like YOHKOH, WIND,
SOHO, etc. is expected to be helpful in understanding
the physics of the Sun, more clearly.
from the
center of the Sun.
The two main advantages of the present system
over the existing conventional solar radio spectrographs are:
(i) it allows the
user to select
frequency bands which are completely free of inteference, and
(ii) the desired spectral accuracy can be achieved by just changing
the delay resolution in the digital receiver.
This instrument is expected
to play a useful role particularly during the maximum of the
present solar cycle
(Cycle 23) since
we have the unique opportunity
to also locate the position
of the burst sources using two-dimensional images obtained with
the GRH.
A multi-wavelength collaborative
study using data obtained with ground-based instruments, and those on
board space missions
like YOHKOH, WIND,
SOHO, etc. is expected to be helpful in understanding
the physics of the Sun, more clearly.
Acknowledgements
We thank Prof. R. Cowsik, Director, Indian Institute of Astrophysics for his kind support to the Gauribidanur radio astronomy project. A. T. Abdul Hameed, C. Nanje Gowda, G. N. Rajasekara, A. Anwar Saheb, and D. Babu are thanked for their help in the construction of the antenna and receiver system.