A&A 366, 387-394 (2001)
DOI: 10.1051/0004-6361:20000108
S. Lopez1 - J. Maza1 - J. Masegosa2 - I. Marquez2
1 - Departamento de Astronomía, Universidad de Chile, Casilla 36-D,
Santiago, Chile
2 -
Instituto de Astrofísica de Andalucía, C/Camino Bajo de Huetor 24, 18080 Granada, Spain
Received 27 July 2000 / Accepted 14 November 2000
Abstract
We present FWHM = 5 to 8 Å optical spectra of nine previously
unknown quasars (QSOs) drawn from the Calan/Tololo Survey. We have
chosen this sample based on QSO redshift, z>3, and the presence of
either candidate damped Ly![]() (DLA) or Lyman-limit (LL) systems
in their spectra. The spectra show at least 9 DLA systems at
redshifts
2.25<z<3.26, which are identified by the shape and
strength of the H I-Ly
(DLA) or Lyman-limit (LL) systems
in their spectra. The spectra show at least 9 DLA systems at
redshifts
2.25<z<3.26, which are identified by the shape and
strength of the H I-Ly![]() absorption line, by the presence
of Ly
absorption line, by the presence
of Ly![]() and low-ionization metal lines at the same redshift, and
- in most cases - by the observed Lyman-break.
We thus provide the astronomical community with new interesting
targets for high resolution spectroscopy on large telescopes.
We describe all the spectra with emphasis on the most outstanding DLA and LL
systems found.
and low-ionization metal lines at the same redshift, and
- in most cases - by the observed Lyman-break.
We thus provide the astronomical community with new interesting
targets for high resolution spectroscopy on large telescopes.
We describe all the spectra with emphasis on the most outstanding DLA and LL
systems found.
Key words: cosmology: observations - quasars: individual: CTQ 247, CTQ 298, CTQ 314, CTQ 325, CTQ 408, CTQ 460, CTQ 476, CTQ 1005, CTQ 1061 - quasars: general - absorption lines
The use of QSOs as background sources for the study of the absorption
systems present in their spectra has proven to be the most sensitive
method to detect baryonic gas in the high-redshift Universe. High
resolution (
![]() kms-1) spectra taken with 10m-class
telescopes allow one to probe the diffuse absorbing gas from
H I column densities of
kms-1) spectra taken with 10m-class
telescopes allow one to probe the diffuse absorbing gas from
H I column densities of
![]() cm-22 of the
intergalactic medium to H I column densities of
cm-22 of the
intergalactic medium to H I column densities of
![]() cm-22 of the interstellar medium of high-zgalaxies, over a significant fraction of the Hubble time.
cm-22 of the interstellar medium of high-zgalaxies, over a significant fraction of the Hubble time.
The relevant technical information to make such studies feasible is
the amount of QSO flux that remains unabsorbed in its path to the
telescope. Indeed, already at low resolution (
![]() kms-1)
one is able to identify unambiguously at least those absorption
systems at the dense limit of the H I column density scale:
Lyman-limit (LL) systems, with
kms-1)
one is able to identify unambiguously at least those absorption
systems at the dense limit of the H I column density scale:
Lyman-limit (LL) systems, with
![]() cm-22,
which probably arise in gas associated with galactic halos (e.g.,
Lanzetta et al. 1996),
and damped Ly
cm-22,
which probably arise in gas associated with galactic halos (e.g.,
Lanzetta et al. 1996),
and damped Ly![]() (DLA) systems, with
(DLA) systems, with
![]() cm-22. The latter are similar column densities as found in neutral
clouds of the Milky
Way, a reason to believe that high-z DLA systems are the
probable progenitors of present-day galaxies (e.g.,
Wolfe 1993). If DLA systems trace most of the neutral gas
content in the high redshift Universe, they can also be used to trace
the evolution of star-forming galaxies through the cosmological mass
density
cm-22. The latter are similar column densities as found in neutral
clouds of the Milky
Way, a reason to believe that high-z DLA systems are the
probable progenitors of present-day galaxies (e.g.,
Wolfe 1993). If DLA systems trace most of the neutral gas
content in the high redshift Universe, they can also be used to trace
the evolution of star-forming galaxies through the cosmological mass
density
![]() (Rao & Turnshek 2000;
Storrie-Lombardi & Wolfe 2000) and metallicity Z(Prochaska & Wolfe 1999).
(Rao & Turnshek 2000;
Storrie-Lombardi & Wolfe 2000) and metallicity Z(Prochaska & Wolfe 1999).
In this Paper we present 9 new FWHM =5 to 8 Å
QSO spectra that show strong evidence for the presence of either
LL or DLA systems. The targets were
drawn from the sub-sample of z>3 QSOs discovered in the
course of the Calan/Tololo Survey (CTS).
The CTS (Maza et al. 1993) is an objective
prism survey of 16<B<20 southern QSOs. To date, 500 QSOs have been
published (Maza el al. 1996, and references therein), 400 have
been confirmed (not yet published) and a large number of candidates
still await for follow-up spectroscopy. Although no completitude
studies have been presented yet, three important differences between
the CTS and similar surveys are worth mentioning: the exposure times
of 90 min are relatively high, the prism dispersion is low
(180 nm at H![]() ), and the QSO candidate selection is made
by-eye. These features translate into a very faint magnitude limit of
), and the QSO candidate selection is made
by-eye. These features translate into a very faint magnitude limit of
![]() (the Hamburg/ESO Survey, as an example, reaches
(the Hamburg/ESO Survey, as an example, reaches
![]() ;
Reimers et al. 1997). In addition, the candidate
selection by-eye using a 12
;
Reimers et al. 1997). In addition, the candidate
selection by-eye using a 12![]() microscope allows one to detect
Ly
microscope allows one to detect
Ly![]() down to the IIIaJ plate red limit at
down to the IIIaJ plate red limit at
![]() nm; this translates into a redshift upper limit for the CTS of
nm; this translates into a redshift upper limit for the CTS of
![]() .
Seven of the QSOs that we present here have already
been published by the CTS (though no spectra were shown; see Maza et al.
1995 and references therein), while the other two are new
discoveries.
.
Seven of the QSOs that we present here have already
been published by the CTS (though no spectra were shown; see Maza et al.
1995 and references therein), while the other two are new
discoveries.
The spectra were obtained at three different telescopes (see Table 1).
CTQ 408 and CTQ 247 were observed at the CTIO Blanco 4 m telescope on the
night of October 8 1999. The R-C grating spectrograph at
the f/7.8 R-C focus equipped with grating KPGL-2 and a LORAL
![]() CCD
were used. This configuration yields a dispersion of 1.9 Å/pixel and
a wavelength coverage in first order of [3300, 8700] Å. Total exposure
time was 2700 sec for each object. A slit width of 1
CCD
were used. This configuration yields a dispersion of 1.9 Å/pixel and
a wavelength coverage in first order of [3300, 8700] Å. Total exposure
time was 2700 sec for each object. A slit width of 1
![]() 5 was
used for the two objects at a typical seeing of
5 was
used for the two objects at a typical seeing of
![]() .
.
CTQ 1061 and CTQ 1005, originally selected as candidates for
H II galaxies, were identified as high redshift QSOs during an
observing run executed between January 28 and 30 1998 using the Boller
& Chivens spectrograph on the ESO 1.52 m telescope. Grating #15 and
a
![]() pixel LORAL CCD were used. This configuration gives
a dispersion of 3.9 Å/pixel and a wavelength coverage of
[3500, 10500] Å. Total exposure time was 1800 sec for each
object. The seeing was
pixel LORAL CCD were used. This configuration gives
a dispersion of 3.9 Å/pixel and a wavelength coverage of
[3500, 10500] Å. Total exposure time was 1800 sec for each
object. The seeing was
![]() -
-
![]() .
.
CTQ 460, CTQ 298, CTQ 314, CTQ 325, and CTQ 476 were observed as part
of an ongoing Survey of DLA systems (see Sect. 4). On
the night of April 8 2000 we used Grism #7 of EFOSC2 on the ESO 3.6 m
telescope, a configuration that provided a resolution of FWHM =5.2 Å and spectral coverage [3200, 5200] Å. Total exposure times
ranged between 1200 and 2400 sec. The seeing ranged between
![]() and
and
![]() .
.
After bias-subtracting and flat-fielding, all spectra were extracted
using an algorithm that attempts to reduce the statistical noise to a
minimum. Briefly stated, the seeing profile is fitted with a
Gaussian curve twice. In the first fit all three parameters - width,
amplitude and offset from a previously defined position - are free,
while in the second fit only the amplitudes are allowed to vary, with
width and offset held fixed at values found by a
![]() -clipping fit along the dispersion direction to the
values obtained in the first step. The same procedure was applied to
the spectra of standard stars to correct for the instrument response
and to convert counts to flux units. The slit was oriented along the
parallactic angle during each observation, so no chromatic effects are
expected; however, since the nights were in general non-photometric
and relatively narrow slits were used, the present spectra must be
considered non-spectrophotometric.
-clipping fit along the dispersion direction to the
values obtained in the first step. The same procedure was applied to
the spectra of standard stars to correct for the instrument response
and to convert counts to flux units. The slit was oriented along the
parallactic angle during each observation, so no chromatic effects are
expected; however, since the nights were in general non-photometric
and relatively narrow slits were used, the present spectra must be
considered non-spectrophotometric.
To derive line parameters each spectrum was normalized by a continuum
that was defined using cubic splines over featureless spectral
regions. Tables 2 to 10 provide a list of
identified metal lines, along with observed equivalent-width estimates
![]() and redshifts. These parameters resulted from Gaussian
fits to the lines in the normalized spectra. Central wavelengths are
accurate to better than 0.1 Å, and
and redshifts. These parameters resulted from Gaussian
fits to the lines in the normalized spectra. Central wavelengths are
accurate to better than 0.1 Å, and
![]() for all
listed lines.
for all
listed lines.
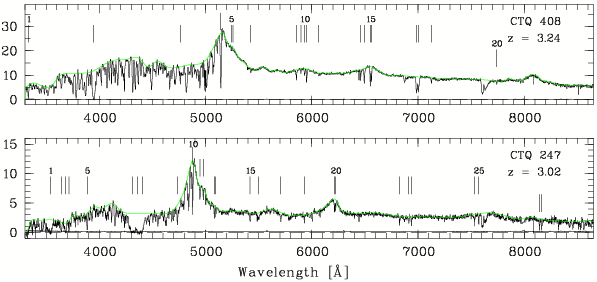 |
Figure 1:
R-C spectra showing outstanding absorption systems described in the
text. The smoothed curve indicates the fitted continuum and the
lower curve |
| Open with DEXTER | |
| Line |
|
|
z | |
| [Å] | [Å] | |||
| 1 | 3331.6 | 9.12 | H I
|
2.2481 |
| 2 | 3948.2 | 34.60 | H I
|
2.2478 |
| 3 | 4761.7 | 3.65 | H I
|
2.9169 |
| 4 | 5142.2 | 7.39 | H I
|
3.2299 |
| 5 | 5241.6 | 0.67 | N V
|
3.2311 |
| 6 | 5259.0 | 0.68 | N V
|
3.2315 |
| 7 | 5425.9 | 0.97 | Al II
|
2.2475 |
| 8 | 5854.1 | 2.79 | Fe II
|
1.4973 |
| 9 | 5896.7 | 0.69 | Si IV
|
3.2308 |
| 10 | 5931.5 | 2.09 | Fe II
|
1.4980 |
| 11 | 5950.6 | 3.57 | Fe II
|
1.4973 |
| 12 | 6065.4 | 0.53 | C IV
|
2.9177 |
| 13 | 6459.1 | 2.45 | Fe II
|
1.4971 |
| 14 | 6493.3 | 3.28 | Fe II
|
1.4973 |
| 15 | 6550.2 | 4.01 | C IV
|
3.2311 |
| 16 | 6560.7 | 3.01 | C IV
|
3.2306 |
| 17 | 6986.9 | 11.10 | Mg II
|
1.4986 |
| 18 | 7001.7 | 7.38 | Mg II
|
1.4975 |
| 19 | 7124.7 | 1.62 | Mg I
|
1.4973 |
| 20 | 7739.1 | 1.19 | Fe II
|
2.2479 |
There are at least four interesting absorption line systems present in the spectrum of CTQ 408.
An associated system (i.e., with absorption redshift
![]() )
at z=3.231 is seen in C IV and H I. As commonly found
in such systems the high ionization species, here represented by
C IV, appear blue-shifted with respect to the QSO systemic
velocity (Tytler & Fan 1992).
)
at z=3.231 is seen in C IV and H I. As commonly found
in such systems the high ionization species, here represented by
C IV, appear blue-shifted with respect to the QSO systemic
velocity (Tytler & Fan 1992).
A DLA system at z=2.248 is detected through the DLA line at
![]() Å and the corresponding Ly
Å and the corresponding Ly![]() line at
3332 Å. The identification is supported by the presence of
Al II
line at
3332 Å. The identification is supported by the presence of
Al II
![]() and Fe II
and Fe II
![]() at the same
redshift.
at the same
redshift.
In addition, there is a strong Mg II system at
z=1.498 that also shows absorption by Fe II
![]() and 2600, and Mg I
and 2600, and Mg I
![]() .
The
strength of the Mg II doublet and Fe II lines and the
presence of Mg I strongly suggest these lines also arise in a DLA
system.
Maybe the most interesting system in the spectrum of CTQ 408 is the
optically thin LL system observed at z=2.917. Our spectrum shows the
corresponding Ly
.
The
strength of the Mg II doublet and Fe II lines and the
presence of Mg I strongly suggest these lines also arise in a DLA
system.
Maybe the most interesting system in the spectrum of CTQ 408 is the
optically thin LL system observed at z=2.917. Our spectrum shows the
corresponding Ly![]() line along with a weak (
line along with a weak (
![]() Å) C IV
doublet. The interesting point here is that the Lyman break at 3600 Å is steep; together with the fact that the corresponding
C IV absorption is weak, the
steepness of the break leads us to believe that this LL system has a
simple velocity structure. Moreover, simulating the shape of the
break as the sum of Voigt profiles accounting for the higher-order
Lyman series lines shows that a small H I Doppler parameter,
Å) C IV
doublet. The interesting point here is that the Lyman break at 3600 Å is steep; together with the fact that the corresponding
C IV absorption is weak, the
steepness of the break leads us to believe that this LL system has a
simple velocity structure. Moreover, simulating the shape of the
break as the sum of Voigt profiles accounting for the higher-order
Lyman series lines shows that a small H I Doppler parameter,
![]() kms-1, reproduces the data better
than higher values do.
These two properties - lack of multiple velocity
components and small b-value - make of this system a serious
candidate for measuring the deuterium-to-hydrogen abundance ratio,
D/H.
Such a measurement in high-resolution spectra is in
general a difficult task because D I is
nearly 5 orders of magnitude weaker
than H I and the Lyman series absorption lines are separated by only
82 kms-1. Thus, there is a rather small range of suitable H I column
densities for which the detection and profile fit
of D I Ly
kms-1, reproduces the data better
than higher values do.
These two properties - lack of multiple velocity
components and small b-value - make of this system a serious
candidate for measuring the deuterium-to-hydrogen abundance ratio,
D/H.
Such a measurement in high-resolution spectra is in
general a difficult task because D I is
nearly 5 orders of magnitude weaker
than H I and the Lyman series absorption lines are separated by only
82 kms-1. Thus, there is a rather small range of suitable H I column
densities for which the detection and profile fit
of D I Ly![]() is possible, with lower limits imposed by the spectrum
S/N and upper limits imposed by saturation of the
H I-Ly
is possible, with lower limits imposed by the spectrum
S/N and upper limits imposed by saturation of the
H I-Ly![]() line.
In this regard, CTQ 408 again appears as a good candidate, given the
substantial flux in the region of
Ly
line.
In this regard, CTQ 408 again appears as a good candidate, given the
substantial flux in the region of
Ly![]() absorption,
absorption,
![]() erg s-1 cm-2 Å-1, and the
small column density of the z=2.917 LL system,
erg s-1 cm-2 Å-1, and the
small column density of the z=2.917 LL system,
![]() cm-22, as derived from the optical depth at
the Lyman break.
cm-22, as derived from the optical depth at
the Lyman break.
| Line |
|
|
z | |
| [Å] | [Å] | |||
| 1 | 3537.2 | 17.50 | H I
|
1.9098 |
| 2 | 3640.4 | 15.70 | H I
|
2.5491 |
| 3 | 3680.4 | 18.70 | H I
|
2.5881 |
| 4 | 3714.2 | 9.70 | H I
|
2.6211 |
| 5 | 3885.7 | 8.43 | C II
|
1.9117 |
| 6 | 4314.5 | 131.981 | H I
|
2.5491 |
| 7 | 4362.0 | ... | H I
|
2.5881 |
| 8 | 4402.1 | ... | H I
|
2.6211 |
| 9 | 4734.0 | 8.32 | C II
|
2.5473 |
| 10 | 4878.3 | 6.18 | H I
|
3.0128 |
| 11 | 4947.2 | 1.92 | Si IV
|
2.5495 |
| 12 | 4977.5 | 1.33 | Si IV
|
2.5484 |
| 13 | 5082.3 | 3.43 | C IV
|
2.2828 |
| 14 | 5096.0 | 2.18 | C IV
|
2.2861 |
| 15 | 5417.9 | 3.34 | Si II
|
2.5487 |
| 16 | 5498.5 | 5.74 | C IV doublet | 2.5486 |
| 17 | 5707.6 | 4.80 | Fe II
|
2.5485 |
| 18 | 5929.0 | 2.57 | Al II
|
2.5486 |
| 19 | 6213.0 | 2.70 | C IV
|
3.0130 |
| 20 | 6223.8 | 2.39 | C IV
|
3.0133 |
| 21 | 6825.1 | 3.81 | Fe II
|
1.9115 |
| 22 | 6912.3 | 3.06 | Fe II
|
1.9111 |
| 23 | 6937.1 | 3.12 | Fe II
|
1.9114 |
| 24 | 7531.1 | 4.81 | Fe II
|
1.9115 |
| 25 | 7569.9 | 4.53 | Fe II
|
1.9113 |
| 26 | 8141.8 | 5.32 | Mg II
|
1.9116 |
| 27 | 8163.1 | 6.70 | Mg II
|
1.9118 |
CTQ 247 is an exceptional line of sight as at least three DLA systems
can be seen in its spectrum. The broad trough centered at
![]() Å can be identified with three DLA lines corresponding to
redshifts z=2.55, 2.59 and 2.62. This triple identification is
supported by the presence of the corresponding Ly
Å can be identified with three DLA lines corresponding to
redshifts z=2.55, 2.59 and 2.62. This triple identification is
supported by the presence of the corresponding Ly![]() lines (lines
2, 3, and 4 in the bottom panel of Fig. 1). Absorption
at z=2.55 is also observed by the low-ionization species
C II, Fe II, Al II, and Si II, and by the
high-ionization species C IV and Si IV. The
large velocity span of
lines (lines
2, 3, and 4 in the bottom panel of Fig. 1). Absorption
at z=2.55 is also observed by the low-ionization species
C II, Fe II, Al II, and Si II, and by the
high-ionization species C IV and Si IV. The
large velocity span of ![]() 6000 kms-1 implied by the difference in
redshift,
6000 kms-1 implied by the difference in
redshift,
![]() ,
is difficult to explain on the basis of a
virialized galaxy cluster. If, instead,
,
is difficult to explain on the basis of a
virialized galaxy cluster. If, instead, ![]() is due to the Hubble flow,
the systems would cover a proper radial distance of
is due to the Hubble flow,
the systems would cover a proper radial distance of ![]() 18 Mpc
(
18 Mpc
(
![]() ,
,
![]() ,
H0=50 kms-1/Mpc),
i.e., consistent with supercluster size scales. We discuss further this
system in Sect. 4.
,
H0=50 kms-1/Mpc),
i.e., consistent with supercluster size scales. We discuss further this
system in Sect. 4.
There is possibly another DLA line at
![]() Å
corresponding to z=1.91. Its DLA nature is
supported by strong Mg II, Fe II, and C II
absorption at the same redshift.
Å
corresponding to z=1.91. Its DLA nature is
supported by strong Mg II, Fe II, and C II
absorption at the same redshift.
In addition, a
![]() absorption system is observed
at z=3.01 in Ly
absorption system is observed
at z=3.01 in Ly![]() and C IV, that is likely to be responsible for the apparent
Lyman-break observed at
and C IV, that is likely to be responsible for the apparent
Lyman-break observed at ![]() 3700 Å.
3700 Å.
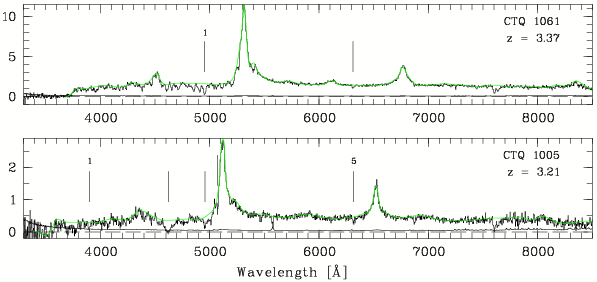 |
Figure 2:
B&C spectra showing outstanding
absorption systems described in the text.
The smoothed curve indicates the fitted continuum and the
lower curve |
| Open with DEXTER | |
The most prominent system in the spectrum of CTQ 1061 is a thick LL
system at z=3.07 (Ly![]() and an associated C IV doublet
are observed), producing the Lyman break observed at 3700 Å.
Note that the Ly
and an associated C IV doublet
are observed), producing the Lyman break observed at 3700 Å.
Note that the Ly![]() line does not reach zero flux at its core,
yet being unusually broad. This means this system is probably not
damped, but instead it must be made of several velocity components with
lower column densities.
line does not reach zero flux at its core,
yet being unusually broad. This means this system is probably not
damped, but instead it must be made of several velocity components with
lower column densities.
| Line |
|
|
z | |
| [Å] | [Å] | |||
1 |
4952.5 | 27.80 | H I
|
3.0739 |
| 2 | 6311.8 | 5.24 | C IV doublet | 3.0735 |
| Line |
|
|
z | |
| [Å] | [Å] | |||
| 1 | 3897.8 | 15.01 | H I
|
2.8001 |
| 2 | 4622.5 | 81.00 | H I
|
2.8025 |
| 3 | 4955.9 | 16.23 | H I
|
3.0767 |
| 4 | 5072.8 | 18.37 | C II
|
2.8016 |
| 5 | 6315.9 | 6.90 | C IV doublet1 | 3.0762 |
The spectrum of CTQ 1005 shows a broad trough at
![]() Å,
which we interpret as a DLA line corresponding to
z=2.80. The interpretation is supported by the strong line
at 3898 Å, identified with Ly
Å,
which we interpret as a DLA line corresponding to
z=2.80. The interpretation is supported by the strong line
at 3898 Å, identified with Ly![]() ,
and by C II
,
and by C II
![]() at the same redshift.
at the same redshift.
We also find a C IV doublet at z=3.08, which is likely to be
responsible for the apparent Lyman break at
![]() Å.
Å.
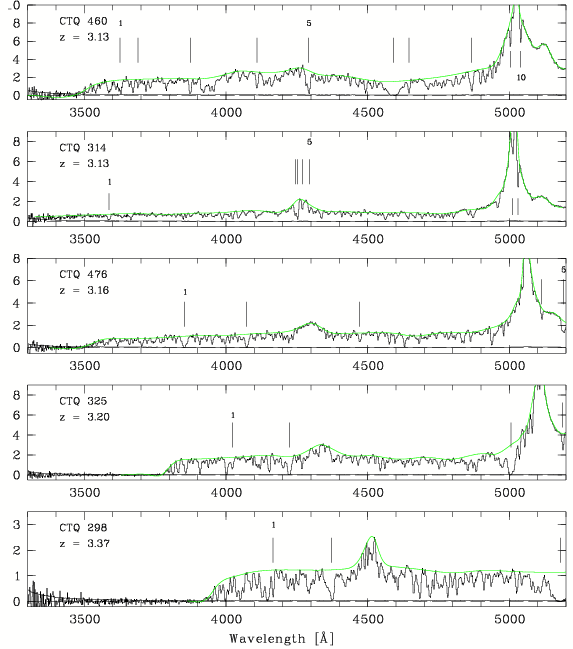 |
Figure 3:
EFOSC2 spectra of z>3 QSOs
from the ongoing DLA survey.
The smoothed curve indicates the fitted continuum and the
lower curve |
| Open with DEXTER | |
The spectrum of CTQ 460 shows a broad absorption through at
![]() Å, which we identify with a DLA system at z=2.78,
also showing Ly
Å, which we identify with a DLA system at z=2.78,
also showing Ly![]() and C III
and C III
![]() .
The
Lyman break observed at
.
The
Lyman break observed at
![]() ,
however, is not
consistent with this redshift and must be produced by a
LL system at a slightly higher redshift, for which line 7 is a good
Ly
,
however, is not
consistent with this redshift and must be produced by a
LL system at a slightly higher redshift, for which line 7 is a good
Ly![]() candidate.
candidate.
In addition, there appear to be two strong Ly![]() +Ly
+Ly![]() systems at z=2.53 and z=3.00. Nevertheless, we may ask whether the line
identifications for the z=3.00 system are correct, because, despite
the strength of the Ly
systems at z=2.53 and z=3.00. Nevertheless, we may ask whether the line
identifications for the z=3.00 system are correct, because, despite
the strength of the Ly![]() line (as compared with line 7), no
corresponding Lyman break is observed. Concerning the z=2.53 system,
a possible LL break falls in the absorbed part of the spectrum.
line (as compared with line 7), no
corresponding Lyman break is observed. Concerning the z=2.53 system,
a possible LL break falls in the absorbed part of the spectrum.
There are also two interesting
![]() systems at
z=3.12 and z=3.15, which are observed in Ly
systems at
z=3.12 and z=3.15, which are observed in Ly![]() (lines 9 and
10) but not in N V. We note, however, that line 10 also matches
Si II
(lines 9 and
10) but not in N V. We note, however, that line 10 also matches
Si II ![]() 1260 at z=3.00.
1260 at z=3.00.
| Line |
|
|
z | |
| [Å] | [Å] | |||
| 1 | 3626.3 | 14.291 | H I
|
2.5354 |
| 2 | 3689.4 | 3.27 | C III
|
2.7762 |
| 3 | 3873.8 | 9.20 | H I
|
2.7767 |
| 4 | 4109.7 | 6.42 | H I
|
3.0066 |
| 5 | 4292.1 | 13.52 | H I
|
2.5306 |
| 6 | 4590.8 | 65.64 | H I
|
2.7763 |
| 7 | 4645.7 | 7.66 | H I
|
2.8215 |
| 8 | 4867.3 | 11.73 | H I
|
3.0038 |
| 9 | 5004.3 | 2.20 | H I
|
3.1165 |
| 10 | 5040.1 | 1.92 | H I
|
3.1459 |
This line of sight again shows two likely
![]() Ly
Ly![]() systems at
z=3.12 and z=3.14. However, the bluemost Ly
systems at
z=3.12 and z=3.14. However, the bluemost Ly![]() component,
although stronger, does not have a corresponding Ly
component,
although stronger, does not have a corresponding Ly![]() line, thus
making the identification insecure. N V is not detected in
neither of the systems but in the z=3.14 component there is
indication for strong O VI absorption (lines 4 and 5).
line, thus
making the identification insecure. N V is not detected in
neither of the systems but in the z=3.14 component there is
indication for strong O VI absorption (lines 4 and 5).
In addition, lines 1 and 3 match well with Ly![]() and Ly
and Ly![]() at
z=2.50 but the strength and asymmetry of the former line suggest
it is blended with another strong Ly
at
z=2.50 but the strength and asymmetry of the former line suggest
it is blended with another strong Ly![]() line. Alternatively,
if line
2 is mainly due to Ly
line. Alternatively,
if line
2 is mainly due to Ly![]() ,
then the match in total line
strength between the blended Ly
,
then the match in total line
strength between the blended Ly![]() and Ly
and Ly![]() absorption features is better.
absorption features is better.
| Line |
|
|
z | |
| [Å] | [Å] | |||
| 1 | 3587.7 | 11.39 | H I
|
2.4977 |
| 2 | 4244.3 | 5.59 | H I
|
3.1394 |
| 3 | 4253.3 | 7.00 | H I
|
2.4987 |
| 4 | 4269.9 | 2.88 | O VI
|
3.1378 |
| 5 | 4294.0 | 3.28 | O VI
|
3.1383 |
| 6 | 5011.8 | 4.03 | H I
|
3.1227 |
| 7 | 5031.0 | 2.22 | H I
|
3.1385 |
There is a possible DLA line at
![]() Å (the line is
unusually broad, with
Å (the line is
unusually broad, with
![]() Å, and the flux reaches zero
at the line core), but the corresponding Ly
Å, and the flux reaches zero
at the line core), but the corresponding Ly![]() line falls out of
our wavelength range due to a LL system at higher
redshift. The same is true for the broad (
line falls out of
our wavelength range due to a LL system at higher
redshift. The same is true for the broad (
![]() Å) line
at
Å) line
at
![]() Å, but here the identification is supported by
C II, Si II, and strong C IV absorption at the
same redshift.
Å, but here the identification is supported by
C II, Si II, and strong C IV absorption at the
same redshift.
| Line |
|
|
z | |
| [Å] | [Å] | |||
| 1 | 3853.8 | 20.61 | H I
|
2.1701 |
| 2 | 4073.7 | 15.16 | H I
|
2.3510 |
| 3 | 4472.6 | 6.62 | C II
|
2.3516 |
| 4 | 5114.8 | 2.00 | Si II
|
2.3502 |
| 5 | 5191.1 | 7.13 | C IV doublet1 | 2.3502 |
| Line |
|
|
z | |
| [Å] | [Å] | |||
| 1 | 4022.4 | 6.67 | C III
|
3.1170 |
| 2 | 4223.5 | 18.99 | H I
|
3.1176 |
| 3 | 5005.9 | 42.26 | H I
|
3.1178 |
| 4 | 5189.0 | 2.90 | Si II
|
3.1178 |
| Line |
|
|
z | |
| [Å] | [Å] | |||
| 1 | 4166.2 | 7.43 | C III
|
3.2643 |
| 2 | 4372.5 | 24.94 | H I
|
3.2626 |
| 3 | 5181.4 | 98.91 | H I
|
3.2622 |
A DLA system is seen at z=3.12 with Ly![]() ,
Ly
,
Ly![]() ,
C III
,
C III
![]() ,
Si II
,
Si II
![]() and the
corresponding Lyman-break clearly identified.
and the
corresponding Lyman-break clearly identified.
The spectrum of CTQ 298 shows a DLA system at z=3.26, again based on
Ly![]() ,
Ly
,
Ly![]() ,
C III
,
C III
![]() and the
corresponding Lyman-break.
and the
corresponding Lyman-break.
We have presented all 9 z>3 CTS QSOs observed so far at medium resolution
(FWHM =5 to 8 Å) that
show strong evidence for either a LL or DLA system in their spectra.
Based on the strength and shape of the Ly![]() line, and the presence of
Ly
line, and the presence of
Ly![]() and absorption by heavy
ions at the same redshift, we detect unambiguously
9 DLA systems in 6 lines of sight, with redshifts ranging from z=2.25 to
z=3.26. In addition, one of the spectra (CTQ 408) shows a strong
low-ionization (Mg II, Mg I, Fe II) metal system,
which might be identified with a DLA system at z=1.498.
and absorption by heavy
ions at the same redshift, we detect unambiguously
9 DLA systems in 6 lines of sight, with redshifts ranging from z=2.25 to
z=3.26. In addition, one of the spectra (CTQ 408) shows a strong
low-ionization (Mg II, Mg I, Fe II) metal system,
which might be identified with a DLA system at z=1.498.
This apparent high incidence of DLA systems
can partly be explained by noting that
five of the QSOs (CTQ 460, CTQ 314, CTQ 476, CTQ 325, and CTQ 298)
were observed as part of an ongoing Survey of DLA systems. The Survey
description, its goals and results will be presented in a future
paper. Worth mentioning here is that the low-resolution (
![]() Å) follow-up spectra of CTS QSOs have allowed us - based
on the likely presence of a DLA line - to build up a sub-sample
of most probable DLA candidates. Higher
resolution (
Å) follow-up spectra of CTS QSOs have allowed us - based
on the likely presence of a DLA line - to build up a sub-sample
of most probable DLA candidates. Higher
resolution (![]() 5 Å) and S/N (
5 Å) and S/N (![]() 20) spectroscopy of those
candidates can be used to discern, in most cases, between a real DLA line
profile and a complex blend of Ly
20) spectroscopy of those
candidates can be used to discern, in most cases, between a real DLA line
profile and a complex blend of Ly![]() forest lines. The presence
of a corresponding Ly
forest lines. The presence
of a corresponding Ly![]() line or outstanding metal lines makes
such an identification yet more reliable. Here we have reported all
five z>3 QSOs so far observed using this procedure. Therefore, due to the
pre-selection of DLA candidates, it is not surprising that these 5
spectra show 3 DLA systems.
line or outstanding metal lines makes
such an identification yet more reliable. Here we have reported all
five z>3 QSOs so far observed using this procedure. Therefore, due to the
pre-selection of DLA candidates, it is not surprising that these 5
spectra show 3 DLA systems.
On the other hand, the remaining four QSOs (CTQ 408, CTQ 247, CTQ 1061, and CTQ 1005, all observed prior to begin of the DLA Survey
and solely in regard to their high redshift) have been
chosen due to the serendipitous presence of either a DLA or LL system in
their spectra. Special attention must be payed to CTQ 247
(Sect. 3.2) since its spectrum already shows 4 DLA systems.
In particular, the three systems observed at ![]() are even more
atypical because of their small redshift difference,
are even more
atypical because of their small redshift difference,
![]() .
The a priori probability of finding three DLA systems in
such a small redshift range is so low,
.
The a priori probability of finding three DLA systems in
such a small redshift range is so low, ![]() 3 10-6, that it
supports a physical connection between them. Therefore, this line of
sight clearly deserves further study: (1) Identification of the putative
supercluster of proto-galaxies at the same redshift of the absorbers is now
possible with deep mid-IR images on an 8m-class telescope. (2) The
possible detection of high-ionization absorbing gas (e.g., via
O VI) in a high resolution spectrum of CTQ 247 is important
because it would give information on the physical state of the
intracluster gas. (3) Concerning the DLA systems themselves, measuring
metal abundances in each of the systems would give clues to the
chemical evolution of DLA systems; in fact, assuming the absorbers are
physically associated, then similar metallicities would be expected,
due to similar stellar-evolution histories. (4) Resolved absorption
profiles would help test current models on the kinematics of DLA
systems by comparing three - or more? - systems that might be
dynamically associated. In summary, the 3 DLA systems observed at
3 10-6, that it
supports a physical connection between them. Therefore, this line of
sight clearly deserves further study: (1) Identification of the putative
supercluster of proto-galaxies at the same redshift of the absorbers is now
possible with deep mid-IR images on an 8m-class telescope. (2) The
possible detection of high-ionization absorbing gas (e.g., via
O VI) in a high resolution spectrum of CTQ 247 is important
because it would give information on the physical state of the
intracluster gas. (3) Concerning the DLA systems themselves, measuring
metal abundances in each of the systems would give clues to the
chemical evolution of DLA systems; in fact, assuming the absorbers are
physically associated, then similar metallicities would be expected,
due to similar stellar-evolution histories. (4) Resolved absorption
profiles would help test current models on the kinematics of DLA
systems by comparing three - or more? - systems that might be
dynamically associated. In summary, the 3 DLA systems observed at
![]() toward CTQ 247 represent a unique case and can be used as a
laboratory for testing models of both galaxy formation and
chemical evolution, at a redshift where galactic structures are
perhaps still in process of formation.
toward CTQ 247 represent a unique case and can be used as a
laboratory for testing models of both galaxy formation and
chemical evolution, at a redshift where galactic structures are
perhaps still in process of formation.
Finally, let us emphasize that all the absorption systems we have described in this paper deserve further study at high-resolution. The present sample of new QSOs thus enlarges the still scarce number of high-z southern QSOs that are bright enough for high-resolution spectroscopy on 8 m-class telescopes.
Acknowledgements
We thankfully acknowledge the important suggestions made by the referee, Dr. S. Savaglio, to improve the clarity of the paper. We have also benefitted from helpful discussions with Dr. S. Ellison and Dr. L. F. Barrientos. S. L. acknowledges financial support by FONDECYT grant No. 3000001 and by the Deutsche Zentralstelle für Arbeitsvermittlung. J. M. acknowledges financial support by FONDECYT grant No. 1980172.