A&A 366, 481-489 (2001)
DOI: 10.1051/0004-6361:20000354
M. N. Sevenster1 - H. J. van Langevelde2 - R. A. Moody1 - J. M. Chapman3 - H. J. Habing4 - N. E. B. Killeen3
1 - MSSSO/RSAA, Cotter Road, Weston ACT 2611,
Australia
2 -
Joint Institute for VLBI in Europe,
Postbus 2, 7990 AA Dwingeloo, The Netherlands
3 -
Australia Telescope National Facility, PO Box 76, Epping NSW 1710,
Australia
4 -
Sterrewacht Leiden, PO Box 9513, 2300 RA Leiden, The Netherlands
Received 20 July 2000 / Accepted 9 November 2000
Abstract
We present observations of the region between
![]() and
and
![]() ,
in the OH 1612.231 MHz line, taken from
1993 to 1995 with NRAO's Very Large Array
,
in the OH 1612.231 MHz line, taken from
1993 to 1995 with NRAO's Very Large Array![]() (VLA).
These observations are the last part of a larger survey, covering
(VLA).
These observations are the last part of a larger survey, covering
![]() and
and
![]() ,
with the
Australia Telescope Compact Array (ATCA) and the VLA.
The region was systematically observed on
a
,
with the
Australia Telescope Compact Array (ATCA) and the VLA.
The region was systematically observed on
a
![]() grid in (
grid in (![]() )
and the
resulting coverage was 92%, with 965 pointings.
We found 286 OH-masing objects, 161 of which are new detections and
207 have reliable IRAS point-source identifications.
The outflow velocity was determined for 276 sources.
A total of 766 sources were detected in the combined ATCA/VLA survey,
of which 29 were detected in two regions of the survey.
In this article we analyse the data statistically and give
identifications with known sources where possible.
The "efficiency'' of this VLA survey is 75% of that of the
ATCA Bulge survey. This efficiency was determined by comparing
the detections in the region where the two surveys overlap.
The completeness- and error
characteristics are similar, though less homogeneous,
except for the much larger errors in the flux densities.
The relatively large surface number density found in the northern disk,
suggests that we can see the Bar
extending to higher longitudes on this side of the galactic Centre.
)
and the
resulting coverage was 92%, with 965 pointings.
We found 286 OH-masing objects, 161 of which are new detections and
207 have reliable IRAS point-source identifications.
The outflow velocity was determined for 276 sources.
A total of 766 sources were detected in the combined ATCA/VLA survey,
of which 29 were detected in two regions of the survey.
In this article we analyse the data statistically and give
identifications with known sources where possible.
The "efficiency'' of this VLA survey is 75% of that of the
ATCA Bulge survey. This efficiency was determined by comparing
the detections in the region where the two surveys overlap.
The completeness- and error
characteristics are similar, though less homogeneous,
except for the much larger errors in the flux densities.
The relatively large surface number density found in the northern disk,
suggests that we can see the Bar
extending to higher longitudes on this side of the galactic Centre.
Key words: surveys - techniques: image processing - stars: AGB and post AGB - radio lines: stars - galaxy: stellar content
| |
Figure 1:
The 965 pointings of the VLA survey that were used in the
data reduction; no data were obtained for 88 pointings out of 1053.
In reality the maps were square (
|
| Open with DEXTER | |
We have surveyed a large section of the galactic plane in the OH 1612-MHz
satellite line. The aim of the survey was to sample the stellar
dynamics in the plane, cutting through the major components of
the Galaxy. Very strong radiation is emitted in the observed OH line
by, amongst others, OH/IR stars (for a review see Habing 1996). These
are particularly suitable tracers of the stellar dynamics for a
variety of reasons. Most important is that they are easily observable in
any region of the Galaxy, their
line-of-sight velocity can be
determined very accurately and they represent a large fraction of
the stellar population. This article is the sequel to previous
articles discussing the Australia
Telescope Compact Array (ATCA) "Bulge'' (
![]()
![]() ,
Sevenster et al. 1997a, Paper I) and "Disk''
(
,
Sevenster et al. 1997a, Paper I) and "Disk''
(![]()
![]() ,
Sevenster et al. 1997b, Paper II) parts of the survey.
Here we discuss the results of the northern plane region, between
,
Sevenster et al. 1997b, Paper II) parts of the survey.
Here we discuss the results of the northern plane region, between
![]() and
and
![]() .
This region was observed with the VLA in New Mexico.
.
This region was observed with the VLA in New Mexico.
![\begin{figure}
\parbox[t]{5.6cm}{\vspace*{-6.8cm}{\psfig{figure=ms10125f2a.ps,an...
...ox[t]{5.6cm}{\psfig{figure=ms10125f2c.ps,angle=270,width=10cm}}
\par\end{figure}](/articles/aa/full/2001/05/aa10125/img25.gif) |
Figure 2: a-c) The two larger panels on the left show the raw spectrum of a primary calibrator (1331+305), taken on 210594, averaged over all baselines (top) and after flagging with WSRFI (bottom). The smaller panels on the right show the single-integration, single-baseline spectra (i.e. visibilities) that were actually flagged by WSRFI. Most of these visibilities were flagged as "G" ( 3.1), except for the 7th plot, which was a "W" |
| Open with DEXTER | |
We discuss the observations in Sect. 2 and the data reduction in Sect. 3. In Sect. 4 we give the results of this survey and in Sect. 5 a statistical analysis of the data, that, like Paper II, follows closely the analysis in Paper I. We summarize in Sect. 6.
| Date | Array | RFI TYPES | UVMAX | N |
| 200293 | AB | G | 75-110 | 73 |
| 080693 | BC | W, G, S206 | 30-37 | 71 |
| 090693 | C | W, G, S206 | 16-18 | 70 |
| 100693 | C | G | 17-18 | 70 |
| 310893 | C | G, S226 | 7-12 | 73 |
| 020993 | CD | W, G | 7-12 | 46 |
| 090993 | CD | W, G, S226 | 7-12 | 72 |
| 210594 | AB | W, G, S210 | 100-120 | 38 |
| 260594 | AB | W, G | 70-120 | 69 |
| 280594 | AB | W, G, S 200204 | 75-120 | 73 |
| 310594 | AB | W, G, S208 | 80-120 | 62 |
| 010694 | AB | W, G | 75-105 | 59 |
| 030694 | AB | G | 55 | 13 |
| 160994 | BC | W, G, S 208225 | 25-37 | 62 |
| 210994 | BC | G, W | 25-37 | 70 |
| 220994 | BC | G, W | 24-37 | 74 |
| 210695 | A | W, G | 180-200 | 51 |
The observations were taken with the VLA between
1993 February and 1995 June, in configurations
ranging from A to CD (Table 1).
The area of this northern part of the survey consisted of
![]() pointing centres. Due to
system failures and compact antenna configurations in combination
with radio-frequency interference (RFI),
useful data were obtained for only 965 (Fig. 1).
pointing centres. Due to
system failures and compact antenna configurations in combination
with radio-frequency interference (RFI),
useful data were obtained for only 965 (Fig. 1).
The full width at half maximum (FWHM)
of the primary beam (PB) of the VLA antennae at 1612.231 MHz
is 27![]() .
The data were taken in circular RR polarization, using a total
bandwidth of 3.3 MHz (614kms-1) and 255 spectral channels
(separation 2.27kms-1).
Doppler tracking
was used during the observations, transforming the velocities to
the frame of the local standard of rest (LSR), so
the spectral band was centred at 0kms-1 for each pointing.
.
The data were taken in circular RR polarization, using a total
bandwidth of 3.3 MHz (614kms-1) and 255 spectral channels
(separation 2.27kms-1).
Doppler tracking
was used during the observations, transforming the velocities to
the frame of the local standard of rest (LSR), so
the spectral band was centred at 0kms-1 for each pointing.
We used mostly 0137+331, or if necessary 1331+305, as the
primary calibrator and 1822-096, 1911-201, 1751-253 and
1751+096 as secondary calibrators.
On each field, an integration time of
![]() s was scheduled,
with in general 300 baselines available for observing.
s was scheduled,
with in general 300 baselines available for observing.
Data were reduced with the reduction package
Miriad (Sault et al. 1995); five- and six-letter acronyms in capitals
throughout this paper will indicate the Miriad programs we used.
To make the data quality uniform across the whole survey area,
only baselines with lengths between 5 k![]() and 55 k
and 55 k![]() were
used (cf. Table 1).
The primary and secondary calibrators were edited first with a
custom-made RFI flagger WSRFI (see Sect. 3.1) and further by hand.
After calibration (MFCAL), the data from all pointings were edited
only with WSRFI.
were
used (cf. Table 1).
The primary and secondary calibrators were edited first with a
custom-made RFI flagger WSRFI (see Sect. 3.1) and further by hand.
After calibration (MFCAL), the data from all pointings were edited
only with WSRFI.
The searching was performed largely as described in Paper I, with MPFND, a custom-made derivative of INVERT, aimed at searching large amounts of modest-quality data for point sources. This routine Fourier-transforms spectral channels one by one, retaining only the position and flux density of the brightest pixel for each image. Subsequently, the peaks are correlated in the spectral direction, looking for statistically significant (OH/IR-type) spectral features. If one has been found, an appropriate point-source model is subtracted from the visibilities and the same routine is performed at a lower detection level. All details are given in Appendix A of Paper I.
The image size was always 16652, with square cells of 1
![]() 5,
searching all but 10 cells along each border.
Four passes were performed,
the last one well below 3
5,
searching all but 10 cells along each border.
Four passes were performed,
the last one well below 3![]() the theoretical noise
(as given by MPFND).
the theoretical noise
(as given by MPFND).
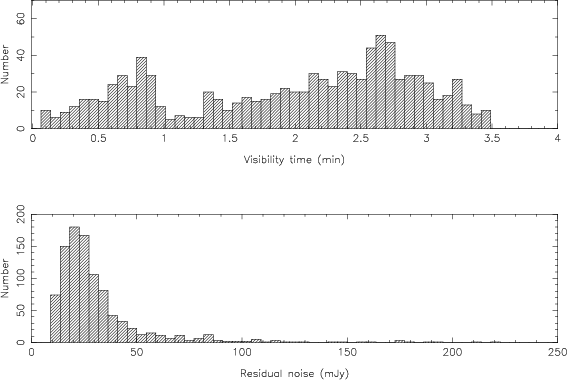 |
Figure 3: a) and b) These histograms display the net integration times and residual noises for all 965 fields used in the searching process (see Sect. 2). For each pointing 5 min integration time was scheduled |
| Open with DEXTER | |
A few changes were made to accommodate specific properties of VLA data. To save time, with the VLA cubes three times larger than the ATCA cubes due to higher resolution, an extra first pass through the data was performed in the visibility domain. Spectral peaks were identified in the scalar-averaged spectra and then only the peak channel was Fourier transformed to find the source position.
With the modest spectral resolution of the VLA correlator, a large fraction of the sources induced spectral aliassing; the narrowest, mostly brightest, sources creating responses in all 255 channels. Obviously, these reponses may be negative. To account for this, we adapted the subroutine UVSUB to allow for negative point source models. Input models for the new UVSUB were "log'' output files from UVSPEC, containing the real part of the visibilities, offset to the source position, for the whole spectral range (215 channels in calibrated data). Hence, in all passes, once a source position was established, either directly as a real source or after shifting to the real position in the case of detecting a sidelobe (see Paper I), a full spectral point-source model was subtracted from the visibility data. This clearly took out the random noise at the source positions as well, but the data on the whole were not significantly influenced.
The visibility-based point-source subtraction was not as effective for the VLA data as for the ATCA, due to the non-negligible third dimension in the antenna-position coordinates (u, v, w) for the VLA. Sources at higher offsets were occasionally redetected in later passes. This was corrected for in the post-searching cross-identification process.
Three kinds of RFI corrupted the data during most of the observing dates. One was the usual broad-band Glonass RFI ("G" in Table 1), often accompanied by a single-channel spike ("S", sub-/superscripts indicating channel of spike). The third was interference from a nearby military base ("W"), depending in strength on u-v direction rather than baseline length, which saturated the correlator to give non-random noise characteristics (see Fig. 2).
The routine UVLIN, used for the ATCA data (Papers I, II), had no positive effect when applied to these data with the required high order of polynomial, probably again due to the non-negligible third dimension of the VLA array. However, with a custom-made visibility-flagging algorithm WSRFI, written for use within Miriad, we managed to excise the worst of all three types of RFI. In Fig. 2, we show the spectrum of one of the primary calibrators before and after running WSRFI on the data.
With the combined losses due to antenna downtime, data flagging
to delete interference and retaining only baselines between
5 k![]() and 55 k
and 55 k![]() ,
the resulting net "visibility time"
(all visibilities used divided by the number of baselines used, times 30 s)
is of the order of 1-3 min (Fig. 3).
,
the resulting net "visibility time"
(all visibilities used divided by the number of baselines used, times 30 s)
is of the order of 1-3 min (Fig. 3).
In Table 2 all narrow-line OH sources found are listed. In total there are 286 sources, 125 of which have been identified with known OH-1612-MHz masers. Ten sources have only one spectral peak. A reliable (see Sect. 5.5 for definition) IRAS identification is found for 207 sources. The median "residual" rms-noise level is 25 mJy (Fig. 3, Sect. 5.1.1).
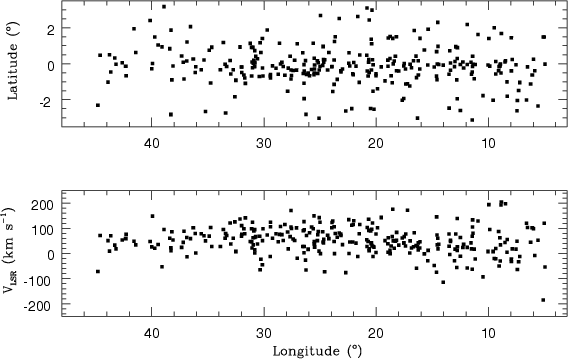 |
Figure 4: a) and b) The longitude-latitude diagram and longitude-velocity diagram for the 286 sources of Table 2. The central velocities (Col. 10) are plotted |
| Open with DEXTER | |
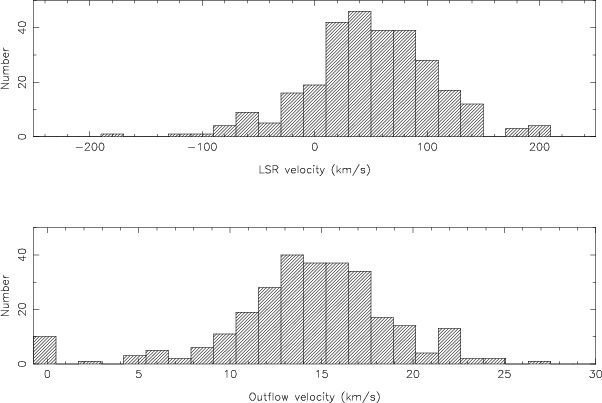 |
Figure 5: a) and b) The histograms of the central velocities and outflow velocities for the 286 sources of Table 2 |
| Open with DEXTER | |
For each source the table gives an entry number (Col. 1),
the OH![]() name (Col. 2), observing date (Col. 3, see Table 1),
position in J2000 coordinates (Cols. 4, 5),
the formal positional error (Col. 6) - much smaller than the actual
error (Sect. 5.2) -, the distance from the source
to the pointing centre (Col. 7), the peak, stellar and
outflow velocities (Cols. 8 to 11), the peak fluxes (Cols. 12, 13),
calibration flag (see Sect. 5.3) and
error in the peak flux density (Col. 14; see Sect. 5.3),
the empirical residual noise in the
field where the source was detected (Col. 15),
presence of previous OH detection and
the name of the nearest IRAS point source (Col. 16)
and the distance to this nearest IRAS point source expressed as a
fraction of the corresponding IRAS error ellipse (Col. 17).
name (Col. 2), observing date (Col. 3, see Table 1),
position in J2000 coordinates (Cols. 4, 5),
the formal positional error (Col. 6) - much smaller than the actual
error (Sect. 5.2) -, the distance from the source
to the pointing centre (Col. 7), the peak, stellar and
outflow velocities (Cols. 8 to 11), the peak fluxes (Cols. 12, 13),
calibration flag (see Sect. 5.3) and
error in the peak flux density (Col. 14; see Sect. 5.3),
the empirical residual noise in the
field where the source was detected (Col. 15),
presence of previous OH detection and
the name of the nearest IRAS point source (Col. 16)
and the distance to this nearest IRAS point source expressed as a
fraction of the corresponding IRAS error ellipse (Col. 17).
The spectra for all sources are shown in Fig. 10.
They are displayed with 50kms-1 on either side of the
velocity range of each object.
The spectra were extracted from cleaned (1282 1
![]() pixels around
the source position) and restored cubes, summing
over
pixels around
the source position) and restored cubes, summing
over
![]() pixels around the peak pixel. Only
spectra #237 and #280 were extracted from raw cubes,
as cleaning was impossible due to the awkward beam shape.
No "continuum fitting" other than the described RFI
excision (Sect. 3.1) was applied (cf. spectra #097, 104, 253, 275, 280).
pixels around the peak pixel. Only
spectra #237 and #280 were extracted from raw cubes,
as cleaning was impossible due to the awkward beam shape.
No "continuum fitting" other than the described RFI
excision (Sect. 3.1) was applied (cf. spectra #097, 104, 253, 275, 280).
![\begin{figure}
\par\parbox[t]{9cm}{\vspace*{-5.25cm}\includegraphics[angle=-90,w...
...}
\parbox[t]{5cm}{\includegraphics[width=5cm,clip]{ms10125f6b.eps}}
\end{figure}](/articles/aa/full/2001/05/aa10125/img36.gif) |
Figure 6:
A source (solid black circle in right panel)
in the field of pointing centre A will create
sidelobes in that field, as well as that of B (42 |
| Open with DEXTER | |
Dots over peaks in the spectra give an indication of the velocity range of the detections; note eg. the sidelobe from spectrum #223 in spectrum #219. Sidelobes are still present in the spectra, as most confusing sources would be outside the cleaned area. Negative sidelobes are obvious in e.g. spectra #127 (from #132), #150 (from #149) and in an unfortunate way in #222 (from #223). Note the extreme velocity coincidence of #159 and #172, as well as #242 and #244.
In Fig. 4 the longitude-latitude diagram and longitude-velocity diagram are shown and in Fig. 5 the histograms of central- and outflow velocity.
Table 2 Compact OH-maser sources in the northern galactic Disk region (This table is only available in electronic form at the CDS via anonymous ftp to cdsarc.u-strasbg.fr (130.79.128.5) or via http://cdsweb.u-strasbg.fr/cgi-bin/qcat?J/A+A/366/481
The columns of Table 2 contain the following information:
![]()
![]()
In this section we analyse the global completeness of the survey and discuss the statistical accuracy of the quantities given in Table 2. The discussion and figures follow closely that of the corresponding section in Paper I, but is adapted to treat some VLA-specific details. We will assume errors are normally distributed, unless stated otherwise.
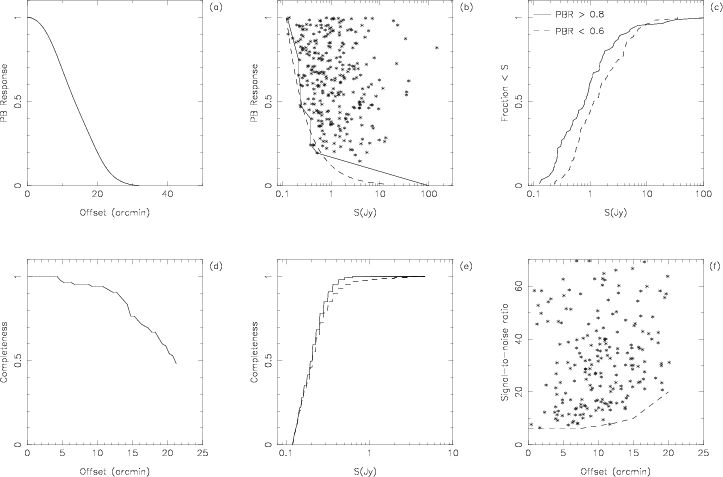 |
Figure 7: a-f) Representation of the completeness of the data (Sect. 5.1.2). a) The primary beam response (PBR) of the VLA antennae at 18 cm, as a function of radial offset from the pointing centre, taken from Napier & Rots (1982). b) The PBR calculated for the detected sources plotted against the highest peak-OH flux densities, corrected for primary beam attenuation. The solid line indicates the lowest flux densities detected in PBR bins. The dashed line indicates the expected inner boundary calculated from the PBR curve in a) for a limiting flux density of 120 mJy (chosen to fit observed extremes). c) The cumulative flux density distribution for stars with PBR values > 0.8 (solid line) and < 0.6 (dashed line). The solid line is taken to be the intrinsic OH flux density distribution for the sources in the survey. d) The completeness, relative to the pointing centres, of the survey as a function of position offsets from the field centres. e) The completeness of the sample as a function of flux density. The offset out to which a source with certain flux density can be observed is determined from the dashed line in b). Then we determine the area covered inside that offset, as a fraction of the total area of the survey. The solid curve gives this for the ideal case of no missing pointings, the dashed curve takes the gaps (Fig. 1 ) into account. f) The signal-to-noise ratio for all sources, plotted against their radial offset from the pointing centre. The dashed line shows the (observed) lower limit at a certain offset |
| Open with DEXTER | |
The empirical noise levels (defined as the rms in the
![]() cubes after the last pass
of source subtraction) for all 965 fields are shown
in Fig. 3. The median noise is 25 mJy (mean 32 mJy: the same
as the ATCA Bulge region);
90% of the fields have noise levels below 50 mJy.
cubes after the last pass
of source subtraction) for all 965 fields are shown
in Fig. 3. The median noise is 25 mJy (mean 32 mJy: the same
as the ATCA Bulge region);
90% of the fields have noise levels below 50 mJy.
In this section we treat the global completeness of the sample.
There was no absolute lower detection limit set in the
searching routines (opposed to the strategy for the ATCA survey).
The half-power beam width (HPBW) of the VLA antennae at 1612 MHz
is 13
![]() 5. Approximately 55% of the total area of the VLA survey
would be covered within the HPBW (this includes the fact that 8% of pointings
are missing).
For fields that are not on the boundary of the surveyed region,
the largest possible offset from the nearest pointing
for any source is 21
5. Approximately 55% of the total area of the VLA survey
would be covered within the HPBW (this includes the fact that 8% of pointings
are missing).
For fields that are not on the boundary of the surveyed region,
the largest possible offset from the nearest pointing
for any source is 21
![]() 2,
which corresponds to a primary-beam response (PBR) of 0.16 (Fig. 7 a).
In Fig. 6 we see that this typically guarantees
that the main lobe of a detected source is measured to be stronger than
any of its sidelobes, even in other fields, provided we cover
the entire survey region with our image sizes
(square in
2,
which corresponds to a primary-beam response (PBR) of 0.16 (Fig. 7 a).
In Fig. 6 we see that this typically guarantees
that the main lobe of a detected source is measured to be stronger than
any of its sidelobes, even in other fields, provided we cover
the entire survey region with our image sizes
(square in
![]() ), which is the case where there are
no gaps (Fig. 1). Note that the field separation is the
absolute maximum, given the primary-beam response, to still
guarantee proper identification of the main lobes of all sources.
In fields at the perimeter of the
survey region (cf. Fig. 1), sources could be
found in principle at offsets up to 29
), which is the case where there are
no gaps (Fig. 1). Note that the field separation is the
absolute maximum, given the primary-beam response, to still
guarantee proper identification of the main lobes of all sources.
In fields at the perimeter of the
survey region (cf. Fig. 1), sources could be
found in principle at offsets up to 29![]() .
In practice, the largest offset was 21
.
In practice, the largest offset was 21
![]() 3 (Table 2);
only four sources were found more than 20
3 (Table 2);
only four sources were found more than 20![]() away from the
nearest pointing centre.
away from the
nearest pointing centre.
In Fig. 7 b we plot the PBR of each source against its peak flux density. The solid line connects stars with the lowest detected OH flux densities, determined in bins of PBR. The dashed curve indicates the expected relation between PBR and flux-density cut-off for an absolute detection limit of 120 mJy (cf. 160 mJy, 140 mJy for the ATCA survey regions). Note that the empirical detection level is clearly not as constant across the VLA region as across the ATCA regions. The global limit is closer to 150 mJy, but there are a few detections that clearly are outliers (limit 90 mJy). This is due to the gaps in the coverage, that increase the area covered by large offsets from what it would normally be, combined with a larger spread in the noise levels (see above; Fig. 3).
In Fig. 7 c we plot the cumulative flux-density distributions
for all detected sources with PBR > 0.8 (solid)
and, for comparison, with PBR < 0.6 (dashed).
We postulate that the survey is essentially complete for PBR > 0.8,
for flux densities above the sensitivity limit,
and take the solid curve in Fig. 7 c as
the intrinsic cumulative flux-density distribution
for the present sample.
We use this distribution to determine the fraction of the
"flux-density function" seen at a given offset (Fig. 7 d),
with the absolute limit of 120 mJy to determine the cut-off in
flux density at the offset.
In short, the curve in Fig. 7 d shows what fraction of
the flux-density distribution we see if we select sources with
a certain offset from Table 2![]() .
.
![\begin{figure}
{\psfig{figure=ms10125f8.ps,width=10truecm} }
\parbox[b]{8cm}{}\end{figure}](/articles/aa/full/2001/05/aa10125/img44.gif) |
Figure 8:
a-d)
With the channel width of 2.27kms-1, the
intrinsic velocity structure of the maser features,
of order 0.2kms-1 wide, is undersampled. Hence, aliassing
and measurement errors are introduced, that depend on the
offset of the true spectral peak from the centre
of the channel it is detected in.
This figure gives the difference between "measured" and
"perfect" OH/IR-type spectrum in stellar velocity a),
outflow velocity b),
flux density c) and peak-flux-density ratio d). The "perfect"
spectrum has an outflow velocity 15kms-1 and unit
flux density for both peaks.
We "observed" it 100 times, adding random noise
so that the resulting signal-to-noise ratio was between 0.0 and 0.3,
shifting the stellar velocity (abscissae) by random amounts
within one channel width, convolving with
the spectral-response sinc function and binning to
the resolution of the observations.
The combined errors are
|
| Open with DEXTER | |
The solid curve in Fig. 7e shows what fraction of the searched area we cover if we select all sources with a certain flux density from Table 2. The dashed curve in Fig. 7e shows the same distribution, but this time properly corrected for the gaps in the coverage and the corresponding redistribution of area from small offsets to large offsets. The dashed curve reaches 99% completeness for 2 Jy, the solid curve for 0.5 Jy. The latter is virtually the same as the 99% completeness of the ATCA surveys. The survey is 80% complete for sources of 320 mJy or 285 mJy, respectively, again similar to the ATCA surveys. This should be interpreted as follows. If we select all sources brighter than 2 Jy (after correction for PBR), the distribution on the sky will be entirely uninfluenced by our observations and only reflect the real surface-density distribution. If we select all sources brighter than 0.5 Jy, the distribution will show holes at the missing pointings, but will not be influenced by the variable sensitivity within fields. If one selects even fainter sources, the distribution will be a complicated function of both intrinsic surface density and survey sensitivity.
Finally, in Fig. 7f, we plot the signal-to-noise ratio for all detected sources against offset. The limiting signal-to-noise ratio is 7 (the corresponding ratios for the ATCA surveys are 4 and 6, respectively) at low offsets.
Summarizing, the lower sensitivity limit is 120 mJy ![]() 30 mJy, with
the most sensitive detections made at 7
30 mJy, with
the most sensitive detections made at 7![]() .
The survey is 99% complete for flux densities higher than
0.5 Jy (or 2 Jy, when taking into account holes in the survey area) and
90% complete in flux density for offsets lower than 13
.
The survey is 99% complete for flux densities higher than
0.5 Jy (or 2 Jy, when taking into account holes in the survey area) and
90% complete in flux density for offsets lower than 13
![]() 2.
2.
Firstly, the positional accuracy varies dramatically from source
to source, as the maximum baseline length varies from 7 k![]() (see Table 1) to 55 k
(see Table 1) to 55 k![]() ,
corresponding to a resolution
of 29
,
corresponding to a resolution
of 29
![]() and 4
and 4
![]() ,
respectively.
With 1
,
respectively.
With 1
![]() cells for the imaging of all fields,
the positional errors for sources observed with
the lowest resolution would go to infinity (see Fig. 5 in Paper I).
As an example, for a
maximum baseline length of 25 k
cells for the imaging of all fields,
the positional errors for sources observed with
the lowest resolution would go to infinity (see Fig. 5 in Paper I).
As an example, for a
maximum baseline length of 25 k![]() the half width of the synthesized beam at half maximum would
be
the half width of the synthesized beam at half maximum would
be ![]() 8
8
![]() ,
or 5.5 cells, giving an error of <2 cells
or 2
,
or 5.5 cells, giving an error of <2 cells
or 2
![]() ,
following Fig. 5 in Paper I.
,
following Fig. 5 in Paper I.
Secondly, since we discard baselines below 5 k![]() (Sect. 3),
for observations with compact array
configurations (Aug., Sep. 1993) the synthesized-beam shape
was severely compromised, given the minimal hour-angle coverage
(cf. #237, 280 with infinite beam size).
However, our position for #280 differs only 11
(Sect. 3),
for observations with compact array
configurations (Aug., Sep. 1993) the synthesized-beam shape
was severely compromised, given the minimal hour-angle coverage
(cf. #237, 280 with infinite beam size).
However, our position for #280 differs only 11
![]() of that
given in the literature (Braz & Epchtein 1983),
which is entirely within their errors.
of that
given in the literature (Braz & Epchtein 1983),
which is entirely within their errors.
In short, the typical error in the positions
is of the order of 2
![]() ,
in agreement with our findings
in Sect. 5.7.
,
in agreement with our findings
in Sect. 5.7.
The flux densities in Table 2 (Cols. 12, 13)
were determined from the same cubes as described in Sect. 5.2.
The data were summed over ![]() 1
1
![]() cells around the maximum cell and divided by the
corresponding sum of the synthesized beam (IMSPEC).
The formal errors (Col. 14) were determined
by IMFIT, in the peak channel.
Errors marked with
cells around the maximum cell and divided by the
corresponding sum of the synthesized beam (IMSPEC).
The formal errors (Col. 14) were determined
by IMFIT, in the peak channel.
Errors marked with ![]() (mostly 0.0 mJy) indicate
that the absolute flux-density calibration was not carried out properly
in the corresponding field.
We applied a fudge factor of 16 to all flux
densities measured in those fields, which introduces
an error of 25% for those sources (in properly calibrated fields
this factor ranges from 12 to 20).
In all other fields, the error from the absolute
calibration is of the order of 1%, except for
those observed on 260594 where it is 20%.
From the time-dependent calibration solutions, we expect
errors of 10% - 20% in the flux densities.
(mostly 0.0 mJy) indicate
that the absolute flux-density calibration was not carried out properly
in the corresponding field.
We applied a fudge factor of 16 to all flux
densities measured in those fields, which introduces
an error of 25% for those sources (in properly calibrated fields
this factor ranges from 12 to 20).
In all other fields, the error from the absolute
calibration is of the order of 1%, except for
those observed on 260594 where it is 20%.
From the time-dependent calibration solutions, we expect
errors of 10% - 20% in the flux densities.
An addional error is introduced by random noise and binning.
In Fig. 5.1.2c we show that this amounts to
35% (binning) ![]() 5% (noise).
The corresponding errors in the peak-flux-density ratio (Fig. 5.1.2d) is
5% (noise).
The corresponding errors in the peak-flux-density ratio (Fig. 5.1.2d) is
![]() 20% (0.7/0.6 instead of 1/1, Fig. 5.1.2c).
20% (0.7/0.6 instead of 1/1, Fig. 5.1.2c).
Summarizing, the relevant errors are on average 15% (calibration) plus 5% (noise) plus for some sources 25% (fudging). Multiplying, we find a typical accuracy for the flux densities in Table 2 of 20%, which is in agreement our findings in Sect. 5.7, or 40% for fudged sources.
As the VLA has on-line Doppler tracking, the velocity band is always centered on 0kms-1 (LSR), but the bandpass calibration, in frequency space, changes the velocity range slightly with position and date. However, all detections are within the range that was covered on all dates (-200kms-1, +210kms-1), so sensitivity and errors are independent of the value of the velocity.
In Fig. 5.1.2a we show the difference between measured stellar velocity, combining the effects of binning, noise and aliassing, and the true stellar velocity of a perfect spectrum, as a function of true stellar velocity with respect to the centre of the channel of detection. The typical errors are less than 1kms-1, in agreement with our finding in Sect. 5.7.
The same arguments as given in Paper I apply, that for double-peaked sources the outflow velocity will be systematically slightly underestimated (see also Fig. 5.1.2b) due to undersampling of the spectra. For single-peaked sources there is an uncertainty in the stellar velocity of typically 14kms-1. The fraction of such single-peak sources in this VLA set is low (3%) compared to the ATCA sets in Papers I, II (9%, 18%). Due to the variable data quality and remnant RFI, fewer single-peaked detections were significant according to our criteria. For instance, a detection in three separate channels at the same spatial position was more readily accepted if it was in two neighbouring channels plus one at a certain velocity interval than if it was in three neighbouring channels, even if statistically those two scenarios may have the same probability. Empirically, the single-peaked configuration is more likely to turn out not to be a source, but remnant RFI.
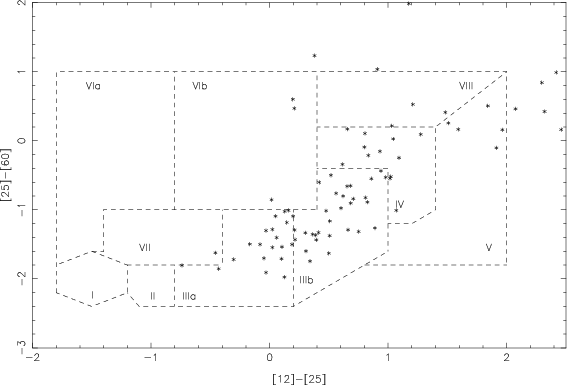 |
Figure 9:
The IRAS two-colour diagram for sources with an IRAS identification
lying within the IRAS error ellipse (Col. 17, |
| Open with DEXTER | |
In Col. 17, the distance from the OH source to the position of the IRAS point source (Col. 16) is given in fractional radii of the IRAS error ellipse in the direction of the OH position (see Paper I). N=1 means the position of the OH source can be identified with the position of the IRAS source with 95% confidence. The IRAS PS in Col. 16 is in fact the one that is most likely to be connected to the OH source, i.e. with the smallest value of N.
Of the 286 sources, 207 (72%) have an IRAS PS counterpart within the IRAS error ellipse (N < 1). This fraction is comparable to those found in Papers I, II (65%, 75%), as well as to the 68% found by Blommaert et al. (1994). In Fig. 9 we show the IRAS two-colour diagram (van der Veen & Habing 1988) for sources with an IRAS identification with N<1 and reliable IRAS colours.
Note that this two-colour diagram is very similar to that of the
ATCA Bulge OH/IR stars (Paper I), rather than of the ATCA Disk stars,
in terms of the population of region V and the scatter on the
evolutionary track (regions III). This similarity remains the same
when leaving out the source with longitude below 10![]() .
It could be due to the orientation of the Bar, that
causes it to extend to higher longitudes in the northern galactic plane.
However, it should be realized that by plotting only those sources that
have well-determined IRAS flux densities in three bands, a selection
effect is introduced. The distribution is influenced by the levels of
background confusion.
.
It could be due to the orientation of the Bar, that
causes it to extend to higher longitudes in the northern galactic plane.
However, it should be realized that by plotting only those sources that
have well-determined IRAS flux densities in three bands, a selection
effect is introduced. The distribution is influenced by the levels of
background confusion.
We searched the SIMBAD data base for previous OH detections
within 1![]() from each position in Table 2.
In Col. 16, as well as in Fig. 10, an "
from each position in Table 2.
In Col. 16, as well as in Fig. 10, an "![]() " indicates
a reference to Paper I;
if not in that catalogue, an "x" indicates a reference
to te Lintel et al. (1989);
if not in that catalogue, a "+" indicates another OH reference
and a "-" no OH reference at all.
In total, there are 26 "
" indicates
a reference to Paper I;
if not in that catalogue, an "x" indicates a reference
to te Lintel et al. (1989);
if not in that catalogue, a "+" indicates another OH reference
and a "-" no OH reference at all.
In total, there are 26 "![]() " references, which is one less
than determined from the actual Paper I source list (see next section)
since entries in SIMBAD are not always entirely correct.
Note that we did not check for coincidence in velocity.
By this definition, 161 sources in Table 2, or 56% (cf. 47, 55% for
the ATCA survey regions),
are new detections; see Paper I for a more elaborate discussion.
" references, which is one less
than determined from the actual Paper I source list (see next section)
since entries in SIMBAD are not always entirely correct.
Note that we did not check for coincidence in velocity.
By this definition, 161 sources in Table 2, or 56% (cf. 47, 55% for
the ATCA survey regions),
are new detections; see Paper I for a more elaborate discussion.
The strip of
![]() was observed in both the VLA- and the ATCA parts of the survey, to
allow direct comparison between the two resulting data sets.
In that region, there are 47 stars detected in the ATCA survey and
36 in the VLA survey, of which 27 stars are actually in common.
With another two sources in common between the two parts of the ATCA survey
(Papers I, II), the total number of sources in the combined survey is 766.
was observed in both the VLA- and the ATCA parts of the survey, to
allow direct comparison between the two resulting data sets.
In that region, there are 47 stars detected in the ATCA survey and
36 in the VLA survey, of which 27 stars are actually in common.
With another two sources in common between the two parts of the ATCA survey
(Papers I, II), the total number of sources in the combined survey is 766.
Taking into account the intrinsic variability of the sources and the varying primary-beam responses in systematic observations, even two surveys with exactly the same flux-density limits would not yield the same detections unless they were carried out simultaneously and with the same pointing pattern. The redetection rate of the VLA is 27/47=57% and of the ATCA 27/36=75%. The difference between those numbers is a direct measure of the relative "efficiency'' ((number of detected sources)/(number of detectable sources within limits)) of the two surveys, provided the overlap region is representative of the whole area. The ATCA survey is 30% more "efficient'' than the VLA survey. This is entirely in agreement with the ratio of FWHM coverages: the ATCA Bulge survey covers 73% of the survey area within a PBR of 0.5, the VLA 55%, including the missing pointings.
If we compare this VLA data set to the ATCA Disk data set,
there are 250 and 202 stars, respectively,
in the strips from ![]() 10
10![]() to
to ![]() 45
45![]() in
longitude, even though the VLA survey is
less efficient. This could again be interpreted as a sign of
the Bar extending to much higher longitudes on the northern
side of the galactic Centre (see Sect. 5.5).
in
longitude, even though the VLA survey is
less efficient. This could again be interpreted as a sign of
the Bar extending to much higher longitudes on the northern
side of the galactic Centre (see Sect. 5.5).
For the 27 sources in common, the average difference in position
is 1
![]() 66 (0
66 (0
![]() 04-2
04-2
![]() 91) and in velocity 0.68kms-1.
The latter value excludes two
sources (#010 = SCHB268, #021 = SCHB286)
for which one of the two peaks was not detected in the ATCA survey
and source #020 (SCHB285) which is known to have a very variable
velocity profile (Sevenster & Chapman in preparation).
91) and in velocity 0.68kms-1.
The latter value excludes two
sources (#010 = SCHB268, #021 = SCHB286)
for which one of the two peaks was not detected in the ATCA survey
and source #020 (SCHB285) which is known to have a very variable
velocity profile (Sevenster & Chapman in preparation).
For 8 sources, the observing date (200293) was relatively close to that of the ATCA, so that a flux-density comparison could be made. Taking into account the differences in velocity resolution and the typical variability of sources, the flux densities are the same to about 20% (cf. Sect. 5.3).
We have given the results
of a survey of the region
![]() and
and
![]() in the OH 1612.231 MHz maser line.
The survey is 99% complete for sources brighter than 500 mJy and
90% complete for positional
offsets from the pointing centres smaller than 13
in the OH 1612.231 MHz maser line.
The survey is 99% complete for sources brighter than 500 mJy and
90% complete for positional
offsets from the pointing centres smaller than 13![]() .
The absolute
flux density limit is
.
The absolute
flux density limit is ![]() 120 mJy.
We have found 286 compact OH-maser sources, 161 of which are new detections.
The sources are mainly OH/IR stars, with a few related sources,
like planetary nebulae.
The positions are accurate to 2
120 mJy.
We have found 286 compact OH-maser sources, 161 of which are new detections.
The sources are mainly OH/IR stars, with a few related sources,
like planetary nebulae.
The positions are accurate to 2
![]() ,
the velocities
to 1kms-1 and the flux densities to 20%.
For 207 sources, an associated IRAS point source is found.
The total number of sources in the combined ATCA/VLA survey
is 766.
,
the velocities
to 1kms-1 and the flux densities to 20%.
For 207 sources, an associated IRAS point source is found.
The total number of sources in the combined ATCA/VLA survey
is 766.
The VLA survey is similar to the ATCA surveys in terms of global completeness statistics, but considerably less homogeneous in quality. The efficiency is approximately 75% that of the ATCA Bulge survey. The biggest differences are the considerably worse accuracy in the flux densities and the very low fraction of single-peaked sources. Signatures of a higher fraction of bar-like stars in this part of the survey than in the ATCA Disk survey are found in the surface number density of detected sources and arguably in the IRAS two-colour diagram.
Acknowledgements
This research has made use of the Simbad database, operated at CDS, Strasbourg, France.
![\begin{figure*}\includegraphics[width=14.4cm,clip]{ms10125f10a.ps}
\end{figure*}](/articles/aa/full/2001/05/aa10125/img50.gif) |
Figure 10:
The spectra for all the sources in Table 2.
They are displayed with 50kms-1 on either side of the velocity
range. Dots indicate the velocity range of each object.
The channel width in the display is
equal to that of the observations (2.27kms-1 ).
For each spectrum, a `` |
| Open with DEXTER | |
![\begin{figure*}\includegraphics[width=14.4cm,clip]{ms10125f10b.ps}
\end{figure*}](/articles/aa/full/2001/05/aa10125/img51.gif) |
Figure 10: continued |
| Open with DEXTER | |
![\begin{figure*}\includegraphics[width=14.4cm,clip]{ms10125f10c.ps}
\end{figure*}](/articles/aa/full/2001/05/aa10125/img52.gif) |
Figure 10: continued |
| Open with DEXTER | |
![\begin{figure*}\includegraphics[width=14.4cm,clip]{ms10125f10d.ps}
\end{figure*}](/articles/aa/full/2001/05/aa10125/img53.gif) |
Figure 10: continued |
| Open with DEXTER | |
![\begin{figure*}\includegraphics[width=14.4cm,clip]{ms10125f10e.ps}
\end{figure*}](/articles/aa/full/2001/05/aa10125/img54.gif) |
Figure 10: continued |
| Open with DEXTER | |
![\begin{figure*}\includegraphics[width=14.4cm,clip]{ms10125f10f.ps}
\end{figure*}](/articles/aa/full/2001/05/aa10125/img55.gif) |
Figure 10: continued |
| Open with DEXTER | |
![\begin{figure*}\includegraphics[width=14.4cm,clip]{ms10125f10g.ps}
\end{figure*}](/articles/aa/full/2001/05/aa10125/img56.gif) |
Figure 10: continued |
| Open with DEXTER | |
![\begin{figure*}\includegraphics[width=14.4cm,clip]{ms10125f10h.ps}
\end{figure*}](/articles/aa/full/2001/05/aa10125/img57.gif) |
Figure 10: continued |
| Open with DEXTER | |
![\begin{figure*}\includegraphics[width=14.4cm,clip]{ms10125f10i.ps}
\end{figure*}](/articles/aa/full/2001/05/aa10125/img58.gif) |
Figure 10: continued |
| Open with DEXTER | |
![\begin{figure*}\includegraphics[width=14.4cm,clip]{ms10125f10j.ps}
\end{figure*}](/articles/aa/full/2001/05/aa10125/img59.gif) |
Figure 10: continued |
| Open with DEXTER | |
| |
Figure 10: continued |
| Open with DEXTER | |