We have analyzed a region of
![]() around NGC2359 using the
21 cm- HI survey of Hartmann & Burton (1997). This survey was made using the
25m radio telescope at Dwingeloo. The angular and velocity resolution of this
dataset are 36
around NGC2359 using the
21 cm- HI survey of Hartmann & Burton (1997). This survey was made using the
25m radio telescope at Dwingeloo. The angular and velocity resolution of this
dataset are 36![]() and 1.03 km s-1, respectively. The survey has been done
with a sampling of 30
and 1.03 km s-1, respectively. The survey has been done
with a sampling of 30![]() in galactic coordinates and have a sensitivity
in brigthness temperature of 70 mK.
in galactic coordinates and have a sensitivity
in brigthness temperature of 70 mK.
The observations of the CO J=
![]() (115.271 GHz) and J=
(115.271 GHz) and J=
![]() (230.538 GHz)
lines and the J=
(230.538 GHz)
lines and the J=
![]() (110.201 GHz) line of 13CO towards NGC2359 and its
surroundings were made during 2000 February, using the NRAO
(110.201 GHz) line of 13CO towards NGC2359 and its
surroundings were made during 2000 February, using the NRAO![]() 12m
radio telescope at Kitt Peak. The half power beam width of the telescope was
54
12m
radio telescope at Kitt Peak. The half power beam width of the telescope was
54
![]() and 27
and 27
![]() at the rest frequency of the J=
at the rest frequency of the J=
![]() and the J=
and the J=
![]() lines, respectively.
lines, respectively.
The data were acquired simultaneously with two independent SIS receiver
channels with orthogonal polarizations. The receiver temperatures were
250-300K and 500-600K for the J=
![]() and the J=
and the J=
![]() lines, respectively.
We used filterbanks (with 256 channels) and the hybrid correlator MAC (in
the 2 IF mode, in parallel, 3072 channels) as backends. In the J=
lines, respectively.
We used filterbanks (with 256 channels) and the hybrid correlator MAC (in
the 2 IF mode, in parallel, 3072 channels) as backends. In the J=
![]() line, the filterbanks provided 100 and 250 kHz of resolution, corresponding
to velocity resolutions of 0.26 and 0.65 km s-1, respectively. For the same
line, the MAC correlator was setup with a total usable bandwidth of 300
MHz and with channels of 195.3 kHz of resolution (0.51 km s-1). In the J=
line, the filterbanks provided 100 and 250 kHz of resolution, corresponding
to velocity resolutions of 0.26 and 0.65 km s-1, respectively. For the same
line, the MAC correlator was setup with a total usable bandwidth of 300
MHz and with channels of 195.3 kHz of resolution (0.51 km s-1). In the J=
![]() line, the filterbank with channel widths of 250 kHz (0.33 km s-1) and 500 kHz
(0.65 km s-1) were used. We also used for this line the MAC correlator tuned
with an usable bandwidth of 600 MHz and frequency resolution of 390.6 kHz
(0.51 km s-1).
line, the filterbank with channel widths of 250 kHz (0.33 km s-1) and 500 kHz
(0.65 km s-1) were used. We also used for this line the MAC correlator tuned
with an usable bandwidth of 600 MHz and frequency resolution of 390.6 kHz
(0.51 km s-1).
 |
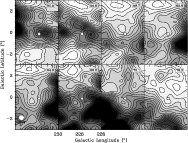
Figure 1: Distribution of the 21 cm- HI column density in a large region around NGC2359, obtained from the survey of Dwingeloo (Hartmann & Burton 1997). Every map has been constructed integrating over 2.1 km s-1 (2 channels), being the central velocity of integration indicated at the top right corner. Contour levels are 3 to 18 times 1019 cm-2. The small circle near the centre indicates the position and size of NGC2359. The Dwingeloo beam is also plotted in the bottom left map |
Mapping of the J=
![]() and J=
and J=
![]() lines was made using the "on-the-fly''
technique. We have obtained three individual maps in the J=
lines was made using the "on-the-fly''
technique. We have obtained three individual maps in the J=
![]() line and
six in the
line and
six in the
![]() line. These individual maps were later reduced
with AIPS and combined weighting them by their inverse square of
rms. For our investigation, we finally used the MAC data for
the J=
line. These individual maps were later reduced
with AIPS and combined weighting them by their inverse square of
rms. For our investigation, we finally used the MAC data for
the J=
![]() line and the 500 kHz-filterbank data for the J=
line and the 500 kHz-filterbank data for the J=
![]() line.
Typical final rms per grid point was 120 mK and 80 mK in the J =
line.
Typical final rms per grid point was 120 mK and 80 mK in the J =
![]() and J=
and J=
![]() lines, respectively. We have also observed the J=
lines, respectively. We have also observed the J=
![]() line
of 13CO and C18O at seven individual positions, with 7-10 min
of integration time achieving a rms noise of 30 mK.
line
of 13CO and C18O at seven individual positions, with 7-10 min
of integration time achieving a rms noise of 30 mK.
The pointing was checked at the begining of each observing session with
five-point cross maps. The final data are pointed within 4'' of uncertainty.
The data were calibrated using the chopper wheel method. Final intensity scale
is in units of
![]() ,
e.g., corrected by atmospheric attenuation and
instrumental losses (Kutner & Ulich 1981). The calibration was also checked off-line
by comparing individual spectra of standard sources.
,
e.g., corrected by atmospheric attenuation and
instrumental losses (Kutner & Ulich 1981). The calibration was also checked off-line
by comparing individual spectra of standard sources.
Copyright ESO 2001