There is a tight correlation between MB and D24.5. A
least-square fit to our data leads to:
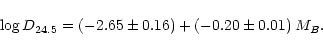 |
(10) |
In Fig. 16 a general trend between the concentration index c31, the absolute B magnitude MB and the morphological type is apparent. Early-type galaxies show medium-high magnitudes and high concentration indices. If we move downwards to the zone of low concentration index we find spirals, from Sa to late-type. Finally, BCDs have c31 values typical for spirals but are fainter than normal galaxies.
Figure 17 shows the segregation in morphological type
in a
![]() versus A diagram. In this plot and the next,
median values for the different morphological types are
plotted with a black dot; ellipse semi-axes are the
versus A diagram. In this plot and the next,
median values for the different morphological types are
plotted with a black dot; ellipse semi-axes are the ![]() of each parameter. There is a clear trend from left to right
in decreasing Hubble type. S0 galaxies are placed in the high
symmetry-high
of each parameter. There is a clear trend from left to right
in decreasing Hubble type. S0 galaxies are placed in the high
symmetry-high
![]() zone. BCDs also appear as highly
symmetrical objects. On the other hand, irregulars are shown
as highly asymmetrical objects in the top-left zone of the
plot and interactive systems are located among the most
asymmetrical galaxies. A trend can be also remarked in the
spiral sequence: early-type galaxies are more symmetrical than
late-type ones (due to the presence of more HII regions, for
example).
zone. BCDs also appear as highly
symmetrical objects. On the other hand, irregulars are shown
as highly asymmetrical objects in the top-left zone of the
plot and interactive systems are located among the most
asymmetrical galaxies. A trend can be also remarked in the
spiral sequence: early-type galaxies are more symmetrical than
late-type ones (due to the presence of more HII regions, for
example).
Figure 14 showed that there is a clear correlation between the concentration indices and Hubble type. This trend is also observed with the asymmetry coefficient. Table 7 presents the mean values of the bulge-to-disk ratio, mean effective surface brightness, concentration indices and asymmetry coefficient of each Hubble type. The statistics of A have been split into barred and non-barred objects; barred galaxies are more asymmetrical than non-barred ones.
![\begin{figure}
\par\includegraphics[angle=-90,width=8.8cm,clip]{H2366f16.ps}\end{figure}](/articles/aa/full/2001/03/aah2366/img135.gif) |
Figure 16: Concentration index c31 versus absolute magnitude MB. Different symbols stand for distinct morphological types |
Figure 18 depicts the absolute B magnitude of the UCM
objects versus the mean effective surface
brightness. Early-type galaxies appear as bright, high surface
brightness objects. Late-type spirals have lower
![]() ,
although no significant difference in MB is present. BCDs
are clearly segregated due to their faintness. Irregulars and
interactive systems show also a distinctive surface
brightness.
,
although no significant difference in MB is present. BCDs
are clearly segregated due to their faintness. Irregulars and
interactive systems show also a distinctive surface
brightness.
Copyright ESO 2001
![\begin{figure}
\par\includegraphics[angle=-90,width=8.8cm,clip]{H2366f15.ps}\end{figure}](/articles/aa/full/2001/03/aah2366/img134.gif)