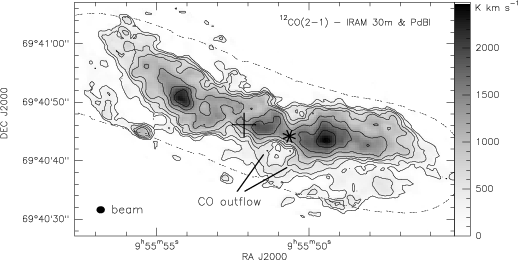
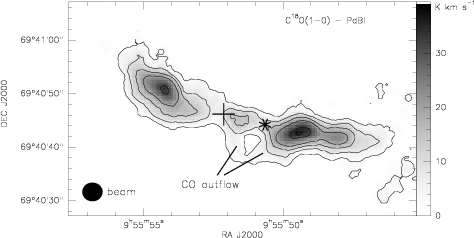
Figures 1 and 2 show the integrated
![]() and
and
![]() line intensities. The overall morphology of both images is very similar to the
line intensities. The overall morphology of both images is very similar to the
![]() distribution published by Shen & Lo (1995) and the
distribution published by Shen & Lo (1995) and the
![]() distribution published by Neininger et al. (1998). It shows a
triple peak morphology of which the two outer lobes have been interpreted as the
edge of a central molecular toroid (Nakai et al. 1987; Shen & Lo
1995) and a weaker central peak located 65 pc west of the M82's
center (2.2 m
distribution published by Neininger et al. (1998). It shows a
triple peak morphology of which the two outer lobes have been interpreted as the
edge of a central molecular toroid (Nakai et al. 1987; Shen & Lo
1995) and a weaker central peak located 65 pc west of the M82's
center (2.2 m![]() m peak; Dietz et al. 1986). The two outer lobes
have a projected separation of 410 pc (26''). The separation of the central
and the western molecular lobe is only about 130 pc (8''). More diffuse CO
emission is detected in the
m peak; Dietz et al. 1986). The two outer lobes
have a projected separation of 410 pc (26''). The separation of the central
and the western molecular lobe is only about 130 pc (8''). More diffuse CO
emission is detected in the
![]() intensity distribution east and west of the
CO peaks and in the south-west of the galaxy. The eastern part of the CO
distribution is significantly warped to the north. The total extent of the
emission region is about 1 kpc from east to west. With respect to M82's
center the distribution of the molecular gas is clearly displaced to the west.
South of the central and western CO peak two CO spurs are detected
(see Fig. 1). They extend about 100 pc below the main
molecular disk and join just below the expanding molecular superbubble which
is located between the central and western CO peak (Neininger et al. 1998;
Weiß et al. 1999). At the same location hot gas emerges into the
halo of M82 (e.g. Shopbell & Bland-Hawthorn 1998; Bregman et al.
1995) supporting the idea that the CO spurs indicate the walls of
the superbubble.
intensity distribution east and west of the
CO peaks and in the south-west of the galaxy. The eastern part of the CO
distribution is significantly warped to the north. The total extent of the
emission region is about 1 kpc from east to west. With respect to M82's
center the distribution of the molecular gas is clearly displaced to the west.
South of the central and western CO peak two CO spurs are detected
(see Fig. 1). They extend about 100 pc below the main
molecular disk and join just below the expanding molecular superbubble which
is located between the central and western CO peak (Neininger et al. 1998;
Weiß et al. 1999). At the same location hot gas emerges into the
halo of M82 (e.g. Shopbell & Bland-Hawthorn 1998; Bregman et al.
1995) supporting the idea that the CO spurs indicate the walls of
the superbubble.
Note that the chain of CO emission south of the eastern end of the
![]() distribution is most likely not real but an artifact from the primary beam
correction. The kinematic of the central 400 pc is dominated by solid
body rotation. The rotation amplitude is about 200 kms-1 ranging from
115 kms-1 at the western peak up to 320 kms-1 at the eastern peak. A
pv-diagram along the major axis of M82 in the
distribution is most likely not real but an artifact from the primary beam
correction. The kinematic of the central 400 pc is dominated by solid
body rotation. The rotation amplitude is about 200 kms-1 ranging from
115 kms-1 at the western peak up to 320 kms-1 at the eastern peak. A
pv-diagram along the major axis of M82 in the
![]() transition is shown
in Fig. 3. (For the corresponding diagram in the
transition is shown
in Fig. 3. (For the corresponding diagram in the
![]() data
see Weiß et al. 1999). The pv-diagram is centered on the
brightest supernova remnant SNR 41.9+58. The intense, velocity crowded regions at
20'', 5'' and -7'' offset correspond to the western, central and
eastern CO peak. Between the central and western CO peaks two velocity
components at 100 kms-1 and 190 kms-1 are detected. These features
have been interpreted as an expanding superbubble. The velocity of the CO spurs
is about 140 kms-1 (see Figs. 4 and 5) which is
similar to the centroid velocity of the expanding superbubble. Outside the
central 400 pc the CO rotation curve flattens. The dynamical center derived
from the
data
see Weiß et al. 1999). The pv-diagram is centered on the
brightest supernova remnant SNR 41.9+58. The intense, velocity crowded regions at
20'', 5'' and -7'' offset correspond to the western, central and
eastern CO peak. Between the central and western CO peaks two velocity
components at 100 kms-1 and 190 kms-1 are detected. These features
have been interpreted as an expanding superbubble. The velocity of the CO spurs
is about 140 kms-1 (see Figs. 4 and 5) which is
similar to the centroid velocity of the expanding superbubble. Outside the
central 400 pc the CO rotation curve flattens. The dynamical center derived
from the
![]() and
and
![]() data agrees very well with the value of
data agrees very well with the value of
![]() published by Shen & Lo (1995) for
the
published by Shen & Lo (1995) for
the
![]() ,
and Neininger et al. (1998) for the
,
and Neininger et al. (1998) for the
![]() transition.
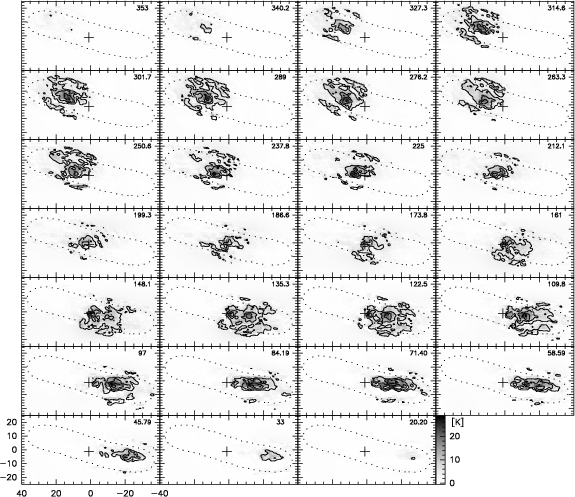
The channel maps of the
transition.
The channel maps of the
![]() and
and
![]() line emission are presented in
Figs. 4 and 5.
line emission are presented in
Figs. 4 and 5.
Most tracers of star formation in M82 indicate that the highest
star-forming activity is not associated with the molecular peaks,
which presumably indicate the location of the reservoirs for the "fuel''
for star formation, but rather takes place between the peaks.
The high-resolution 12.4 m![]() m image of the central region of
M82 published by Telesco & Gezari (1992) suggests that
the young stellar clusters, which heat the dust, are located between the
western molecular lobe and the 2.2 m
m image of the central region of
M82 published by Telesco & Gezari (1992) suggests that
the young stellar clusters, which heat the dust, are located between the
western molecular lobe and the 2.2 m![]() m nucleus (western mid infrared (MIR)
peaks), at the central CO peak, and between the central CO peak and the eastern
CO lobe (eastern MIR peak). A similar morphology is visible in the Ne II
line emission (Achtermann & Lacy 1995). The radio continuum point
sources, which are believed to be supernova remnants (SNR) and compact
H II regions, are spread across a much wider region and seem to avoid
MIR and Ne II peaks (Kronberg et al. 1985). Only the
strongest SNR in M82, SNR41.9+58, appears to be related to features at
other wavelengths: it is located near the center of the expanding molecular
superbubble, between the central and western CO peak, from which hot X-ray
emitting gas is released into the halo of M82 (Weiß et al. 1999).
At the same location recent radio continuum studies by Wills et al.
(1999) identified a blow-out in the form of a cone of missing 5-GHz
continuum emission. In the same study three other chimneys were identified
within the central 300pc of M82. All these observations
indicate that the regions of violent star formation are confined by the
molecular lobes. Since no indications for high activity have been found at the
2.2 m
m nucleus (western mid infrared (MIR)
peaks), at the central CO peak, and between the central CO peak and the eastern
CO lobe (eastern MIR peak). A similar morphology is visible in the Ne II
line emission (Achtermann & Lacy 1995). The radio continuum point
sources, which are believed to be supernova remnants (SNR) and compact
H II regions, are spread across a much wider region and seem to avoid
MIR and Ne II peaks (Kronberg et al. 1985). Only the
strongest SNR in M82, SNR41.9+58, appears to be related to features at
other wavelengths: it is located near the center of the expanding molecular
superbubble, between the central and western CO peak, from which hot X-ray
emitting gas is released into the halo of M82 (Weiß et al. 1999).
At the same location recent radio continuum studies by Wills et al.
(1999) identified a blow-out in the form of a cone of missing 5-GHz
continuum emission. In the same study three other chimneys were identified
within the central 300pc of M82. All these observations
indicate that the regions of violent star formation are confined by the
molecular lobes. Since no indications for high activity have been found at the
2.2 m![]() m nucleus itself, it seems that the starburst is arranged in a toroidal
topology around the nucleus.
m nucleus itself, it seems that the starburst is arranged in a toroidal
topology around the nucleus.
| |
Figure 3:
A pv-diagram along the major axis of M82 in the
|
To calculate the line ratios properly we used the short-spacing corrected
![]() ,
,
![]() and
and
![]() data cubes. Note that the missing flux in the pure
interferometric maps can be as high as 60% (see Table 1). Therefore
the short-spacing correction is vital to derive proper line ratios. The
short-spacing correction is less crucial for the peak line intensities.
Here the missing flux is 10%-30% only. The
data cubes. Note that the missing flux in the pure
interferometric maps can be as high as 60% (see Table 1). Therefore
the short-spacing correction is vital to derive proper line ratios. The
short-spacing correction is less crucial for the peak line intensities.
Here the missing flux is 10%-30% only. The
![]() ,
,
![]() and
and
![]() data
were smoothed to the resolution of the
data
were smoothed to the resolution of the
![]() observations (4.2'').
Since no single-dish data were obtained for the
observations (4.2'').
Since no single-dish data were obtained for the
![]() transition
we applied the missing flux factors derived from the
transition
we applied the missing flux factors derived from the
![]() peak intensity
distribution to the
peak intensity
distribution to the
![]() observations. This procedure is justified
because the frequency of both transitions is similar and the observations
were carried out in the same configurations with the PdBI. This leads to
similar uv-coverages for both observations. Furthermore the
morphology in the interferometer maps is similar and both transitions are
optically thin (see Sect. 3.4). To take the
remaining uncertainties into account we assumed an error of 50% for the
observations. This procedure is justified
because the frequency of both transitions is similar and the observations
were carried out in the same configurations with the PdBI. This leads to
similar uv-coverages for both observations. Furthermore the
morphology in the interferometer maps is similar and both transitions are
optically thin (see Sect. 3.4). To take the
remaining uncertainties into account we assumed an error of 50% for the
![]() line intensities. The line ratios were calculated at 19 positions across the CO
distribution of M82. The spacing between individual positions is about 4''.
The analyzed positions are marked by the crosses in Fig. 8.
The circles indicate the FWHM of 4.2'' used in the study. The positions
include all molecular peaks, the 2.2 m
line intensities. The line ratios were calculated at 19 positions across the CO
distribution of M82. The spacing between individual positions is about 4''.
The analyzed positions are marked by the crosses in Fig. 8.
The circles indicate the FWHM of 4.2'' used in the study. The positions
include all molecular peaks, the 2.2 m![]() m nucleus, the MIR peaks, the CO spurs
and the diffuse emission in the outer regions of M82. For clarity the
positions have been labeled 1 to 16 from east to west. Positions 17 to 19
correspond to positions on the CO outflow (see Fig. 8).
The line ratios at the analyzed positions are summarized in Table 2.
Errors include 10% uncertainty of the flux calibrators, errors of the
amplitude calibration (typically about 10%) and statistical errors. Our
high-resolution line ratios for
m nucleus, the MIR peaks, the CO spurs
and the diffuse emission in the outer regions of M82. For clarity the
positions have been labeled 1 to 16 from east to west. Positions 17 to 19
correspond to positions on the CO outflow (see Fig. 8).
The line ratios at the analyzed positions are summarized in Table 2.
Errors include 10% uncertainty of the flux calibrators, errors of the
amplitude calibration (typically about 10%) and statistical errors. Our
high-resolution line ratios for
![]() and ^13CO
and ^13CO
![]() differ slightly
from values derived from single dish observations by Mao et al. (2000).
But our data confirms that
differ slightly
from values derived from single dish observations by Mao et al. (2000).
But our data confirms that
![]() /
/
![]() ratios larger than 1.8
(e.g. Knapp et al. 1980; Olofsson & Rydbeck 1984; Loiseau
et al. 1990) can firmly be rejected.
ratios larger than 1.8
(e.g. Knapp et al. 1980; Olofsson & Rydbeck 1984; Loiseau
et al. 1990) can firmly be rejected.
![]() /
/
![]() and
and
![]() /
/
![]() line intensity ratios are about 10-20 and 40-60 respectively.
line intensity ratios are about 10-20 and 40-60 respectively.
|
|
|
|
|
|
|
|
|
MF
|
|
| [''] | [''] | [%] | |||||||
| 1 | 16.5 | 7.5 |
|
|
|
|
23.5 | ||
| 2 | 14.5 | 5.0 |
|
|
|
|
10.3 | ||
| 3 | 11.5 | 3.0 |
|
|
|
|
8.0 | ||
| 4 | 9.5 | 1.0 |
|
|
|
|
7.0 | ||
| 5 | 6.5 | 0.5 |
|
|
|
|
9.0 | ||
| 6 | 4.0 | 0.5 |
|
|
|
|
12.4 | ||
| 7 | 2.0 | -0.5 |
|
|
|
|
10.3 | ||
| 8 | -1.0 | -1.5 |
|
|
|
|
13.0 | ||
| 9 | -4.0 | -2.0 |
|
|
|
|
15.6 | ||
| 10 | -6.5 | -3.0 |
|
|
|
|
12.9 | ||
| 11 | -10.0 | -4.0 |
|
|
|
|
14.0 | ||
| 12 | -14.0 | -4.0 |
|
|
|
|
4.3 | ||
| 13 | -17.5 | -4.0 |
|
|
|
|
6.6 | ||
| 14 | -20.5 | -4.5 |
|
|
|
|
4.1 | ||
| 15 | -23.5 | -4.5 |
|
|
|
|
5.6 | ||
| 16 | -26.5 | -4.0 |
|
|
|
|
6.2 | ||
| 17 | -2.5 | -5.5 |
|
|
|
|
19.0 | ||
| 18 | -3.5 | -9.0 |
|
|
|
|
27.4 | ||
| 19 | -8.5 | -7.0 |
|
|
|
|
10.8 |
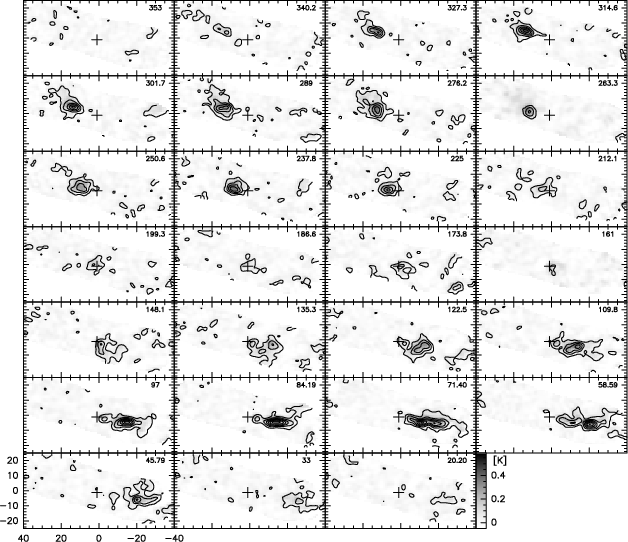 |
Figure 5:
|
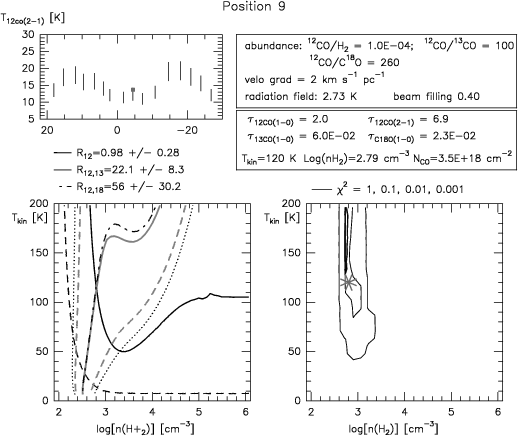 |
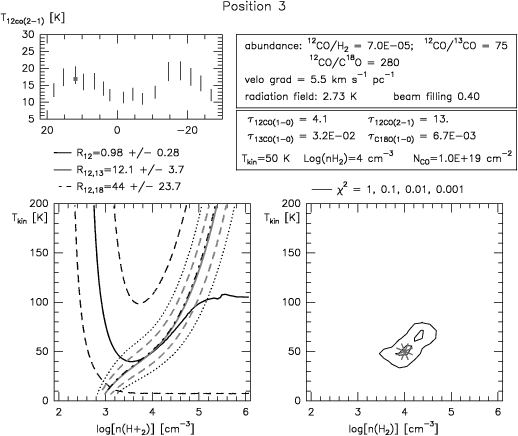
Figure 7: "Best'' LVG solution at position 9 (central MIR peak). The items and parameters are the same as in Fig. 6 |
The excitation conditions of the CO-emitting volume were modeled using a
spherical, isothermal one-component large velocity gradient (LVG) model
(Goldreich & Kwan 1974; de Jong et al. 1975). LVG line
intensities were calculated for a kinetic temperature and H2 density range
from 5K to 200K by 5K and
![]() from 1.8 to 5.0 by 0.2
respectively. In addition, we varied the CO abundance relative to H2, [CO],
per velocity gradient and the fractional
from 1.8 to 5.0 by 0.2
respectively. In addition, we varied the CO abundance relative to H2, [CO],
per velocity gradient and the fractional
![]() and
and
![]() abundances
([CO]/grad(V):
abundances
([CO]/grad(V):
![]() ;
[CO]/[
;
[CO]/[
![]() ]: 30 to 100 by 5; [CO]/[
]: 30 to 100 by 5; [CO]/[
![]() ]: 100 to 300 by 20).
For the comparison between the observed peak intensity ratios
(Table 2, Cols. 3, 5, 7) and the predicted LVG ratios we used a
]: 100 to 300 by 20).
For the comparison between the observed peak intensity ratios
(Table 2, Cols. 3, 5, 7) and the predicted LVG ratios we used a
![]() test. To account for the absolute intensities across the disk
of M82 we also fitted the
test. To account for the absolute intensities across the disk
of M82 we also fitted the
![]() intensity at each position by
varying the beam filling from 0.1 to 0.9 by 0.1. The "best'' solutions are
shown for positions 3 and 9 in Figs. 6 and 7.
Position 3 on the western CO lobe is an example for a solution with low
kinetic temperatures and high H2 densities; position 9 on the brightest
MIR peak is representative for solutions with high kinetic temperatures and
low H2 densities.
intensity at each position by
varying the beam filling from 0.1 to 0.9 by 0.1. The "best'' solutions are
shown for positions 3 and 9 in Figs. 6 and 7.
Position 3 on the western CO lobe is an example for a solution with low
kinetic temperatures and high H2 densities; position 9 on the brightest
MIR peak is representative for solutions with high kinetic temperatures and
low H2 densities.
The observed line ratios and
![]() intensities can be modeled
within the errors at all positions. The fit agrees very well with the data
at positions where
intensities can be modeled
within the errors at all positions. The fit agrees very well with the data
at positions where
![]() /
/
![]() is less than 1.2. At position 6 (eastern MIR peak)
we do not find any intersection for all observed line ratios in the H2
density and kinetic temperature plane. For a more detailed discussion see
Sect. 4.1. The best agreement with the observed line ratios and
absolute intensities is found for a beam filling of 0.4. Positions 6 and 7
at the eastern MIR peak (Telesco & Gezari 1992) and positions
18 and 19 at the CO outflow require a somewhat lower beam filling of 0.2 and
0.3 respectively.
is less than 1.2. At position 6 (eastern MIR peak)
we do not find any intersection for all observed line ratios in the H2
density and kinetic temperature plane. For a more detailed discussion see
Sect. 4.1. The best agreement with the observed line ratios and
absolute intensities is found for a beam filling of 0.4. Positions 6 and 7
at the eastern MIR peak (Telesco & Gezari 1992) and positions
18 and 19 at the CO outflow require a somewhat lower beam filling of 0.2 and
0.3 respectively.
The LVG parameters of the "best-fit'' across the major axis of M82 are shown
in Figs. 8a-d. The CO abundance relative to H2 per velocity
gradient ([CO]/grad(V)) varies between 1 10-5pc/kms-1 and
7 10-5pc/kms-1. Assuming
![]() ,
as suggested by comparing the linewidth with the linear extent of the region,
this corresponds to CO abundances in the range of
,
as suggested by comparing the linewidth with the linear extent of the region,
this corresponds to CO abundances in the range of
![]() -7 10-5. Similar values have been determined
in the Orion region (Blake et al. 1987) and were suggested by
chemical models (Farquhar et al. 1994). [CO]/grad(V)
increases towards the MIR peaks which indicates higher CO abundances at the
active star-forming regions than in the more quiescent outer regions.
The fractional
-7 10-5. Similar values have been determined
in the Orion region (Blake et al. 1987) and were suggested by
chemical models (Farquhar et al. 1994). [CO]/grad(V)
increases towards the MIR peaks which indicates higher CO abundances at the
active star-forming regions than in the more quiescent outer regions.
The fractional
![]() abundance [
abundance [
![]() ]/[
]/[
![]() ]
across M82 does not show
any significant spatial variation. The mean value of all positions is
]
across M82 does not show
any significant spatial variation. The mean value of all positions is
![]() .
A low fractional
.
A low fractional
![]() abundance is consistent with
recent radiative transfer calculations by Mao et al. (2000) and an
independent chain of arguments based on CN and 13CN measurements
(Henkel et al. 1998). In contrast, the fractional
abundance is consistent with
recent radiative transfer calculations by Mao et al. (2000) and an
independent chain of arguments based on CN and 13CN measurements
(Henkel et al. 1998). In contrast, the fractional
![]() abundance [
abundance [
![]() ]/[
]/[
![]() ]
shows a trend towards higher
]
shows a trend towards higher
![]() abundances at
the MIR peaks and in the outflow. While the average [
abundances at
the MIR peaks and in the outflow. While the average [
![]() ]/[
]/[
![]() ]
ratio in
the quiescent regions is about 270, it is only about 160 at position 6, 11,
17 and 19 (see Fig. 8d). Note that these values suggest
]
ratio in
the quiescent regions is about 270, it is only about 160 at position 6, 11,
17 and 19 (see Fig. 8d). Note that these values suggest
![]() abundances 2-3 times higher than those used by Wild et al. (1992)
for their LVG calculations of CO line ratios in M82.
abundances 2-3 times higher than those used by Wild et al. (1992)
for their LVG calculations of CO line ratios in M82.
The kinetic temperature is well correlated with the MIR emission and other
tracers of high-level star formation. Within the prominent CO lobes with
less signs of ongoing star formation, the kinetic temperature is about 50K.
Towards the active star-forming regions we find two kinetic temperature
peaks above 150K. These "hot-spots'' coincide with the location of MIR peaks
(for a comparison between the MIR emission and the CO distribution see
Telesco & Gezari 1992). Near the 2.2 m![]() m nucleus the LVG models
suggest temperatures of about 75K. Along the CO outflow the temperature
drops with increasing distance from the active regions. At position 17 and 19
we find temperatures above 100K. At position 18 (100pc distance from
the plane) the kinetic temperature has dropped to 60K. The spatial variation
of the kinetic temperature along the major axis of M82 is shown in
Fig. 8a. The corresponding diagram of the H2 density
distribution is shown in Fig. 8b. Solutions are found between
m nucleus the LVG models
suggest temperatures of about 75K. Along the CO outflow the temperature
drops with increasing distance from the active regions. At position 17 and 19
we find temperatures above 100K. At position 18 (100pc distance from
the plane) the kinetic temperature has dropped to 60K. The spatial variation
of the kinetic temperature along the major axis of M82 is shown in
Fig. 8a. The corresponding diagram of the H2 density
distribution is shown in Fig. 8b. Solutions are found between
![]() and
and
![]() .
In general, the H2 densities
are high in regions with low kinetic temperatures and vice versa. The solutions
for the outer CO lobes suggest an H2 density about
.
In general, the H2 densities
are high in regions with low kinetic temperatures and vice versa. The solutions
for the outer CO lobes suggest an H2 density about
![]() with a tendency towards somewhat lower values at the very edge of
the CO distribution (
with a tendency towards somewhat lower values at the very edge of
the CO distribution (
![]() ). These values
are in agreement with H2 densities calculated by Wild et al. (1992)
and Mao et al. (2000). At the "hot-spot'', low H2 densities of
). These values
are in agreement with H2 densities calculated by Wild et al. (1992)
and Mao et al. (2000). At the "hot-spot'', low H2 densities of
![]() are required to match the observed line
ratios. H2 densities in the CO outflow are about
are required to match the observed line
ratios. H2 densities in the CO outflow are about
![]() .
.
Both the
![]() and the
and the
![]() transitions are optically thick.
In the cold dense regions we find an optical depth of
transitions are optically thick.
In the cold dense regions we find an optical depth of
![]() and
and
![]() .
At the "hot-spots'' the derived optical depths are somewhat
lower and reach unity in the
.
At the "hot-spots'' the derived optical depths are somewhat
lower and reach unity in the
![]() transition at the eastern MIR peak
(position 6 & 7). For the ground transitions of the rare isotopes
transition at the eastern MIR peak
(position 6 & 7). For the ground transitions of the rare isotopes
![]() and
and
![]() we find optically thin emission at all positions. Typical
optical depths are
we find optically thin emission at all positions. Typical
optical depths are
![]() and
and
![]() .
.
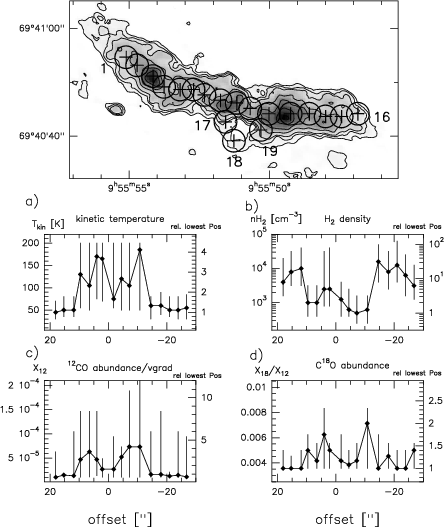 |
Figure 8:
LVG solutions for positions 1 to 16. Top: locations of the analyzed
positions. The radii of the circles indicate the spatial resolution for which
the line ratios have been determined. a) to d): spatial variations of the kinetic
temperature, the H2 density, the CO abundance per velocity gradient and the
fractional
|
For the determination of CO and H2 column densities at each position we
used three methods:
- LVG: The column densities were derived from the CO and H2 densities,
the velocity gradient and the observed line widths using
![]() and
and
![]() ,
where dV is the
observed line width. Therefore
,
where dV is the
observed line width. Therefore
![]() is an equivalent
path length through the clouds;
is an equivalent
path length through the clouds;
- LVG![]() (PF=partition function): the
(PF=partition function): the
![]() and
and
![]() column
densities were calculated from the general relation between optical depth,
excitation temperature and column density at rotation level J:
column
densities were calculated from the general relation between optical depth,
excitation temperature and column density at rotation level J:
![]() where gJ is the statistical weight of
level J and AJ+1,J is the Einstein coefficient for the
transition J+1 to J.
where gJ is the statistical weight of
level J and AJ+1,J is the Einstein coefficient for the
transition J+1 to J.
![]() was approximated by
was approximated by
![]() .
.
![]() and
and ![]() are given by the LVG code for each level.
are given by the LVG code for each level.
![]() and
and
![]() column densities
were determined using the sum of the 6 lowest levels for each isotope.
H2 and CO column densities were derived from the relative abundances
of the rare isotopes relative to H2 and CO;
column densities
were determined using the sum of the 6 lowest levels for each isotope.
H2 and CO column densities were derived from the relative abundances
of the rare isotopes relative to H2 and CO;
- LTE:
![]() and
and
![]() column densities were derived using a standard LTE
approach (e.g. Dickman 1978). As for the LVG
column densities were derived using a standard LTE
approach (e.g. Dickman 1978). As for the LVG![]() method, CO and
H2 column densities were derived from the abundances of the rare
isotopes relative to CO and H2 at each position.
method, CO and
H2 column densities were derived from the abundances of the rare
isotopes relative to CO and H2 at each position.
Column densities calculated from
![]() and
and
![]() via the LTE method match
each other with less than 5% difference at each position. The same holds
for the LVG
via the LTE method match
each other with less than 5% difference at each position. The same holds
for the LVG![]() column densities calculated from
column densities calculated from
![]() and
and ![]() of
the
of
the
![]() and
and
![]() transition. For simplicity we therefore give in the
following the average between the column densities calculated from
transition. For simplicity we therefore give in the
following the average between the column densities calculated from
![]() and
and
![]() via the LTE and LVG
via the LTE and LVG![]() method.
method.
The spatial variations of the beam-averaged H2 column density across the
major axis of M82 as calculated with the three methods is shown in
Fig. 9. The spatial distribution of the H2 column densities
is in good agreement for all three methods. This suggests that the low J levels
are almost thermalized. The largest difference between the methods is apparent at
the central CO peak. While the LTE solutions suggest
a local H2 column density maximum of about
![]() ,
the peak is less prominent (
,
the peak is less prominent (
![]() )
and displaced by 4'' in the LVG and LVG
)
and displaced by 4'' in the LVG and LVG![]() solution
(see Fig. 9).
solution
(see Fig. 9).
Nevertheless, all methods clearly show that most of the molecular
gas traced by CO is located in the outer CO lobes. The central 300 pc between
the molecular lobes contain only about 20-30% of the molecular gas mass.
Furthermore, the H2 column density distribution is clearly asymmetric with
respect to the 2.2 m![]() m nucleus. We find that the centroid of mass is located
about 100 pc south-east of the nucleus. The location of the centroid of
mass for each method is indicated by the vertical line in Fig. 9.
The highest H2 column density is found at the western CO lobe (position 12).
Its beam-averaged LVG column densities are
m nucleus. We find that the centroid of mass is located
about 100 pc south-east of the nucleus. The location of the centroid of
mass for each method is indicated by the vertical line in Fig. 9.
The highest H2 column density is found at the western CO lobe (position 12).
Its beam-averaged LVG column densities are
![]() and
and
![]() .
The corresponding cloud-averaged LVG column densities are
.
The corresponding cloud-averaged LVG column densities are
![]() and
and
![]() ,
respectively. The corresponding values for the eastern
CO lobe (position 3) are
,
respectively. The corresponding values for the eastern
CO lobe (position 3) are
![]() ,
,
![]() ,
,
![]() and
and
![]() .
For an assumed line-of-sight of 350pc (for comparison with
Mao et al. 2000) the mean molecular density in the CO lobes is
.
For an assumed line-of-sight of 350pc (for comparison with
Mao et al. 2000) the mean molecular density in the CO lobes is
![]() .
This corresponds to a volume filling
factor of
.
This corresponds to a volume filling
factor of
![]() .
With
.
With
![]() and a linear resolution of 65pc we obtain characteristic cloud sizes of
and a linear resolution of 65pc we obtain characteristic cloud sizes of
![]() .
Volume filling factors and characteristic cloud sizes do not change
significantly in the central star forming regions. These values are in
good agreement with PDR models published
by Wolfire et al. (1990).
.
Volume filling factors and characteristic cloud sizes do not change
significantly in the central star forming regions. These values are in
good agreement with PDR models published
by Wolfire et al. (1990).
H2 column densities in the molecular
outflow are in the range
![]() -
-
![]() .
The total mass of the outflow is
.
The total mass of the outflow is
![]() (D=3.9 Mpc,
Sakai & Madore 1999).
(D=3.9 Mpc,
Sakai & Madore 1999).
To derive the conversion factor from I(CO) to N(H2), we have compared LVG, LTE, and
LVG![]() H2 column densities with the integrated
H2 column densities with the integrated
![]() intensities at
4.2'' resolution at the analyzed positions across the central part of M82.
The variation of the conversion factor
intensities at
4.2'' resolution at the analyzed positions across the central part of M82.
The variation of the conversion factor
![]() with position
is shown in Fig. 10. Note that
with position
is shown in Fig. 10. Note that
![]() is lower than the Galactic value
of
is lower than the Galactic value
of
![]() (Hunter et al.
1997) at all positions and for all methods. We find that
(Hunter et al.
1997) at all positions and for all methods. We find that
![]() varies across the disk of M82 by about a factor of 5 if one considers the
LTE solutions (
varies across the disk of M82 by about a factor of 5 if one considers the
LTE solutions (
![]() -
-
![]() )
and by a factor of 8-9 for the LVG and LVG
)
and by a factor of 8-9 for the LVG and LVG![]() solutions
(
solutions
(
![]() -
-
![]() and
and
![]() -
-
![]() ). All methods show that the lowest conversion
factors are associated with the central star-forming regions where the
gas is heated by UV photons from the newly formed stars and cosmic-rays from SNRs.
The CO-emitting volumes at these positions have high kinetic temperatures.
Towards the outer molecular lobes with higher H2 densities and lower kinetic
temperatures, the conversion factor rises.
This is in agreement with simple
theoretical arguments that suggest that the conversion factor
). All methods show that the lowest conversion
factors are associated with the central star-forming regions where the
gas is heated by UV photons from the newly formed stars and cosmic-rays from SNRs.
The CO-emitting volumes at these positions have high kinetic temperatures.
Towards the outer molecular lobes with higher H2 densities and lower kinetic
temperatures, the conversion factor rises.
This is in agreement with simple
theoretical arguments that suggest that the conversion factor
![]() should
be proportional to
should
be proportional to
![]() for virialized
clouds (Maloney & Black 1988). The variation of
for virialized
clouds (Maloney & Black 1988). The variation of
![]() with
with
![]() is shown in Fig. 11.
The linear correlation between
is shown in Fig. 11.
The linear correlation between
![]() and
and
![]() for
for
![]() is
clearly visible. For
is
clearly visible. For
![]() the scatter
in the plot increases.
This is in particular true for
the scatter
in the plot increases.
This is in particular true for
![]() calculated under the
assumption of LTE. This suggests that the gas is not close to LTE at the
"hot spots''. The increased scatter of
calculated under the
assumption of LTE. This suggests that the gas is not close to LTE at the
"hot spots''. The increased scatter of
![]() calculated with the LVG and
LVG
calculated with the LVG and
LVG![]() method might suggest that either the clouds are not virialized
or that more appropriate models (like PDR models) are required to calculate
the physical gas properties in the center of the starburst. For a more
detailed discussion see Sect. 4.1. Nevertheless, this
result not only shows that the standard Galactic
method might suggest that either the clouds are not virialized
or that more appropriate models (like PDR models) are required to calculate
the physical gas properties in the center of the starburst. For a more
detailed discussion see Sect. 4.1. Nevertheless, this
result not only shows that the standard Galactic
![]() factor is not
appropriate for a starburst system like M82, but that
factor is not
appropriate for a starburst system like M82, but that
![]() is a
function of the intrinsic gas properties which strongly depend on
environmental effects. This implies that spatial variations of ^12CO(J=10)
is a
function of the intrinsic gas properties which strongly depend on
environmental effects. This implies that spatial variations of ^12CO(J=10)
![]() intensities can be due to variations of the excitation conditions of the gas
rather than variations of column density. Similar results have been obtained by
Wild et al. (1992) using low-resolution CO data (see also Sect. 4.3).
Based on the analysis of
intensities can be due to variations of the excitation conditions of the gas
rather than variations of column density. Similar results have been obtained by
Wild et al. (1992) using low-resolution CO data (see also Sect. 4.3).
Based on the analysis of
![]() we have calculated the "true''
H_2H2 distribution in M82 by interpolating the changes of
we have calculated the "true''
H_2H2 distribution in M82 by interpolating the changes of
![]() from the
analyzed positions across the central CO distribution. Multiplication of this
X_CO
from the
analyzed positions across the central CO distribution. Multiplication of this
X_CO
![]() -map with the integrated
-map with the integrated
![]() intensity distribution thus results in an
H2 column density map. We show these maps in Fig. 12 for
intensity distribution thus results in an
H2 column density map. We show these maps in Fig. 12 for
![]() derived from the LVG
derived from the LVG![]() (top) and LTE solutions (middle) in comparison with
the H2 distribution one would derive assuming a constant, standard Galactic
conversion (bottom) to illustrate the importance of detailed studies of
(top) and LTE solutions (middle) in comparison with
the H2 distribution one would derive assuming a constant, standard Galactic
conversion (bottom) to illustrate the importance of detailed studies of
![]() to derive H2 column density distributions. The H2 column density maps
in Fig. 12 (top and middle) indicate that the central star-forming
region is surrounded by a double-lobed distribution of molecular gas, while
H2 seems to be depleted in the central starburst region itself (see also Fig. 9).
to derive H2 column density distributions. The H2 column density maps
in Fig. 12 (top and middle) indicate that the central star-forming
region is surrounded by a double-lobed distribution of molecular gas, while
H2 seems to be depleted in the central starburst region itself (see also Fig. 9).
The total H2 mass of the region shown in Fig. 12 is
![]() for the LVG
for the LVG![]() and LVG and
and LVG and
![]() for the LTE solution
at a distance of D=3.9 Mpc
(Sakai & Madore 1999). The corresponding values at
D=3.25 Mpc (Tammann & Sandage 1968) are 1.6 and
for the LTE solution
at a distance of D=3.9 Mpc
(Sakai & Madore 1999). The corresponding values at
D=3.25 Mpc (Tammann & Sandage 1968) are 1.6 and
![]() ,
respectively. These values are in good agreement with estimates from 450 m
,
respectively. These values are in good agreement with estimates from 450 m![]() m dust
continuum measurements (Smith et al. 1991) and from C18O(2
m dust
continuum measurements (Smith et al. 1991) and from C18O(2![]() 1) intensities
(Wild et al. 1992). Therefore, the total molecular mass is 3 times lower
than the mass one would derive using the standard Galactic conversion factor of
1) intensities
(Wild et al. 1992). Therefore, the total molecular mass is 3 times lower
than the mass one would derive using the standard Galactic conversion factor of
![]() (
(
![]() D=3.25 Mpc;
D=3.25 Mpc;
![]() D=3.9 Mpc).
D=3.9 Mpc).
Copyright ESO 2001