We present the results of a high angular resolution, multi-transition analysis of the molecular gas in M82. The analysis is based on the two lowest transitions of
A&A 365, 571-587 (2001)
DOI: 10.1051/0004-6361:20000145
A. Weiß1 - N. Neininger1 - S. Hüttemeister1 - U. Klein1
Send offprint request: A. Weiß,
Radioastronomisches Institut der Universität Bonn (RAIUB), Auf dem Hügel 71, 53121 Bonn, Germany
Received 27 July 2000 / Accepted 11 October 2000
Abstract
We present the results of a high angular resolution, multi-transition
analysis of the molecular gas in M82. The analysis is based on the two
lowest transitions of
![]() and the ground transition of the rare
isotopes
and the ground transition of the rare
isotopes
![]() and
and
![]() measured with the PdBI,
the BIMA array and the IRAM 30 m telescope.
In order to address the question of how the intrinsic molecular cloud
properties are influenced by massive star formation we have carried out
radiative transfer calculations based on the observed CO line ratios.
The calculations suggest that the kinetic temperature of the molecular
gas is high in regions with strong star formation and drops towards the
outer molecular lobes with less ongoing star formation. The location of
the highest kinetic temperature is coincident with that of
the mid infrared (MIR) peaks which trace emission from hot dust. The hot
gas is associated with low H2 densities while the cold gas in the outer
molecular lobes has high H2 densities. We find that CO intensities do
not trace H2 column densities well. Most of the molecular gas is distributed
in a double-lobed distribution which surrounds the starburst. A detailed
analysis of the conversion factor from CO intensity to H2 column density
shows that
measured with the PdBI,
the BIMA array and the IRAM 30 m telescope.
In order to address the question of how the intrinsic molecular cloud
properties are influenced by massive star formation we have carried out
radiative transfer calculations based on the observed CO line ratios.
The calculations suggest that the kinetic temperature of the molecular
gas is high in regions with strong star formation and drops towards the
outer molecular lobes with less ongoing star formation. The location of
the highest kinetic temperature is coincident with that of
the mid infrared (MIR) peaks which trace emission from hot dust. The hot
gas is associated with low H2 densities while the cold gas in the outer
molecular lobes has high H2 densities. We find that CO intensities do
not trace H2 column densities well. Most of the molecular gas is distributed
in a double-lobed distribution which surrounds the starburst. A detailed
analysis of the conversion factor from CO intensity to H2 column density
shows that
![]() depends on the excitation conditions. We find
depends on the excitation conditions. We find
![]() ,
as expected for virialized clouds.
,
as expected for virialized clouds.
Key words: ISM: evolution - ISM: molecules - ISM: structure - galaxies: individual: M82 - galaxies: ISM - galaxies: starburst
Author for correspondance: aweiss@astro.uni-bonn.de
M82 is regarded as the archetypical starburst galaxy (Rieke et al.
1980). Its distance of only 3.9 Mpc (Sakai & Madore
1999) makes M82 an excellent laboratory for studying the relevant
physical processes connected with starburst activity in detail. The central
few hundred parsecs of this galaxy are heavily obscured by dust and gas which
hides the central starburst region against direct observations at optical
wavelengths. Evidence for the strong star-forming activity in the central
region comes from radio (e.g. Kronberg et al. 1985; Wills et al.
1999) and infrared observations (e.g. Telesco & Gezari 1992)
and also from the prominent bipolar outflow visible in
![]() (e.g. Bland &
Tully 1988; McKeith et al. 1995; Shopbell & Bland-Hawthorn
1998) and X-rays (e.g. Bregman et al. 1995). The massive
star formation (SF) is believed to be fueled by the large amount of molecular
gas which is present in the center of M82.
(e.g. Bland &
Tully 1988; McKeith et al. 1995; Shopbell & Bland-Hawthorn
1998) and X-rays (e.g. Bregman et al. 1995). The massive
star formation (SF) is believed to be fueled by the large amount of molecular
gas which is present in the center of M82.
On the other hand, SF affects the distribution, kinematics and physical
conditions of the surrounding interstellar medium (ISM). Early studies of
the distribution of the molecular gas in M82 unveiled a double-lobed
circumnuclear distribution of CO which was interpreted as a molecular torus
with a depletion of molecular gas in the central region (Nakai et al.
1987). More recent high-resolution studies by Shen & Lo (1995)
using BIMA and Neininger et al. (1998) using the IRAM interferometer at
Plateau de Bure (PdBI) showed a third molecular peak 65 pc west of the 2.2 m![]() m
nucleus (Dietz et al. 1986).
Using these high-resolution CO maps Weiß et al. (1999) identified
an expanding superbubble in the molecular gas of M82 which links the triple
peak CO distribution and its disturbed velocity field to the prominent outflow
visible in
m
nucleus (Dietz et al. 1986).
Using these high-resolution CO maps Weiß et al. (1999) identified
an expanding superbubble in the molecular gas of M82 which links the triple
peak CO distribution and its disturbed velocity field to the prominent outflow
visible in
![]() and X-rays.
and X-rays.
Multi-transition analyses of molecular emission lines (CO, CS, HCN) showed
that the starburst also affects the physical conditions of the molecular gas
(Wild et al. 1992; Henkel & Bally 1985; Brouillet &
Schilke 1993). A large fraction of the molecular gas is concentrated
in warm (
![]() =50 K) and dense (n(H2)=104 cm-3) clouds
(Wild
et al. 1992; Güsten et al. 1993). In a recent study Mao
et al. (2000) analyzed CO mm and sub-mm emission lines in M82 to
investigate the physical properties of the molecular clouds. They conclude that
the bulk of CO emission arises from photon-dominated regions (PDRs) while
tracers of high-density gas like CS and HCN are less affected by the strong
UV radiation from massive stars.
=50 K) and dense (n(H2)=104 cm-3) clouds
(Wild
et al. 1992; Güsten et al. 1993). In a recent study Mao
et al. (2000) analyzed CO mm and sub-mm emission lines in M82 to
investigate the physical properties of the molecular clouds. They conclude that
the bulk of CO emission arises from photon-dominated regions (PDRs) while
tracers of high-density gas like CS and HCN are less affected by the strong
UV radiation from massive stars.
Even though these studies already provided a good global picture of the physical
conditions of the molecular gas in M82, no detailed high-resolution study
exists so far that allows to resolve variations of the excitation conditions
of the molecular gas over the central part of M82. In this paper we present
the results of a high angular resolution, multi-transition CO analysis and
compare the intrinsic gas properties with observations of high-level star
formation. In Sect. 2 we briefly summarize our observations and the data
reduction. In Sect. 3 we describe the main results including a description
of the CO morphology and kinematics, the CO line ratios, results from the
LVG calculation and on
![]() .
In Sect. 4 we compare our results to previous
studies. Section 5 summarizes our conclusions.
.
In Sect. 4 we compare our results to previous
studies. Section 5 summarizes our conclusions.
We have used the PdBI to observe the
![]() (
(
![]() GHz) and
GHz) and
![]() (
(
![]() GHz)
emission lines in the central region of M82. The observations were carried out
in April 1997. Due to the dual frequency setup of the PdBI we were able to
observe both emission lines simultaneously. The observations were carried out in
mosaic mode with seven pointings covering the central kpc of M82. The central
pointing was centered on the 2.2 m
GHz)
emission lines in the central region of M82. The observations were carried out
in April 1997. Due to the dual frequency setup of the PdBI we were able to
observe both emission lines simultaneously. The observations were carried out in
mosaic mode with seven pointings covering the central kpc of M82. The central
pointing was centered on the 2.2 m![]() m nucleus at
m nucleus at
![]() (J2000.0) (Dietz et al. 1986).
The other pointings were shifted with
respect to the central position by
(J2000.0) (Dietz et al. 1986).
The other pointings were shifted with
respect to the central position by
![]() =
(-30'',-8''),
(-20'',-6''),
(-10'',-4''),
(10'',4''),
(20'',8''),
(30'',10'')
which ensured sufficient overlap of the observed fields at 230 GHz. The primary
beam of the PdBI is 22'' and 45'' at 230 GHz and 109 GHz respectively.
The observations were carried out in the DC2 antenna configuration with
baselines ranging from 24 m to 176 m leading to a synthesized beam of
=
(-30'',-8''),
(-20'',-6''),
(-10'',-4''),
(10'',4''),
(20'',8''),
(30'',10'')
which ensured sufficient overlap of the observed fields at 230 GHz. The primary
beam of the PdBI is 22'' and 45'' at 230 GHz and 109 GHz respectively.
The observations were carried out in the DC2 antenna configuration with
baselines ranging from 24 m to 176 m leading to a synthesized beam of
![]() at 109 GHz and
at 109 GHz and
![]() at 230 GHz.
at 230 GHz.
The
![]() data were recorded using two correlator units leading to a total
bandwidth of 780 kms-1 with 6.83 kms-1 resolution. For the
data were recorded using two correlator units leading to a total
bandwidth of 780 kms-1 with 6.83 kms-1 resolution. For the
![]() transition
we used four correlator units which resulted in a total bandwidth of 390 kms-1
and a velocity resolution of 3.25 kms-1. The
transition
we used four correlator units which resulted in a total bandwidth of 390 kms-1
and a velocity resolution of 3.25 kms-1. The
![]() emission line was observed
in the lower sideband of the 230 GHz, the
emission line was observed
in the lower sideband of the 230 GHz, the
![]() emission line in the upper
sideband of the 109 GHz receiver. The flux and complex bandpass calibration
was determined by observing 3C 273 and MWC 349. The nearby calibrator 0836+710
was used as a secondary amplitude and phase calibrator. The seven fields were
combined in a mosaic and subsequently CLEANed using the MAPPING procedure of the
GILDAS software package. This yields a roughly constant sensitivity along the
major axis of M82 with an rms noise of 6 mJy/beam at 109 GHz and
30 mJy/beam at 230 GHz. For both data sets the channels with
emission line in the upper
sideband of the 109 GHz receiver. The flux and complex bandpass calibration
was determined by observing 3C 273 and MWC 349. The nearby calibrator 0836+710
was used as a secondary amplitude and phase calibrator. The seven fields were
combined in a mosaic and subsequently CLEANed using the MAPPING procedure of the
GILDAS software package. This yields a roughly constant sensitivity along the
major axis of M82 with an rms noise of 6 mJy/beam at 109 GHz and
30 mJy/beam at 230 GHz. For both data sets the channels with
![]() and
and
![]() were used to generate a continuum
map at 109 GHz and 230 GHz. The continuum emission was subtracted from both
emission line data cubes.
were used to generate a continuum
map at 109 GHz and 230 GHz. The continuum emission was subtracted from both
emission line data cubes.
In addition to the high-resolution CO data we observed the
![]() ,
,
![]() and
and
![]() emission lines with the IRAM 30 m telescope in on-the-fly mode. The
observations covered an area of
emission lines with the IRAM 30 m telescope in on-the-fly mode. The
observations covered an area of
![]() centered on the 2.2 m
centered on the 2.2 m![]() m nucleus.
The
m nucleus.
The
![]() observations were carried out in Nov. 1997. The
observations were carried out in Nov. 1997. The
![]() and
and
![]() data were observed in Nov. 1997, Dec. 1998 and June 1999. For all observations
we used the same observing procedure: The scanning velocity was 2''/s and
the readout sampling 1 s leading to a spatial separation of 2'' between
individual spectra in scanning direction. The spatial separation between
individual scans was 4''. Thus each on-the-fly map was sampled on
a
data were observed in Nov. 1997, Dec. 1998 and June 1999. For all observations
we used the same observing procedure: The scanning velocity was 2''/s and
the readout sampling 1 s leading to a spatial separation of 2'' between
individual spectra in scanning direction. The spatial separation between
individual scans was 4''. Thus each on-the-fly map was sampled on
a
![]() grid. For the
grid. For the
![]() transition we performed two coverages,
for the other two transitions we performed four coverages with perpendicular
scanning directions. The combined data therefore were sampled on a
transition we performed two coverages,
for the other two transitions we performed four coverages with perpendicular
scanning directions. The combined data therefore were sampled on a
![]() grid. After first-order baseline subtraction the spectra were summed on a
grid. After first-order baseline subtraction the spectra were summed on a
![]() grid using the beam (11'' at 230 GHz, 22'' at 109 GHz)
and the rms noise level for weighting. This observing and reduction procedure
guarantees a smooth data sampling and avoids artifacts in the combination with
the interferometric data. The total integration time per beam was 65 s for
the
grid using the beam (11'' at 230 GHz, 22'' at 109 GHz)
and the rms noise level for weighting. This observing and reduction procedure
guarantees a smooth data sampling and avoids artifacts in the combination with
the interferometric data. The total integration time per beam was 65 s for
the
![]() ,
45 s for the
,
45 s for the
![]() and 130 s for
and 130 s for
![]() transition resulting
in an rms noise of 40 mK, 65 mK and 15 mK. As backends we used the
autocorrelators which lead to a total bandwidth and velocity resolution of
650 kms-1/2.6 kms-1, 650 kms-1/1.3 kms-1 and 695 kms-1/2.7 kms-1 for the
transition resulting
in an rms noise of 40 mK, 65 mK and 15 mK. As backends we used the
autocorrelators which lead to a total bandwidth and velocity resolution of
650 kms-1/2.6 kms-1, 650 kms-1/1.3 kms-1 and 695 kms-1/2.7 kms-1 for the
![]() ,
,
![]() and
and
![]() transitions respectively. For the conversion from
transitions respectively. For the conversion from
![]() to
to
![]() we used
we used
![]() at 115 GHz (Guélin et al.
1995) and
at 115 GHz (Guélin et al.
1995) and
![]() at 230 GHz (Greve et al.
1998).
at 230 GHz (Greve et al.
1998).
To ensure that the interferometric line intensities do not suffer from
missing flux due to extended emission we combined the interferometer and
the single-dish data cubes. For the combination we used a method that
works on the final reduced (CLEANed and corrected for primary beam attenuation)
interferometer cubes. The only free parameter in this method is the choice
of which part of the uv-plane in the interferometer cube is replaced
by the single-dish values. A detailed description of the method is given
in the Appendix. The parameters for the 30 m beam sizes, the corresponding
effective diameter of the 30 m telescope, the shortest baseline, the replaced
part of the uv-plane and the missing flux of the interferometer maps
are given in Table 1. All reduction steps were done using the MIRIAD
software package. We applied the short-spacing correction to the
![]() cube obtained by Shen & Lo (1995), the
cube obtained by Shen & Lo (1995), the
![]() cube from Neininger et al.
(1998) and to the
cube from Neininger et al.
(1998) and to the
![]() cube.
cube.
| 12 CO(1-0) | 12CO(2-1) | 13CO(1-0) | |
| FWHM | 22'' | 11'' | 22'' |
|
|
28.1 m | 24.4 m | 28.1 m |
| unknown | 24 m | 24 m | |
|
|
<9.4 | <18.5 | <8.0 |
| miss. flux | 20 % | 60 % | 35 % |
Figures 1 and 2 show the integrated
![]() and
and
![]() line intensities. The overall morphology of both images is very similar to the
line intensities. The overall morphology of both images is very similar to the
![]() distribution published by Shen & Lo (1995) and the
distribution published by Shen & Lo (1995) and the
![]() distribution published by Neininger et al. (1998). It shows a
triple peak morphology of which the two outer lobes have been interpreted as the
edge of a central molecular toroid (Nakai et al. 1987; Shen & Lo
1995) and a weaker central peak located 65 pc west of the M82's
center (2.2 m
distribution published by Neininger et al. (1998). It shows a
triple peak morphology of which the two outer lobes have been interpreted as the
edge of a central molecular toroid (Nakai et al. 1987; Shen & Lo
1995) and a weaker central peak located 65 pc west of the M82's
center (2.2 m![]() m peak; Dietz et al. 1986). The two outer lobes
have a projected separation of 410 pc (26''). The separation of the central
and the western molecular lobe is only about 130 pc (8''). More diffuse CO
emission is detected in the
m peak; Dietz et al. 1986). The two outer lobes
have a projected separation of 410 pc (26''). The separation of the central
and the western molecular lobe is only about 130 pc (8''). More diffuse CO
emission is detected in the
![]() intensity distribution east and west of the
CO peaks and in the south-west of the galaxy. The eastern part of the CO
distribution is significantly warped to the north. The total extent of the
emission region is about 1 kpc from east to west. With respect to M82's
center the distribution of the molecular gas is clearly displaced to the west.
South of the central and western CO peak two CO spurs are detected
(see Fig. 1). They extend about 100 pc below the main
molecular disk and join just below the expanding molecular superbubble which
is located between the central and western CO peak (Neininger et al. 1998;
Weiß et al. 1999). At the same location hot gas emerges into the
halo of M82 (e.g. Shopbell & Bland-Hawthorn 1998; Bregman et al.
1995) supporting the idea that the CO spurs indicate the walls of
the superbubble.
intensity distribution east and west of the
CO peaks and in the south-west of the galaxy. The eastern part of the CO
distribution is significantly warped to the north. The total extent of the
emission region is about 1 kpc from east to west. With respect to M82's
center the distribution of the molecular gas is clearly displaced to the west.
South of the central and western CO peak two CO spurs are detected
(see Fig. 1). They extend about 100 pc below the main
molecular disk and join just below the expanding molecular superbubble which
is located between the central and western CO peak (Neininger et al. 1998;
Weiß et al. 1999). At the same location hot gas emerges into the
halo of M82 (e.g. Shopbell & Bland-Hawthorn 1998; Bregman et al.
1995) supporting the idea that the CO spurs indicate the walls of
the superbubble.
Note that the chain of CO emission south of the eastern end of the
![]() distribution is most likely not real but an artifact from the primary beam
correction. The kinematic of the central 400 pc is dominated by solid
body rotation. The rotation amplitude is about 200 kms-1 ranging from
115 kms-1 at the western peak up to 320 kms-1 at the eastern peak. A
pv-diagram along the major axis of M82 in the
distribution is most likely not real but an artifact from the primary beam
correction. The kinematic of the central 400 pc is dominated by solid
body rotation. The rotation amplitude is about 200 kms-1 ranging from
115 kms-1 at the western peak up to 320 kms-1 at the eastern peak. A
pv-diagram along the major axis of M82 in the
![]() transition is shown
in Fig. 3. (For the corresponding diagram in the
transition is shown
in Fig. 3. (For the corresponding diagram in the
![]() data
see Weiß et al. 1999). The pv-diagram is centered on the
brightest supernova remnant SNR 41.9+58. The intense, velocity crowded regions at
20'', 5'' and -7'' offset correspond to the western, central and
eastern CO peak. Between the central and western CO peaks two velocity
components at 100 kms-1 and 190 kms-1 are detected. These features
have been interpreted as an expanding superbubble. The velocity of the CO spurs
is about 140 kms-1 (see Figs. 4 and 5) which is
similar to the centroid velocity of the expanding superbubble. Outside the
central 400 pc the CO rotation curve flattens. The dynamical center derived
from the
data
see Weiß et al. 1999). The pv-diagram is centered on the
brightest supernova remnant SNR 41.9+58. The intense, velocity crowded regions at
20'', 5'' and -7'' offset correspond to the western, central and
eastern CO peak. Between the central and western CO peaks two velocity
components at 100 kms-1 and 190 kms-1 are detected. These features
have been interpreted as an expanding superbubble. The velocity of the CO spurs
is about 140 kms-1 (see Figs. 4 and 5) which is
similar to the centroid velocity of the expanding superbubble. Outside the
central 400 pc the CO rotation curve flattens. The dynamical center derived
from the
![]() and
and
![]() data agrees very well with the value of
data agrees very well with the value of
![]() published by Shen & Lo (1995) for
the
published by Shen & Lo (1995) for
the
![]() ,
and Neininger et al. (1998) for the
,
and Neininger et al. (1998) for the
![]() transition.
The channel maps of the
transition.
The channel maps of the
![]() and
and
![]() line emission are presented in
Figs. 4 and 5.
line emission are presented in
Figs. 4 and 5.
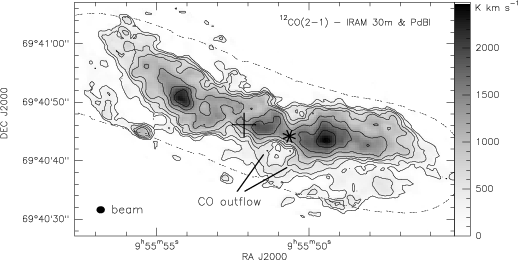 |
Figure 1:
Integrated
|
| Open with DEXTER | |
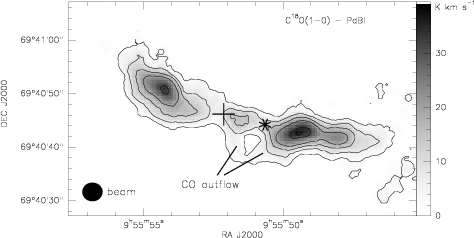 |
Figure 2:
Integrated
|
| Open with DEXTER | |
Most tracers of star formation in M82 indicate that the highest
star-forming activity is not associated with the molecular peaks,
which presumably indicate the location of the reservoirs for the "fuel''
for star formation, but rather takes place between the peaks.
The high-resolution 12.4 m![]() m image of the central region of
M82 published by Telesco & Gezari (1992) suggests that
the young stellar clusters, which heat the dust, are located between the
western molecular lobe and the 2.2 m
m image of the central region of
M82 published by Telesco & Gezari (1992) suggests that
the young stellar clusters, which heat the dust, are located between the
western molecular lobe and the 2.2 m![]() m nucleus (western mid infrared (MIR)
peaks), at the central CO peak, and between the central CO peak and the eastern
CO lobe (eastern MIR peak). A similar morphology is visible in the Ne II
line emission (Achtermann & Lacy 1995). The radio continuum point
sources, which are believed to be supernova remnants (SNR) and compact
H II regions, are spread across a much wider region and seem to avoid
MIR and Ne II peaks (Kronberg et al. 1985). Only the
strongest SNR in M82, SNR41.9+58, appears to be related to features at
other wavelengths: it is located near the center of the expanding molecular
superbubble, between the central and western CO peak, from which hot X-ray
emitting gas is released into the halo of M82 (Weiß et al. 1999).
At the same location recent radio continuum studies by Wills et al.
(1999) identified a blow-out in the form of a cone of missing 5-GHz
continuum emission. In the same study three other chimneys were identified
within the central 300pc of M82. All these observations
indicate that the regions of violent star formation are confined by the
molecular lobes. Since no indications for high activity have been found at the
2.2 m
m nucleus (western mid infrared (MIR)
peaks), at the central CO peak, and between the central CO peak and the eastern
CO lobe (eastern MIR peak). A similar morphology is visible in the Ne II
line emission (Achtermann & Lacy 1995). The radio continuum point
sources, which are believed to be supernova remnants (SNR) and compact
H II regions, are spread across a much wider region and seem to avoid
MIR and Ne II peaks (Kronberg et al. 1985). Only the
strongest SNR in M82, SNR41.9+58, appears to be related to features at
other wavelengths: it is located near the center of the expanding molecular
superbubble, between the central and western CO peak, from which hot X-ray
emitting gas is released into the halo of M82 (Weiß et al. 1999).
At the same location recent radio continuum studies by Wills et al.
(1999) identified a blow-out in the form of a cone of missing 5-GHz
continuum emission. In the same study three other chimneys were identified
within the central 300pc of M82. All these observations
indicate that the regions of violent star formation are confined by the
molecular lobes. Since no indications for high activity have been found at the
2.2 m![]() m nucleus itself, it seems that the starburst is arranged in a toroidal
topology around the nucleus.
m nucleus itself, it seems that the starburst is arranged in a toroidal
topology around the nucleus.
| |
Figure 3:
A pv-diagram along the major axis of M82 in the
|
| Open with DEXTER | |
To calculate the line ratios properly we used the short-spacing corrected
![]() ,
,
![]() and
and
![]() data cubes. Note that the missing flux in the pure
interferometric maps can be as high as 60% (see Table 1). Therefore
the short-spacing correction is vital to derive proper line ratios. The
short-spacing correction is less crucial for the peak line intensities.
Here the missing flux is 10%-30% only. The
data cubes. Note that the missing flux in the pure
interferometric maps can be as high as 60% (see Table 1). Therefore
the short-spacing correction is vital to derive proper line ratios. The
short-spacing correction is less crucial for the peak line intensities.
Here the missing flux is 10%-30% only. The
![]() ,
,
![]() and
and
![]() data
were smoothed to the resolution of the
data
were smoothed to the resolution of the
![]() observations (4.2'').
Since no single-dish data were obtained for the
observations (4.2'').
Since no single-dish data were obtained for the
![]() transition
we applied the missing flux factors derived from the
transition
we applied the missing flux factors derived from the
![]() peak intensity
distribution to the
peak intensity
distribution to the
![]() observations. This procedure is justified
because the frequency of both transitions is similar and the observations
were carried out in the same configurations with the PdBI. This leads to
similar uv-coverages for both observations. Furthermore the
morphology in the interferometer maps is similar and both transitions are
optically thin (see Sect. 3.4). To take the
remaining uncertainties into account we assumed an error of 50% for the
observations. This procedure is justified
because the frequency of both transitions is similar and the observations
were carried out in the same configurations with the PdBI. This leads to
similar uv-coverages for both observations. Furthermore the
morphology in the interferometer maps is similar and both transitions are
optically thin (see Sect. 3.4). To take the
remaining uncertainties into account we assumed an error of 50% for the
![]() line intensities. The line ratios were calculated at 19 positions across the CO
distribution of M82. The spacing between individual positions is about 4''.
The analyzed positions are marked by the crosses in Fig. 8.
The circles indicate the FWHM of 4.2'' used in the study. The positions
include all molecular peaks, the 2.2 m
line intensities. The line ratios were calculated at 19 positions across the CO
distribution of M82. The spacing between individual positions is about 4''.
The analyzed positions are marked by the crosses in Fig. 8.
The circles indicate the FWHM of 4.2'' used in the study. The positions
include all molecular peaks, the 2.2 m![]() m nucleus, the MIR peaks, the CO spurs
and the diffuse emission in the outer regions of M82. For clarity the
positions have been labeled 1 to 16 from east to west. Positions 17 to 19
correspond to positions on the CO outflow (see Fig. 8).
The line ratios at the analyzed positions are summarized in Table 2.
Errors include 10% uncertainty of the flux calibrators, errors of the
amplitude calibration (typically about 10%) and statistical errors. Our
high-resolution line ratios for
m nucleus, the MIR peaks, the CO spurs
and the diffuse emission in the outer regions of M82. For clarity the
positions have been labeled 1 to 16 from east to west. Positions 17 to 19
correspond to positions on the CO outflow (see Fig. 8).
The line ratios at the analyzed positions are summarized in Table 2.
Errors include 10% uncertainty of the flux calibrators, errors of the
amplitude calibration (typically about 10%) and statistical errors. Our
high-resolution line ratios for
![]() and ^13CO
and ^13CO
![]() differ slightly
from values derived from single dish observations by Mao et al. (2000).
But our data confirms that
differ slightly
from values derived from single dish observations by Mao et al. (2000).
But our data confirms that
![]() /
/
![]() ratios larger than 1.8
(e.g. Knapp et al. 1980; Olofsson & Rydbeck 1984; Loiseau
et al. 1990) can firmly be rejected.
ratios larger than 1.8
(e.g. Knapp et al. 1980; Olofsson & Rydbeck 1984; Loiseau
et al. 1990) can firmly be rejected.
![]() /
/
![]() and
and
![]() /
/
![]() line intensity ratios are about 10-20 and 40-60 respectively.
line intensity ratios are about 10-20 and 40-60 respectively.
|
|
|
|
|
|
|
|
|
MF
|
|
| [''] | [''] | [%] | |||||||
| 1 | 16.5 | 7.5 |
|
|
|
|
23.5 | ||
| 2 | 14.5 | 5.0 |
|
|
|
|
10.3 | ||
| 3 | 11.5 | 3.0 |
|
|
|
|
8.0 | ||
| 4 | 9.5 | 1.0 |
|
|
|
|
7.0 | ||
| 5 | 6.5 | 0.5 |
|
|
|
|
9.0 | ||
| 6 | 4.0 | 0.5 |
|
|
|
|
12.4 | ||
| 7 | 2.0 | -0.5 |
|
|
|
|
10.3 | ||
| 8 | -1.0 | -1.5 |
|
|
|
|
13.0 | ||
| 9 | -4.0 | -2.0 |
|
|
|
|
15.6 | ||
| 10 | -6.5 | -3.0 |
|
|
|
|
12.9 | ||
| 11 | -10.0 | -4.0 |
|
|
|
|
14.0 | ||
| 12 | -14.0 | -4.0 |
|
|
|
|
4.3 | ||
| 13 | -17.5 | -4.0 |
|
|
|
|
6.6 | ||
| 14 | -20.5 | -4.5 |
|
|
|
|
4.1 | ||
| 15 | -23.5 | -4.5 |
|
|
|
|
5.6 | ||
| 16 | -26.5 | -4.0 |
|
|
|
|
6.2 | ||
| 17 | -2.5 | -5.5 |
|
|
|
|
19.0 | ||
| 18 | -3.5 | -9.0 |
|
|
|
|
27.4 | ||
| 19 | -8.5 | -7.0 |
|
|
|
|
10.8 |
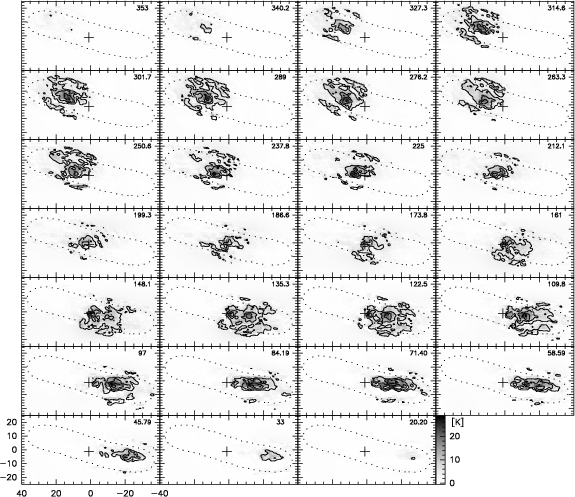 |
Figure 4:
|
| Open with DEXTER | |
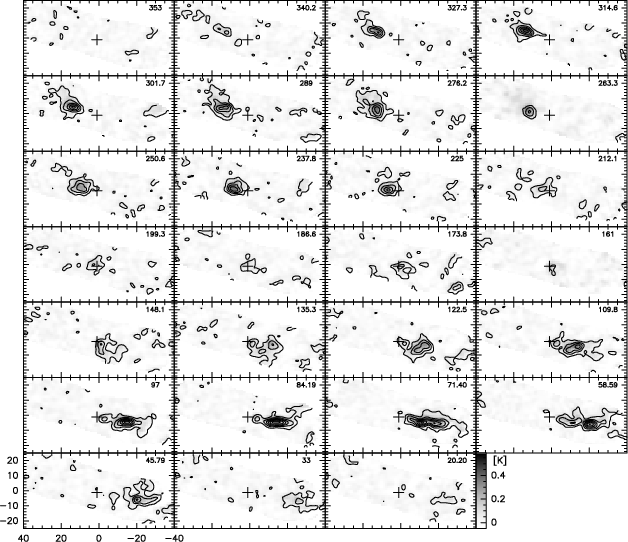 |
Figure 5:
|
| Open with DEXTER | |
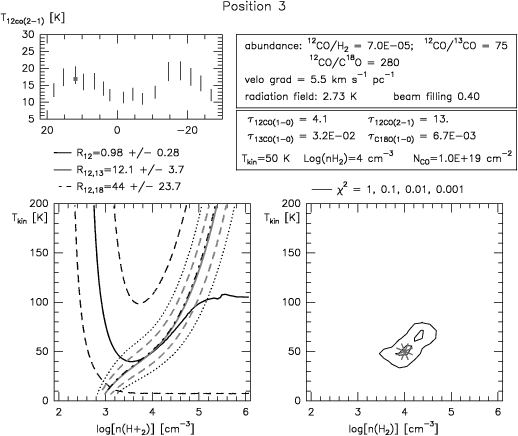 |
Figure 6:
"Best'' LVG solution at position 3 (the eastern CO lobe). The top left
diagram shows the observed
|
| Open with DEXTER | |
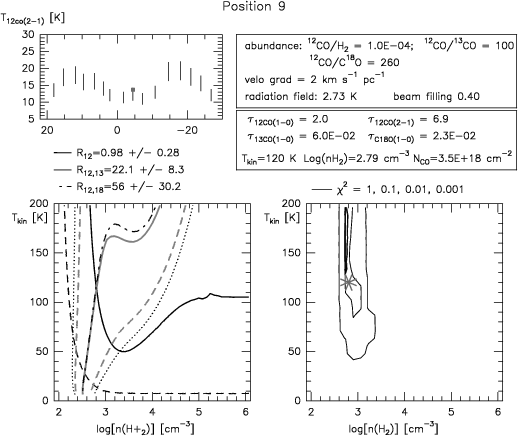 |
Figure 7: "Best'' LVG solution at position 9 (central MIR peak). The items and parameters are the same as in Fig. 6 |
| Open with DEXTER | |
The excitation conditions of the CO-emitting volume were modeled using a
spherical, isothermal one-component large velocity gradient (LVG) model
(Goldreich & Kwan 1974; de Jong et al. 1975). LVG line
intensities were calculated for a kinetic temperature and H2 density range
from 5K to 200K by 5K and
![]() from 1.8 to 5.0 by 0.2
respectively. In addition, we varied the CO abundance relative to H2, [CO],
per velocity gradient and the fractional
from 1.8 to 5.0 by 0.2
respectively. In addition, we varied the CO abundance relative to H2, [CO],
per velocity gradient and the fractional
![]() and
and
![]() abundances
([CO]/grad(V):
abundances
([CO]/grad(V):
![]() ;
[CO]/[
;
[CO]/[
![]() ]: 30 to 100 by 5; [CO]/[
]: 30 to 100 by 5; [CO]/[
![]() ]: 100 to 300 by 20).
For the comparison between the observed peak intensity ratios
(Table 2, Cols. 3, 5, 7) and the predicted LVG ratios we used a
]: 100 to 300 by 20).
For the comparison between the observed peak intensity ratios
(Table 2, Cols. 3, 5, 7) and the predicted LVG ratios we used a
![]() test. To account for the absolute intensities across the disk
of M82 we also fitted the
test. To account for the absolute intensities across the disk
of M82 we also fitted the
![]() intensity at each position by
varying the beam filling from 0.1 to 0.9 by 0.1. The "best'' solutions are
shown for positions 3 and 9 in Figs. 6 and 7.
Position 3 on the western CO lobe is an example for a solution with low
kinetic temperatures and high H2 densities; position 9 on the brightest
MIR peak is representative for solutions with high kinetic temperatures and
low H2 densities.
intensity at each position by
varying the beam filling from 0.1 to 0.9 by 0.1. The "best'' solutions are
shown for positions 3 and 9 in Figs. 6 and 7.
Position 3 on the western CO lobe is an example for a solution with low
kinetic temperatures and high H2 densities; position 9 on the brightest
MIR peak is representative for solutions with high kinetic temperatures and
low H2 densities.
The observed line ratios and
![]() intensities can be modeled
within the errors at all positions. The fit agrees very well with the data
at positions where
intensities can be modeled
within the errors at all positions. The fit agrees very well with the data
at positions where
![]() /
/
![]() is less than 1.2. At position 6 (eastern MIR peak)
we do not find any intersection for all observed line ratios in the H2
density and kinetic temperature plane. For a more detailed discussion see
Sect. 4.1. The best agreement with the observed line ratios and
absolute intensities is found for a beam filling of 0.4. Positions 6 and 7
at the eastern MIR peak (Telesco & Gezari 1992) and positions
18 and 19 at the CO outflow require a somewhat lower beam filling of 0.2 and
0.3 respectively.
is less than 1.2. At position 6 (eastern MIR peak)
we do not find any intersection for all observed line ratios in the H2
density and kinetic temperature plane. For a more detailed discussion see
Sect. 4.1. The best agreement with the observed line ratios and
absolute intensities is found for a beam filling of 0.4. Positions 6 and 7
at the eastern MIR peak (Telesco & Gezari 1992) and positions
18 and 19 at the CO outflow require a somewhat lower beam filling of 0.2 and
0.3 respectively.
The LVG parameters of the "best-fit'' across the major axis of M82 are shown
in Figs. 8a-d. The CO abundance relative to H2 per velocity
gradient ([CO]/grad(V)) varies between 1 10-5pc/kms-1 and
7 10-5pc/kms-1. Assuming
![]() ,
as suggested by comparing the linewidth with the linear extent of the region,
this corresponds to CO abundances in the range of
,
as suggested by comparing the linewidth with the linear extent of the region,
this corresponds to CO abundances in the range of
![]() -7 10-5. Similar values have been determined
in the Orion region (Blake et al. 1987) and were suggested by
chemical models (Farquhar et al. 1994). [CO]/grad(V)
increases towards the MIR peaks which indicates higher CO abundances at the
active star-forming regions than in the more quiescent outer regions.
The fractional
-7 10-5. Similar values have been determined
in the Orion region (Blake et al. 1987) and were suggested by
chemical models (Farquhar et al. 1994). [CO]/grad(V)
increases towards the MIR peaks which indicates higher CO abundances at the
active star-forming regions than in the more quiescent outer regions.
The fractional
![]() abundance [
abundance [
![]() ]/[
]/[
![]() ]
across M82 does not show
any significant spatial variation. The mean value of all positions is
]
across M82 does not show
any significant spatial variation. The mean value of all positions is
![]() .
A low fractional
.
A low fractional
![]() abundance is consistent with
recent radiative transfer calculations by Mao et al. (2000) and an
independent chain of arguments based on CN and 13CN measurements
(Henkel et al. 1998). In contrast, the fractional
abundance is consistent with
recent radiative transfer calculations by Mao et al. (2000) and an
independent chain of arguments based on CN and 13CN measurements
(Henkel et al. 1998). In contrast, the fractional
![]() abundance [
abundance [
![]() ]/[
]/[
![]() ]
shows a trend towards higher
]
shows a trend towards higher
![]() abundances at
the MIR peaks and in the outflow. While the average [
abundances at
the MIR peaks and in the outflow. While the average [
![]() ]/[
]/[
![]() ]
ratio in
the quiescent regions is about 270, it is only about 160 at position 6, 11,
17 and 19 (see Fig. 8d). Note that these values suggest
]
ratio in
the quiescent regions is about 270, it is only about 160 at position 6, 11,
17 and 19 (see Fig. 8d). Note that these values suggest
![]() abundances 2-3 times higher than those used by Wild et al. (1992)
for their LVG calculations of CO line ratios in M82.
abundances 2-3 times higher than those used by Wild et al. (1992)
for their LVG calculations of CO line ratios in M82.
The kinetic temperature is well correlated with the MIR emission and other
tracers of high-level star formation. Within the prominent CO lobes with
less signs of ongoing star formation, the kinetic temperature is about 50K.
Towards the active star-forming regions we find two kinetic temperature
peaks above 150K. These "hot-spots'' coincide with the location of MIR peaks
(for a comparison between the MIR emission and the CO distribution see
Telesco & Gezari 1992). Near the 2.2 m![]() m nucleus the LVG models
suggest temperatures of about 75K. Along the CO outflow the temperature
drops with increasing distance from the active regions. At position 17 and 19
we find temperatures above 100K. At position 18 (100pc distance from
the plane) the kinetic temperature has dropped to 60K. The spatial variation
of the kinetic temperature along the major axis of M82 is shown in
Fig. 8a. The corresponding diagram of the H2 density
distribution is shown in Fig. 8b. Solutions are found between
m nucleus the LVG models
suggest temperatures of about 75K. Along the CO outflow the temperature
drops with increasing distance from the active regions. At position 17 and 19
we find temperatures above 100K. At position 18 (100pc distance from
the plane) the kinetic temperature has dropped to 60K. The spatial variation
of the kinetic temperature along the major axis of M82 is shown in
Fig. 8a. The corresponding diagram of the H2 density
distribution is shown in Fig. 8b. Solutions are found between
![]() and
and
![]() .
In general, the H2 densities
are high in regions with low kinetic temperatures and vice versa. The solutions
for the outer CO lobes suggest an H2 density about
.
In general, the H2 densities
are high in regions with low kinetic temperatures and vice versa. The solutions
for the outer CO lobes suggest an H2 density about
![]() with a tendency towards somewhat lower values at the very edge of
the CO distribution (
with a tendency towards somewhat lower values at the very edge of
the CO distribution (
![]() ). These values
are in agreement with H2 densities calculated by Wild et al. (1992)
and Mao et al. (2000). At the "hot-spot'', low H2 densities of
). These values
are in agreement with H2 densities calculated by Wild et al. (1992)
and Mao et al. (2000). At the "hot-spot'', low H2 densities of
![]() are required to match the observed line
ratios. H2 densities in the CO outflow are about
are required to match the observed line
ratios. H2 densities in the CO outflow are about
![]() .
.
Both the
![]() and the
and the
![]() transitions are optically thick.
In the cold dense regions we find an optical depth of
transitions are optically thick.
In the cold dense regions we find an optical depth of
![]() and
and
![]() .
At the "hot-spots'' the derived optical depths are somewhat
lower and reach unity in the
.
At the "hot-spots'' the derived optical depths are somewhat
lower and reach unity in the
![]() transition at the eastern MIR peak
(position 6 & 7). For the ground transitions of the rare isotopes
transition at the eastern MIR peak
(position 6 & 7). For the ground transitions of the rare isotopes
![]() and
and
![]() we find optically thin emission at all positions. Typical
optical depths are
we find optically thin emission at all positions. Typical
optical depths are
![]() and
and
![]() .
.
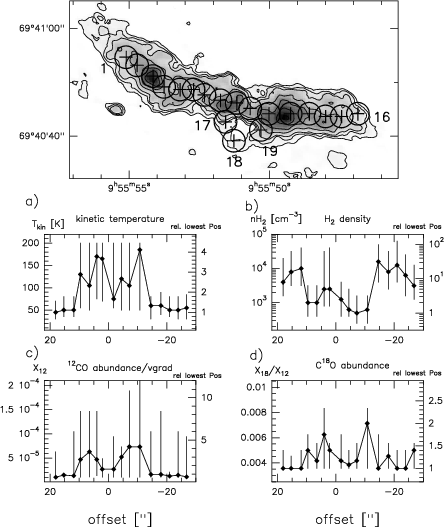 |
Figure 8:
LVG solutions for positions 1 to 16. Top: locations of the analyzed
positions. The radii of the circles indicate the spatial resolution for which
the line ratios have been determined. a) to d): spatial variations of the kinetic
temperature, the H2 density, the CO abundance per velocity gradient and the
fractional
|
| Open with DEXTER | |
For the determination of CO and H2 column densities at each position we
used three methods:
- LVG: The column densities were derived from the CO and H2 densities,
the velocity gradient and the observed line widths using
![]() and
and
![]() ,
where dV is the
observed line width. Therefore
,
where dV is the
observed line width. Therefore
![]() is an equivalent
path length through the clouds;
is an equivalent
path length through the clouds;
- LVG![]() (PF=partition function): the
(PF=partition function): the
![]() and
and
![]() column
densities were calculated from the general relation between optical depth,
excitation temperature and column density at rotation level J:
column
densities were calculated from the general relation between optical depth,
excitation temperature and column density at rotation level J:
![]() where gJ is the statistical weight of
level J and AJ+1,J is the Einstein coefficient for the
transition J+1 to J.
where gJ is the statistical weight of
level J and AJ+1,J is the Einstein coefficient for the
transition J+1 to J.
![]() was approximated by
was approximated by
![]() .
.
![]() and
and ![]() are given by the LVG code for each level.
are given by the LVG code for each level.
![]() and
and
![]() column densities
were determined using the sum of the 6 lowest levels for each isotope.
H2 and CO column densities were derived from the relative abundances
of the rare isotopes relative to H2 and CO;
column densities
were determined using the sum of the 6 lowest levels for each isotope.
H2 and CO column densities were derived from the relative abundances
of the rare isotopes relative to H2 and CO;
- LTE:
![]() and
and
![]() column densities were derived using a standard LTE
approach (e.g. Dickman 1978). As for the LVG
column densities were derived using a standard LTE
approach (e.g. Dickman 1978). As for the LVG![]() method, CO and
H2 column densities were derived from the abundances of the rare
isotopes relative to CO and H2 at each position.
method, CO and
H2 column densities were derived from the abundances of the rare
isotopes relative to CO and H2 at each position.
Column densities calculated from
![]() and
and
![]() via the LTE method match
each other with less than 5% difference at each position. The same holds
for the LVG
via the LTE method match
each other with less than 5% difference at each position. The same holds
for the LVG![]() column densities calculated from
column densities calculated from
![]() and
and ![]() of
the
of
the
![]() and
and
![]() transition. For simplicity we therefore give in the
following the average between the column densities calculated from
transition. For simplicity we therefore give in the
following the average between the column densities calculated from
![]() and
and
![]() via the LTE and LVG
via the LTE and LVG![]() method.
method.
The spatial variations of the beam-averaged H2 column density across the
major axis of M82 as calculated with the three methods is shown in
Fig. 9. The spatial distribution of the H2 column densities
is in good agreement for all three methods. This suggests that the low J levels
are almost thermalized. The largest difference between the methods is apparent at
the central CO peak. While the LTE solutions suggest
a local H2 column density maximum of about
![]() ,
the peak is less prominent (
,
the peak is less prominent (
![]() )
and displaced by 4'' in the LVG and LVG
)
and displaced by 4'' in the LVG and LVG![]() solution
(see Fig. 9).
solution
(see Fig. 9).
Nevertheless, all methods clearly show that most of the molecular
gas traced by CO is located in the outer CO lobes. The central 300 pc between
the molecular lobes contain only about 20-30% of the molecular gas mass.
Furthermore, the H2 column density distribution is clearly asymmetric with
respect to the 2.2 m![]() m nucleus. We find that the centroid of mass is located
about 100 pc south-east of the nucleus. The location of the centroid of
mass for each method is indicated by the vertical line in Fig. 9.
The highest H2 column density is found at the western CO lobe (position 12).
Its beam-averaged LVG column densities are
m nucleus. We find that the centroid of mass is located
about 100 pc south-east of the nucleus. The location of the centroid of
mass for each method is indicated by the vertical line in Fig. 9.
The highest H2 column density is found at the western CO lobe (position 12).
Its beam-averaged LVG column densities are
![]() and
and
![]() .
The corresponding cloud-averaged LVG column densities are
.
The corresponding cloud-averaged LVG column densities are
![]() and
and
![]() ,
respectively. The corresponding values for the eastern
CO lobe (position 3) are
,
respectively. The corresponding values for the eastern
CO lobe (position 3) are
![]() ,
,
![]() ,
,
![]() and
and
![]() .
For an assumed line-of-sight of 350pc (for comparison with
Mao et al. 2000) the mean molecular density in the CO lobes is
.
For an assumed line-of-sight of 350pc (for comparison with
Mao et al. 2000) the mean molecular density in the CO lobes is
![]() .
This corresponds to a volume filling
factor of
.
This corresponds to a volume filling
factor of
![]() .
With
.
With
![]() and a linear resolution of 65pc we obtain characteristic cloud sizes of
and a linear resolution of 65pc we obtain characteristic cloud sizes of
![]() .
Volume filling factors and characteristic cloud sizes do not change
significantly in the central star forming regions. These values are in
good agreement with PDR models published
by Wolfire et al. (1990).
.
Volume filling factors and characteristic cloud sizes do not change
significantly in the central star forming regions. These values are in
good agreement with PDR models published
by Wolfire et al. (1990).
H2 column densities in the molecular
outflow are in the range
![]() -
-
![]() .
The total mass of the outflow is
.
The total mass of the outflow is
![]() (D=3.9 Mpc,
Sakai & Madore 1999).
(D=3.9 Mpc,
Sakai & Madore 1999).
To derive the conversion factor from I(CO) to N(H2), we have compared LVG, LTE, and
LVG![]() H2 column densities with the integrated
H2 column densities with the integrated
![]() intensities at
4.2'' resolution at the analyzed positions across the central part of M82.
The variation of the conversion factor
intensities at
4.2'' resolution at the analyzed positions across the central part of M82.
The variation of the conversion factor
![]() with position
is shown in Fig. 10. Note that
with position
is shown in Fig. 10. Note that
![]() is lower than the Galactic value
of
is lower than the Galactic value
of
![]() (Hunter et al.
1997) at all positions and for all methods. We find that
(Hunter et al.
1997) at all positions and for all methods. We find that
![]() varies across the disk of M82 by about a factor of 5 if one considers the
LTE solutions (
varies across the disk of M82 by about a factor of 5 if one considers the
LTE solutions (
![]() -
-
![]() )
and by a factor of 8-9 for the LVG and LVG
)
and by a factor of 8-9 for the LVG and LVG![]() solutions
(
solutions
(
![]() -
-
![]() and
and
![]() -
-
![]() ). All methods show that the lowest conversion
factors are associated with the central star-forming regions where the
gas is heated by UV photons from the newly formed stars and cosmic-rays from SNRs.
The CO-emitting volumes at these positions have high kinetic temperatures.
Towards the outer molecular lobes with higher H2 densities and lower kinetic
temperatures, the conversion factor rises.
This is in agreement with simple
theoretical arguments that suggest that the conversion factor
). All methods show that the lowest conversion
factors are associated with the central star-forming regions where the
gas is heated by UV photons from the newly formed stars and cosmic-rays from SNRs.
The CO-emitting volumes at these positions have high kinetic temperatures.
Towards the outer molecular lobes with higher H2 densities and lower kinetic
temperatures, the conversion factor rises.
This is in agreement with simple
theoretical arguments that suggest that the conversion factor
![]() should
be proportional to
should
be proportional to
![]() for virialized
clouds (Maloney & Black 1988). The variation of
for virialized
clouds (Maloney & Black 1988). The variation of
![]() with
with
![]() is shown in Fig. 11.
The linear correlation between
is shown in Fig. 11.
The linear correlation between
![]() and
and
![]() for
for
![]() is
clearly visible. For
is
clearly visible. For
![]() the scatter
in the plot increases.
This is in particular true for
the scatter
in the plot increases.
This is in particular true for
![]() calculated under the
assumption of LTE. This suggests that the gas is not close to LTE at the
"hot spots''. The increased scatter of
calculated under the
assumption of LTE. This suggests that the gas is not close to LTE at the
"hot spots''. The increased scatter of
![]() calculated with the LVG and
LVG
calculated with the LVG and
LVG![]() method might suggest that either the clouds are not virialized
or that more appropriate models (like PDR models) are required to calculate
the physical gas properties in the center of the starburst. For a more
detailed discussion see Sect. 4.1. Nevertheless, this
result not only shows that the standard Galactic
method might suggest that either the clouds are not virialized
or that more appropriate models (like PDR models) are required to calculate
the physical gas properties in the center of the starburst. For a more
detailed discussion see Sect. 4.1. Nevertheless, this
result not only shows that the standard Galactic
![]() factor is not
appropriate for a starburst system like M82, but that
factor is not
appropriate for a starburst system like M82, but that
![]() is a
function of the intrinsic gas properties which strongly depend on
environmental effects. This implies that spatial variations of ^12CO(J=10)
is a
function of the intrinsic gas properties which strongly depend on
environmental effects. This implies that spatial variations of ^12CO(J=10)
![]() intensities can be due to variations of the excitation conditions of the gas
rather than variations of column density. Similar results have been obtained by
Wild et al. (1992) using low-resolution CO data (see also Sect. 4.3).
Based on the analysis of
intensities can be due to variations of the excitation conditions of the gas
rather than variations of column density. Similar results have been obtained by
Wild et al. (1992) using low-resolution CO data (see also Sect. 4.3).
Based on the analysis of
![]() we have calculated the "true''
H_2H2 distribution in M82 by interpolating the changes of
we have calculated the "true''
H_2H2 distribution in M82 by interpolating the changes of
![]() from the
analyzed positions across the central CO distribution. Multiplication of this
X_CO
from the
analyzed positions across the central CO distribution. Multiplication of this
X_CO
![]() -map with the integrated
-map with the integrated
![]() intensity distribution thus results in an
H2 column density map. We show these maps in Fig. 12 for
intensity distribution thus results in an
H2 column density map. We show these maps in Fig. 12 for
![]() derived from the LVG
derived from the LVG![]() (top) and LTE solutions (middle) in comparison with
the H2 distribution one would derive assuming a constant, standard Galactic
conversion (bottom) to illustrate the importance of detailed studies of
(top) and LTE solutions (middle) in comparison with
the H2 distribution one would derive assuming a constant, standard Galactic
conversion (bottom) to illustrate the importance of detailed studies of
![]() to derive H2 column density distributions. The H2 column density maps
in Fig. 12 (top and middle) indicate that the central star-forming
region is surrounded by a double-lobed distribution of molecular gas, while
H2 seems to be depleted in the central starburst region itself (see also Fig. 9).
to derive H2 column density distributions. The H2 column density maps
in Fig. 12 (top and middle) indicate that the central star-forming
region is surrounded by a double-lobed distribution of molecular gas, while
H2 seems to be depleted in the central starburst region itself (see also Fig. 9).
The total H2 mass of the region shown in Fig. 12 is
![]() for the LVG
for the LVG![]() and LVG and
and LVG and
![]() for the LTE solution
at a distance of D=3.9 Mpc
(Sakai & Madore 1999). The corresponding values at
D=3.25 Mpc (Tammann & Sandage 1968) are 1.6 and
for the LTE solution
at a distance of D=3.9 Mpc
(Sakai & Madore 1999). The corresponding values at
D=3.25 Mpc (Tammann & Sandage 1968) are 1.6 and
![]() ,
respectively. These values are in good agreement with estimates from 450 m
,
respectively. These values are in good agreement with estimates from 450 m![]() m dust
continuum measurements (Smith et al. 1991) and from C18O(2
m dust
continuum measurements (Smith et al. 1991) and from C18O(2![]() 1) intensities
(Wild et al. 1992). Therefore, the total molecular mass is 3 times lower
than the mass one would derive using the standard Galactic conversion factor of
1) intensities
(Wild et al. 1992). Therefore, the total molecular mass is 3 times lower
than the mass one would derive using the standard Galactic conversion factor of
![]() (
(
![]() D=3.25 Mpc;
D=3.25 Mpc;
![]() D=3.9 Mpc).
D=3.9 Mpc).
Analyses of the physical conditions of the molecular gas in M82 have been
published by Tilanus et al. (1991), Wild et al. (1992),
Güsten et al. (1993) and more recently by Mao et al. (2000)
and Petitpas & Wilson (2000) using single-dish CO data and other
tracers of the molecular gas. The kinetic gas temperature of the CO-emitting
gas phase derived in these studies are
of order
![]() .
H2 densities range between
.
H2 densities range between
![]() .
Thus our solutions at the CO lobes
and the outer parts of the CO distribution (
.
Thus our solutions at the CO lobes
and the outer parts of the CO distribution (
![]() )
are consistent with previous studies.
)
are consistent with previous studies.
| |
Figure 9:
Beam averaged H2column densities across the major axis of M82.
Offsets are given relative to the center of M82 (2.2 m |
| Open with DEXTER | |
The situation is different for our LVG solutions within the starburst region.
Kinetic gas temperatures above
![]() are clearly inconsistent with
results published in literature so far. In the most recent analysis of the
excitation conditions of the molecular gas using mm and sub-mm CO emission
lines (up to J=7-6), Mao et al. (2000) suggested kinetic gas temperatures
as high as 130K. However, they rejected their LVG solution because of intrinsic
inconsistencies regarding almost equal area and volume filling factors derived from
the one-component LVG model. This leads to characteristic cloud sizes of
about 150pc which is inconsistent with high-resolution studies of the CO
distribution in M82 (Shen & Lo 1995; Neininger et al. 1998 and
this work). Characteristic cloud sizes derived from our analysis are only
are clearly inconsistent with
results published in literature so far. In the most recent analysis of the
excitation conditions of the molecular gas using mm and sub-mm CO emission
lines (up to J=7-6), Mao et al. (2000) suggested kinetic gas temperatures
as high as 130K. However, they rejected their LVG solution because of intrinsic
inconsistencies regarding almost equal area and volume filling factors derived from
the one-component LVG model. This leads to characteristic cloud sizes of
about 150pc which is inconsistent with high-resolution studies of the CO
distribution in M82 (Shen & Lo 1995; Neininger et al. 1998 and
this work). Characteristic cloud sizes derived from our analysis are only
![]()
![]() ,
hence more realistic.
This difference results
mainly from a very low area filling factor of only
,
hence more realistic.
This difference results
mainly from a very low area filling factor of only
![]() found
by Mao et al. (2000). From the CO morphology
(see Fig. 1) and
found
by Mao et al. (2000). From the CO morphology
(see Fig. 1) and
![]() we would expect area filling factors of
we would expect area filling factors of
![]() at 22'' resolution. The reason for this discrepancy remains unclear.
But obviously the assumption of an isothermal gas phase used in the LVG model
is more reasonable for our high spatial resolution study than for the
low-resolution data used by Mao et al. (2000). Even though our
LVG analysis does not
lead to internal inconsistencies we also find that the observed line ratios
are difficult to reproduce with the one-component LVG model at the "hot spots''.
This is in particular true for positions 6, 7 and 11 (eastern MIR peak and
expanding superbubble) where no intersection of all observed line ratios
(disregarding the errors of the observations) exists within the
calculated parameter space. At these positions more sophisticated radiative
transfer models like PDR models probably lead to more consistent results. However,
a comparison between LVG and PDR models in M82 shows that constraints on
H2 densities and beam-averaged column densities are very similar for both
methods (Mao et al. 2000). Güsten et al. (1993) and
Mao et al. (2000) concluded
that in order to explain the observed line ratios, a two-component model of
the molecular gas in M82 is needed.
But while models of Güsten et al. (1993) favor the existence of a warm, dense
(
at 22'' resolution. The reason for this discrepancy remains unclear.
But obviously the assumption of an isothermal gas phase used in the LVG model
is more reasonable for our high spatial resolution study than for the
low-resolution data used by Mao et al. (2000). Even though our
LVG analysis does not
lead to internal inconsistencies we also find that the observed line ratios
are difficult to reproduce with the one-component LVG model at the "hot spots''.
This is in particular true for positions 6, 7 and 11 (eastern MIR peak and
expanding superbubble) where no intersection of all observed line ratios
(disregarding the errors of the observations) exists within the
calculated parameter space. At these positions more sophisticated radiative
transfer models like PDR models probably lead to more consistent results. However,
a comparison between LVG and PDR models in M82 shows that constraints on
H2 densities and beam-averaged column densities are very similar for both
methods (Mao et al. 2000). Güsten et al. (1993) and
Mao et al. (2000) concluded
that in order to explain the observed line ratios, a two-component model of
the molecular gas in M82 is needed.
But while models of Güsten et al. (1993) favor the existence of a warm, dense
(
![]() -70 K;
-70 K;
![]() )
and a cold, diffuse
(
)
and a cold, diffuse
(
![]() -30 K;
-30 K;
![]() )
gas component, Mao et al. (2000)
find that the bulk of CO emission arises from a warm, diffuse component.
Our high-resolution LVG results
confirm the PDR calculations of Mao et al. (2000).
In particular, their conclusion that the bulk of CO emission in the core of
M82 arises from a warm, low-density interclump medium is consistent with our
findings.
)
gas component, Mao et al. (2000)
find that the bulk of CO emission arises from a warm, diffuse component.
Our high-resolution LVG results
confirm the PDR calculations of Mao et al. (2000).
In particular, their conclusion that the bulk of CO emission in the core of
M82 arises from a warm, low-density interclump medium is consistent with our
findings.
| |
Figure 10:
Variation of
|
| Open with DEXTER | |
| |
Figure 11:
|
| Open with DEXTER | |
Further support for a highly excited CO component towards the active regions
in M82 comes from the morphology of the high-J CO lines observed by
Mao et al. (2000). They find that the spatial separation of the CO
lobes decreases with increasing J. While the spatial separation of the outer
CO lobes in the
![]() and
and
![]() transition is about 26'', it decreases
to only 15'' in the
transition is about 26'', it decreases
to only 15'' in the
![]() transition. This distance
is in good agreement with the spatial separation of the kinetic temperature peaks
that we find in our LVG solutions (Fig. 8a).
transition. This distance
is in good agreement with the spatial separation of the kinetic temperature peaks
that we find in our LVG solutions (Fig. 8a).
To further test the reliability of the modeled kinetic temperature and H2
density distribution across M82 we calculated line ratios for the high-J
transitions of
![]() and
and
![]() at 22'' resolution and compared our prediction
with the line ratios published by Mao et al. (2000). Note that the spatial
smoothing of our high-resolution one-component excitation model leads to a
multi-component model at lower resolution because it encompasses the individual
solutions (weighted with a Gaussian of 22'' width) at all positions.
The predicted line ratios from a single CO isotope match the observations
extremely well. For different CO isotopes the predicted line ratios are lower
than suggested by the observations, but consistent within the observational errors.
The predicted and observed line ratios are summarized in Table 3.
at 22'' resolution and compared our prediction
with the line ratios published by Mao et al. (2000). Note that the spatial
smoothing of our high-resolution one-component excitation model leads to a
multi-component model at lower resolution because it encompasses the individual
solutions (weighted with a Gaussian of 22'' width) at all positions.
The predicted line ratios from a single CO isotope match the observations
extremely well. For different CO isotopes the predicted line ratios are lower
than suggested by the observations, but consistent within the observational errors.
The predicted and observed line ratios are summarized in Table 3.
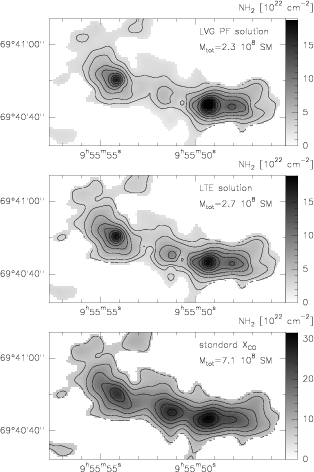 |
Figure 12:
H2 column density maps calculated from the integrated
|
| Open with DEXTER | |
An independent chain of arguments favoring a temperature gradient towards the central
starburst region comes from the different separation of the eastern and western
"hot spots'' in MIR and FIR observations. Hughes et al. (1994) stated
that the larger separation of the peaks at 450 m![]() m reflects the radial
temperature gradient that must exist within the torus if the dust is heated
by the central starburst population.
m reflects the radial
temperature gradient that must exist within the torus if the dust is heated
by the central starburst population.
| CO line ratio | east | center | west | |
| 12CO(7 |
0.36 | 0.25 | 0.31 | model |
| 0.32 | 0.29 | 0.37 | peak | |
| 0.28 | 0.36 | 0.33 | integral | |
| 12CO(4 |
7.07 | 8.02 | 5.81 | model |
| 8.50 | 10.1 | 9.07 | peak | |
| 9.09 | 6.88 | 7.40 | integral | |
| 13CO(2 |
1.92 | 1.67 | 1.87 | model |
| 1.53 | 1.63 | 1.93 | peak | |
| 1.47 | 1.44 | 1.17 | integral | |
| 12CO(2 |
7.82 | 9.27 | 7.48 | model |
| 9.04 | 13.7 | 9.19 | peak | |
| 11.4 | 14.2 | 11.7 | integral |
The suitability of a global Galactic factor
![]() to convert
to convert
![]() intensities
to H2 column densities has been discussed by many authors (e.g. Young &
Scoville 1982; Bloemen et al. 1986; Hunter et al.
1997). As seen, theoretical studies of
intensities
to H2 column densities has been discussed by many authors (e.g. Young &
Scoville 1982; Bloemen et al. 1986; Hunter et al.
1997). As seen, theoretical studies of
![]() showed that it is
sensitive to the kinetic temperature of the emitting gas and that the
conversion factor should be lower for starburst galaxies like M82 than for the
Milky Way (Maloney & Black 1988). Investigations of
showed that it is
sensitive to the kinetic temperature of the emitting gas and that the
conversion factor should be lower for starburst galaxies like M82 than for the
Milky Way (Maloney & Black 1988). Investigations of
![]() in M82
confirmed this prediction: Wild et al. (1992) used the optically thin
C18O(2
in M82
confirmed this prediction: Wild et al. (1992) used the optically thin
C18O(2![]() 1) transition to derive H2 column densities and hence
1) transition to derive H2 column densities and hence
![]() along the major axis of M82. They found
along the major axis of M82. They found
![]() and variations by a factor of 2 along the major
axis. Similar results were obtained by Smith et al. (1991) using
the 450 m
and variations by a factor of 2 along the major
axis. Similar results were obtained by Smith et al. (1991) using
the 450 m![]() m continuum emission from dust grains to derive H2column densities.
Even though both studies suggest a low conversion factor, its variation across
the major axis shows significant differences. While Smith et al. (1991)
found that
m continuum emission from dust grains to derive H2column densities.
Even though both studies suggest a low conversion factor, its variation across
the major axis shows significant differences. While Smith et al. (1991)
found that
![]() decreases from east to west, with no changes in the central star-forming
regions, the results by Wild et al. (1992) suggest very
low conversion factors near the
eastern MIR peak and an increasing
decreases from east to west, with no changes in the central star-forming
regions, the results by Wild et al. (1992) suggest very
low conversion factors near the
eastern MIR peak and an increasing
![]() towards the western molecular lobe.
Therefore our variations of
towards the western molecular lobe.
Therefore our variations of
![]() in general support the results by Wild
et al. (1992). Nevertheless our conversion factors are slightly
lower than those inferred by Wild et al. (1992), and the location of
the western
in general support the results by Wild
et al. (1992). Nevertheless our conversion factors are slightly
lower than those inferred by Wild et al. (1992), and the location of
the western
![]() maximum
is displaced by
maximum
is displaced by ![]() 7''. The discrepancies between the
7''. The discrepancies between the
![]() factors
derived from the molecular lines (Wild et al. 1992 and this work) and the
estimates from the
dust emission might result from the single-temperature model used by
Smith et al. (1991). In particular in the central region, which shows
strong MIR emission from heated dust (Telesco & Gezari 1992), this might
lead to an overestimate of the H2 column density and thus to an overestimate
of
factors
derived from the molecular lines (Wild et al. 1992 and this work) and the
estimates from the
dust emission might result from the single-temperature model used by
Smith et al. (1991). In particular in the central region, which shows
strong MIR emission from heated dust (Telesco & Gezari 1992), this might
lead to an overestimate of the H2 column density and thus to an overestimate
of
![]() .
Furthermore,
the different morphology of the 450 m
.
Furthermore,
the different morphology of the 450 m![]() m map published by Hughes et al.
(1994) raises doubts on the reliability of the 450 m
m map published by Hughes et al.
(1994) raises doubts on the reliability of the 450 m![]() m intensities
used by Smith et al. (1991) for their calculation. From this we
conclude that the
m intensities
used by Smith et al. (1991) for their calculation. From this we
conclude that the
![]() factor in M82 is not only lower than the standard Galactic conversion factor,
but that in addition
factor in M82 is not only lower than the standard Galactic conversion factor,
but that in addition
![]() in the central 300pc is at least 3 times lower than
in the molecular lobes. A similar gradient for the conversion factor has been
found in the Milky Way towards the Galactic Center (e.g. Blitz et al. 1985;
Sodroski et al. 1994; Dahmen et al. 1998). Furthermore, our
analysis suggests that the variations of
in the central 300pc is at least 3 times lower than
in the molecular lobes. A similar gradient for the conversion factor has been
found in the Milky Way towards the Galactic Center (e.g. Blitz et al. 1985;
Sodroski et al. 1994; Dahmen et al. 1998). Furthermore, our
analysis suggests that the variations of
![]() are mainly caused by variations
of the kinetic temperature of the CO-emitting volume due to environmental effects
while abundance variations play a minor role.
are mainly caused by variations
of the kinetic temperature of the CO-emitting volume due to environmental effects
while abundance variations play a minor role.
We have observed the
![]() and
and
![]() emission lines in the starburst galaxy
M82 with high spatial resolution using the Plateau de Bure interferometer. Our
main conclusions are:
emission lines in the starburst galaxy
M82 with high spatial resolution using the Plateau de Bure interferometer. Our
main conclusions are:
1) The overall morphology and kinematics for both transitions are similar to those of
![]() and ^13CO(J=10)
and ^13CO(J=10)
![]() published by Shen & Lo (1995) and Neininger et al.
(1998). The dynamical center of the molecular gas coincides with the
2.2 m
published by Shen & Lo (1995) and Neininger et al.
(1998). The dynamical center of the molecular gas coincides with the
2.2 m![]() m nucleus while the centroid of the molecular mass is located 100pc
west of M82's center. South of the expanding molecular superbubble (Weiß
et al. 1999) an outflow of molecular gas with a total mass of
m nucleus while the centroid of the molecular mass is located 100pc
west of M82's center. South of the expanding molecular superbubble (Weiß
et al. 1999) an outflow of molecular gas with a total mass of
![]() is detected;
is detected;
2) The
![]() /
/
![]() line intensity ratios are lower (
line intensity ratios are lower (![]() )
than previously
reported. Thus, CO line ratios in M82 are not outstanding, but comparable
to values found in other starburst galaxies like NGC253. Line ratios vary
across the disk of M82. Near the MIR peaks, the
)
than previously
reported. Thus, CO line ratios in M82 are not outstanding, but comparable
to values found in other starburst galaxies like NGC253. Line ratios vary
across the disk of M82. Near the MIR peaks, the
![]() /
/
![]() ratios are high;
in the outer parts, that are less affected by the starburst, this ratio drops to
unity;
ratios are high;
in the outer parts, that are less affected by the starburst, this ratio drops to
unity;
3) An LVG excitation analysis of the CO lines suggests that the excitation
conditions of the molecular gas are strongly influenced by environmental
effects. In the outer parts of the CO distribution we find H2 densities of
![]() and kinetic temperatures of
and kinetic temperatures of
![]() .
Towards the star-forming regions, indicated by
strong MIR emission, the kinetic temperatures raise above 150 K. The hot gas
is associated with low H2 densities of only
.
Towards the star-forming regions, indicated by
strong MIR emission, the kinetic temperatures raise above 150 K. The hot gas
is associated with low H2 densities of only
![]() .
Area filling factors of
.
Area filling factors of
![]() and volume filling
factors of
and volume filling
factors of
![]() indicate that the gas is organized in small
clumps with a typical size of
indicate that the gas is organized in small
clumps with a typical size of
![]() .
[
.
[
![]() ]/[^13CO
]/[^13CO
![]() ]
abundance ratios are about 70 without significant spatial variations across
the galaxy. In contrast, [
]
abundance ratios are about 70 without significant spatial variations across
the galaxy. In contrast, [
![]() ]/[
]/[
![]() ]
abundance ratios in the outer parts of
M82 are comparable to those found at the Galactic Center ([
]
abundance ratios in the outer parts of
M82 are comparable to those found at the Galactic Center ([
![]() ]/[
]/[
![]() ]
= 270)
but decrease to only [
]
= 270)
but decrease to only [
![]() ]/[
]/[
![]() ]
= 160 at the star-forming regions.
Beam-averaged H2 column densities range from
]
= 160 at the star-forming regions.
Beam-averaged H2 column densities range from
![]() near the MIR peaks to
near the MIR peaks to
![]() at the western CO lobe. The H2
distribution has a double-peak morphology which surrounds the central
starburst region. The central 300pc are depleted in H2. Thus the H2
distribution differs from the CO distribution. This result even holds when
the H2 column densities are calculated under the assumption of LTE conditions.
The total molecular mass is
at the western CO lobe. The H2
distribution has a double-peak morphology which surrounds the central
starburst region. The central 300pc are depleted in H2. Thus the H2
distribution differs from the CO distribution. This result even holds when
the H2 column densities are calculated under the assumption of LTE conditions.
The total molecular mass is
![]() ;
;
4) The conversion factor from I(CO) to N(H2) (
![]() )
depends on
the excitation conditions of the CO-emitting volume. Even in regions which are
less affected by the starburst
)
depends on
the excitation conditions of the CO-emitting volume. Even in regions which are
less affected by the starburst
![]() is about 3 times lower than the standard
Galactic value. From the LVG analysis we find that
is about 3 times lower than the standard
Galactic value. From the LVG analysis we find that
![]() .
Therefore
.
Therefore
![]() is lower in
the central star-forming regions than in the outer molecular lobes.
is lower in
the central star-forming regions than in the outer molecular lobes.
The basic idea behind our method is that the missing flux problem only arises
from an incorrect interpolation of the
visibilities in the central part of the
uv-plane (
![]() ). Therefore the missing
flux problem in a finally reduced interferometer map can be solved by replacing
the questionable part of the uv-plane by the values calculated from a
single-dish map with identical extent, grid and flux units. This procedure
avoids additional CLEANing on the combined data set and the choice of different
weightings between interferometer and single-dish data. The requirement for the
single-dish data is the same as described by Vogel et al. (1984). For
the combination we regridded the single-dish data cube to the same spatial and
velocity grid as the interferometer data. We then converted the flux units
from
). Therefore the missing
flux problem in a finally reduced interferometer map can be solved by replacing
the questionable part of the uv-plane by the values calculated from a
single-dish map with identical extent, grid and flux units. This procedure
avoids additional CLEANing on the combined data set and the choice of different
weightings between interferometer and single-dish data. The requirement for the
single-dish data is the same as described by Vogel et al. (1984). For
the combination we regridded the single-dish data cube to the same spatial and
velocity grid as the interferometer data. We then converted the flux units
from
![]() to Jy/pixel using the Rayleigh-Jeans approximation,
to Jy/pixel using the Rayleigh-Jeans approximation,
![]() and
and
![]() where
where ![]() is the
FWHM of the 30m telescope beam in units of the pixel size. The flux units of
the CLEANed and primary beam corrected interferometer cube were also converted
to Jy/pixel with
is the
FWHM of the 30m telescope beam in units of the pixel size. The flux units of
the CLEANed and primary beam corrected interferometer cube were also converted
to Jy/pixel with
![]() ,
where
,
where
![]() and
and
![]() are the FWHM of the major and minor axis of the clean beam in
units of the pixel size. Furthermore we generated a model for the 30m telescope
main beam and the interferometer clean beam. The 30m beam was assumed to be represented
by a circular Gaussian with FWHM =
are the FWHM of the major and minor axis of the clean beam in
units of the pixel size. Furthermore we generated a model for the 30m telescope
main beam and the interferometer clean beam. The 30m beam was assumed to be represented
by a circular Gaussian with FWHM = ![]() .
The interferometric beam was described as
a Gaussian with major and minor axis
.
The interferometric beam was described as
a Gaussian with major and minor axis
![]() and
and
![]() .
The normalization of both Gaussians was such that the amplitude of the
visibility at the origin of the uv-plane was 1. We then transformed both
data cubes and the model beams to the uv-domain using an FFT algorithm.
The real and imaginary parts of the single-dish data were divided by the amplitudes
of the model 30m beam to deconvolve the single-dish visibilities from the 30m
telescope beam. In order to match the interferometer data the result was then
multiplied by the amplitudes of the clean beam. At this stage of the combination the real and
imaginary parts in the single-dish and interferometer data are comparable and the
central interferometer pixels can be replaced by the single-dish values. The
part of the uv-domain to be replaced by the single-dish values in
general depends on the spacing of the shortest baseline and on the effective
diameter of the single-dish telescope. For data sets with no overlap in the
uv-domain we replaced the part that corresponds to the effective diameter
of the 30m telescope (amplitude of the visibilities for the 30m beam
model > 0.5). Otherwise we selected the part smaller than the shortest
interferometer baseline. Finally the combined real and imaginary parts were
transformed back to the image domain and the flux units were converted to Kelvin
considering that the combined beam is equal to the clean beam.
.
The normalization of both Gaussians was such that the amplitude of the
visibility at the origin of the uv-plane was 1. We then transformed both
data cubes and the model beams to the uv-domain using an FFT algorithm.
The real and imaginary parts of the single-dish data were divided by the amplitudes
of the model 30m beam to deconvolve the single-dish visibilities from the 30m
telescope beam. In order to match the interferometer data the result was then
multiplied by the amplitudes of the clean beam. At this stage of the combination the real and
imaginary parts in the single-dish and interferometer data are comparable and the
central interferometer pixels can be replaced by the single-dish values. The
part of the uv-domain to be replaced by the single-dish values in
general depends on the spacing of the shortest baseline and on the effective
diameter of the single-dish telescope. For data sets with no overlap in the
uv-domain we replaced the part that corresponds to the effective diameter
of the 30m telescope (amplitude of the visibilities for the 30m beam
model > 0.5). Otherwise we selected the part smaller than the shortest
interferometer baseline. Finally the combined real and imaginary parts were
transformed back to the image domain and the flux units were converted to Kelvin
considering that the combined beam is equal to the clean beam.
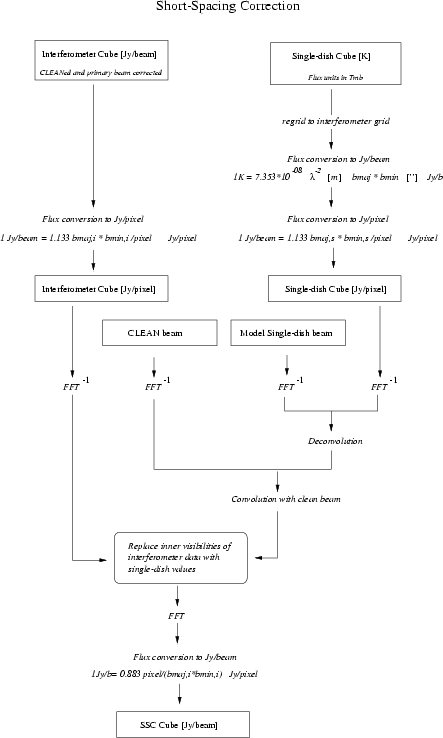 |
Figure 13: Flow chart of the short-spacing correction |
| Open with DEXTER | |
Note that there are no free parameters in the combination of the data sets except for the choice which part of the uv-plane is replaced by the single-dish data. The methods require the knowledge of the single-dish beam pattern and the clean beam only. A flow chart for the Short-Spacing correction is given in Fig. 13.
Acknowledgements
We with to thank the IRAM staff for carrying out the observations and the help provided during the data reduction. We thank J. Shen and K. Y. Lo for making available their CO data and C. Henkel and A. Heithausen for many fruitful discussions. This research has been supported by the Deutsche Forschungsgemeinschaft (DFG) though grant III GK-GRK 118/2.