In a companion paper, Maiolino et al. (#!maiolino5!#) presented various observational evidences for "anomalous'' dust properties in the circumnuclear region of AGNs and, in particular, the reduced
A&A 365, 37-48 (2001)
DOI: 10.1051/0004-6361:20000012
R. Maiolino - A. Marconi - E. Oliva
Send offprint request: R. Maiolino,
Osservatorio Astrofisico di Arcetri L.go E. Fermi 5, 50125 Firenze, Italy
Received 17 July 2000 / Accepted 28 September 2000
Abstract
In a companion paper, Maiolino et al. (#!maiolino5!#) presented various
observational evidences for
"anomalous'' dust properties in the circumnuclear region of AGNs and, in
particular, the reduced
![]() and
and
![]() ratios, the
absence of the silicate absorption feature in mid-IR spectra of Sy2s and
the absence of the carbon dip in UV spectra of reddened Sy1s.
In this paper we discuss various explanations for these facts.
The observational constraints favor a scenario where coagulation, catalyzed by
the high densities in the circumnuclear region, yields to
the formation of large grains.
The resulting extinction curve is featureless, flatter than Galactic and the
ratios, the
absence of the silicate absorption feature in mid-IR spectra of Sy2s and
the absence of the carbon dip in UV spectra of reddened Sy1s.
In this paper we discuss various explanations for these facts.
The observational constraints favor a scenario where coagulation, catalyzed by
the high densities in the circumnuclear region, yields to
the formation of large grains.
The resulting extinction curve is featureless, flatter than Galactic and the
![]() and
and
![]() ratios are significantly reduced.
These results should warn about an inappropriate
use of the standard Galactic extinction curve and
ratios are significantly reduced.
These results should warn about an inappropriate
use of the standard Galactic extinction curve and
![]() ratio
when dealing with the extreme gas conditions typical of the circumnuclear
clouds of AGNs.
We also investigated alternative scenarios for the observed
anomalous properties of dust in AGNs. Some of these scenarios
might explain some of the observed properties for a few objects,
but they generally fail to account for all of the observational
constraints obtained for the large sample of AGNs studied in these works.
ratio
when dealing with the extreme gas conditions typical of the circumnuclear
clouds of AGNs.
We also investigated alternative scenarios for the observed
anomalous properties of dust in AGNs. Some of these scenarios
might explain some of the observed properties for a few objects,
but they generally fail to account for all of the observational
constraints obtained for the large sample of AGNs studied in these works.
Key words: galaxies: Seyfert - galaxies: nuclei - galaxies: ISM - dust, extinction
Author for correspondance: maiolino@arcetri.astro.it
Some authors in the past have found evidences for anomalous properties of the
dust in the circumnuclear region of AGNs. In particular, dust absorption
and reddening appear to be systematically lower than expected from the
gaseous column density, for a Galactic gas-to-dust ratio and extinction curve
(e.g. Maccacaro et al. 1982; Reichert et al. 1985;
Granato et al. 1997).
In a companion paper (Maiolino et al. 2001,
Paper I) we have strengthened these
previous results and provided
additional evidences that the dust in the circumnuclear region of AGNs
is characterized by anomalous properties.
By comparing the reddening toward the Broad Line Region (BLR) and the gaseous
![]() inferred from the X-rays in a sample of 19 AGNs
we found that, with the exception of three Low
Luminosity AGNs,
the
inferred from the X-rays in a sample of 19 AGNs
we found that, with the exception of three Low
Luminosity AGNs,
the
![]() ratio is lower than the Galactic standard value by a
factor ranging from
ratio is lower than the Galactic standard value by a
factor ranging from ![]() 3 to
3 to ![]() 100. By comparing the optical and
X-ray properties of various AGN classes (type 1.8-1.9 Sys, hard X-ray
selected and radio selected QSOs, Broad Absorption Line QSOs and grism-selected
QSOs) it was inferred that the
100. By comparing the optical and
X-ray properties of various AGN classes (type 1.8-1.9 Sys, hard X-ray
selected and radio selected QSOs, Broad Absorption Line QSOs and grism-selected
QSOs) it was inferred that the
![]() ratio must be one or two orders of
magnitude lower than Galactic.
Despite the large mid-IR continuum absorption inferred from the PAHs
equivalent width, the absence of a significant silicate absorption
feature at 9.7
ratio must be one or two orders of
magnitude lower than Galactic.
Despite the large mid-IR continuum absorption inferred from the PAHs
equivalent width, the absence of a significant silicate absorption
feature at 9.7 ![]() m in the average ISO spectrum of Sy2s indicates
that dust grains in the circumnuclear region
of AGNs have different properties with respect to the Galactic diffuse
interstellar medium.
Finally, the lack of the 2175 Å carbon dip in the UV spectra of some type 1
AGNs, which appear affected by dust reddening, suggests a depletion of
small grains in the absorbing medium, as mentioned in Paper I.
These findings
suggest that the dust grain distribution is biased in favor of large grains.
The presence of large grains in the circumnuclear region of AGNs was also
suggested by Laor & Draine (1993) to explain some of the infrared properties
of AGNs.
m in the average ISO spectrum of Sy2s indicates
that dust grains in the circumnuclear region
of AGNs have different properties with respect to the Galactic diffuse
interstellar medium.
Finally, the lack of the 2175 Å carbon dip in the UV spectra of some type 1
AGNs, which appear affected by dust reddening, suggests a depletion of
small grains in the absorbing medium, as mentioned in Paper I.
These findings
suggest that the dust grain distribution is biased in favor of large grains.
The presence of large grains in the circumnuclear region of AGNs was also
suggested by Laor & Draine (1993) to explain some of the infrared properties
of AGNs.
In this paper
we examine some possible explanations of the observational findings
presented in Paper I. In particular,
we compare our models with the quantitative
constraints given on the
![]() ratio, the equivalent width of the
silicate feature and the depth of the 2175 Å carbon dip.
Note that we often distinguish the
ratio, the equivalent width of the
silicate feature and the depth of the 2175 Å carbon dip.
Note that we often distinguish the
![]() and
and
![]() ratios since, when discussing extinction curves different
from Galactic, reddening and absorption are no longer tied by the
standard Galactic
relation
AV/EB-V=3.1. In other words, models which could account
for a decreasing of
ratios since, when discussing extinction curves different
from Galactic, reddening and absorption are no longer tied by the
standard Galactic
relation
AV/EB-V=3.1. In other words, models which could account
for a decreasing of
![]() do not necessarily lower the
do not necessarily lower the
![]() ratio, and vice versa.
ratio, and vice versa.
In Sect. 2 we first analyze and, in practice, dismiss scenarios with a standard (Galactic) grain size distribution. The case for large grains is analyzed and discussed in Sect. 3 while in Sect. 4 we draw our conclusions.
Various studies have found evidence for super-solar metallicities in the nuclear region of AGNs (Ferland et al. 1996; Hamann & Ferland 1993, 1999; Fosbury et al. 1999; Reynolds et al. 1995; Dietrich & Wilhelm-Erkens 2000).
The gaseous column densities used in Paper I were inferred from the
photoelectric cutoff observed in the X-rays, but actually such
a cutoff gives
a measure of the column of metals ![]() (Morrison & McCammon
1983), which is then converted into
hydrogen column
(Morrison & McCammon
1983), which is then converted into
hydrogen column ![]() by assuming solar abundances. If the metallicity is
higher than solar, then the
by assuming solar abundances. If the metallicity is
higher than solar, then the ![]() inferred from the X-rays would be
overestimated. On the other hand, a large fraction of refractory elements
is locked into grains. As a
consequence, an increased metallicity would also imply a higher dust content.
Both the dust content and the
inferred from the X-rays would be
overestimated. On the other hand, a large fraction of refractory elements
is locked into grains. As a
consequence, an increased metallicity would also imply a higher dust content.
Both the dust content and the ![]() to
to ![]() conversion factor depend
linearly on the metallicity and, therefore, any change in metallicity should
not affect the
conversion factor depend
linearly on the metallicity and, therefore, any change in metallicity should
not affect the
![]() ratio in the way we measure it. Finally, we
should emphasize that there are no obvious astrophysical nucleosynthesis
processes that favor the formation of non-refractory elements over refractory
ones, implying that even "peculiar'' metallicities (in terms of relative
abundances between metals) should not affect the observed
ratio in the way we measure it. Finally, we
should emphasize that there are no obvious astrophysical nucleosynthesis
processes that favor the formation of non-refractory elements over refractory
ones, implying that even "peculiar'' metallicities (in terms of relative
abundances between metals) should not affect the observed
![]() ratio.
ratio.
Also, metallicity effects cannot explain the discrepancy between the lack of silicate feature and the strong mid-IR absorption in Sy2s. In the Small Magellanic Cloud the lack of the 2175 Å carbon dip is ascribed to a low metallicity, but this is unlikely to be the explanation for AGNs since, as discussed above, generally the latter are characterized by super-solar metallicities.
Although metallicity effects cannot explain the anomalous properties of dust in AGNs, it can have important consequences on the expected emission line fluxes in the case of ionized gas containing dust. This is an issue which will be discussed further in Sects. 2.6 and 3.
| Name | Comm.a | Refs. | |||
| M 81 | 0.36 | 1 | |||
| NGC 1365 | 1.19 | 0.91 | 0.11 | 4 | |
| MCG-5-23-16 | 0.42 | <0.8 | 0.7 | 4 | |
| NGC 5506 | 3.10 | 2.35 | 2.44 | transm. | 2,5 |
| NGC 2992 | 2.62(15.9) | 3.1 | 1.18 | transm. | 3,4,6 |
| Mkn6 | 0.5 | 5 | |||
| 3C 445 | 2.1 | 0.75 |
|
4,7 | |
| PG 2251+113 | 1.0 | 8 | |||
| IRAS 1319-16 | 1.1(7.4) |
|
2,3 | ||
| NGC 526a | 0.26 | 5 | |||
| Mkn 231 | 7.3 | 4.2 | 0.6 | transm. | 2,9 |
Also, the scattering efficiency generally does not exceed a few percent. As
a consequence, we would expect that the broad lines observed in our objects,
once corrected for the observed reddening, are underluminous by a factor
of ![]() 100 with respect to the intrinsic luminosity indicated by the
absorption-corrected X-ray luminosity, when compared to unobscured type 1
Seyferts and QSOs. Figure 1 shows the broad
H
100 with respect to the intrinsic luminosity indicated by the
absorption-corrected X-ray luminosity, when compared to unobscured type 1
Seyferts and QSOs. Figure 1 shows the broad
H![]() luminosity, reddening-corrected
assuming a Galactic standard extinction curve,
versus the intrinsic X-ray luminosity, again for the objects listed in
Table 1 of Paper I.
luminosity, reddening-corrected
assuming a Galactic standard extinction curve,
versus the intrinsic X-ray luminosity, again for the objects listed in
Table 1 of Paper I.
![\begin{figure}
\par\includegraphics[width=6.4cm, clip]{10112f1.eps}\end{figure}](/articles/aa/full/2001/02/aa10112/img26.gif) |
Figure 1:
H |
| Open with DEXTER | |
We should however mention that the sample presented in Paper I (Table 1)
is probably biased in favor of
objects which are particularly bright in the broad lines emission,
just as a consequence
of the selection criterion (i.e. those absorbed objects which show at
least some broad emission lines). Nonetheless, it is highly unlikely that such
a selection effect accounts for a factor of ![]() 100 in the H
100 in the H![]() flux.
flux.
It is worth noting that a diagram analogous to Fig. 1 was presented
by Veilleux et al. (1999, therein Fig. 3) when discussing the detection
of broad Pa![]() in Ultraluminous Infrared Galaxies (ULIRGs); there
the broad
H
in Ultraluminous Infrared Galaxies (ULIRGs); there
the broad
H![]() is replaced by the broad Pa
is replaced by the broad Pa![]() and the (intrisic) X-ray
luminosity is replaced by the far-IR luminosity. From that diagram
it can be similarly inferred that the broad component of the Pa
and the (intrisic) X-ray
luminosity is replaced by the far-IR luminosity. From that diagram
it can be similarly inferred that the broad component of the Pa![]() detected in ULIRGs cannot be ascribed to reflection. For what concerns Seyfert
galaxies, Veilleux et al. (1997)
reached a similar conclusion stating that
the broad component of the hydrogen near-IR lines detected in some Sy2s cannot
be ascribed to reflection.
detected in ULIRGs cannot be ascribed to reflection. For what concerns Seyfert
galaxies, Veilleux et al. (1997)
reached a similar conclusion stating that
the broad component of the hydrogen near-IR lines detected in some Sy2s cannot
be ascribed to reflection.
Finally, also in the reflection scenario the lack of silicate absorption in Sy2s and of the lack of the carbon dip in reddened Sy1s is not explained.
Unlike the case of Galactic stars where both absorption and scattering
contribute to the extinction, in obscured AGNs we may have
effects of scattering back into our beam. This would imply a reduction
of the scattering component in the effective extinction curve. However, the net
effect must be small compared to what is observed for the objects of our sample.
Even in the most extreme case that the absorbing/scattering medium
covers the whole solid angle seeing by the nuclear source (that is very
unlikely) and that the scattered radiation enters our beam without undergoing
any dust absorption (that is also very unlikely), then the effect would be to
completely remove the scattering component out of the total extinction curve.
Since at the wavelengths of interest
![]() ,
the effect of this extreme case would be to reduce the
extinction and reddening by a factor of 3 at most. While in our sample we
observe several cases for which the reddening deficit is much higher.
,
the effect of this extreme case would be to reduce the
extinction and reddening by a factor of 3 at most. While in our sample we
observe several cases for which the reddening deficit is much higher.
The analysis above makes the implicit assumption that the line of sight is "typical'', but it is possible that the absorbing column along the line of sight is lower than the scattering column along the other directions. In the latter case, and under the extreme assumption discussed above, the effective extinction could be reduced further. Yet, this effect of scattering back into the beam would not explain the lack of absorption features in the UV and in the mid-IR.
Several reverberation mapping studies have shown that the BLR has a size
of ![]() 0.01 pc. More specifically
0.01 pc. More specifically
![]() pc
(Clavel et al. 1991; Peterson 1993;
Salamanca et al. 1994). On the other hand,
various pieces of evidence indicate that the obscuring torus has a size
of
pc
(Clavel et al. 1991; Peterson 1993;
Salamanca et al. 1994). On the other hand,
various pieces of evidence indicate that the obscuring torus has a size
of ![]() 1 pc or larger
(Gallimore et al. 1997; Greenhill &
Gwinn 1997; Ford et al. 1997;
Granato et al. 1997; Maiolino 2000, and
references therein). Since the scale of the latter is so much larger
than both the X-ray source and the BLR, the absorbing medium along
the line of sight should be the same for both. However, for many of the
objects in the sample presented in Paper I (Table 1)
the broad lines have a width of about 2000 kms-1, which
is somewhat narrower than usually observed in type 1 Seyferts and QSOs.
This might imply that in these objects the BLR, or the fraction of it that
we observe, is more extended than assumed and with dimensions comparable
to the obscuring torus. As a consequence, the BLR might
be observed, on average, through a lower absorbing column with respect
to the nuclear
X-ray source.
1 pc or larger
(Gallimore et al. 1997; Greenhill &
Gwinn 1997; Ford et al. 1997;
Granato et al. 1997; Maiolino 2000, and
references therein). Since the scale of the latter is so much larger
than both the X-ray source and the BLR, the absorbing medium along
the line of sight should be the same for both. However, for many of the
objects in the sample presented in Paper I (Table 1)
the broad lines have a width of about 2000 kms-1, which
is somewhat narrower than usually observed in type 1 Seyferts and QSOs.
This might imply that in these objects the BLR, or the fraction of it that
we observe, is more extended than assumed and with dimensions comparable
to the obscuring torus. As a consequence, the BLR might
be observed, on average, through a lower absorbing column with respect
to the nuclear
X-ray source.
However, since the broad lines in many of these objects are weak, very broad wings might have been undetected because either lost in the noise or confused with the underlying continuum features, thus yielding to an underestimate of the real width of these lines. Also, in some of these objects the broad lines were observed to vary on time scales shorter than a few months, suggesting a BLR scale smaller than 0.1 pc (Eracleous & Halpern 1993; Winkler et al. 1992; Rosenblatt et al. 1994; Giannuzzo & Stirpe 1996; Peterson et al. 1982, 1984; Miller et al. 1979, 1985).
Summarizing, we cannot exclude that for some of the objects in our sample the BLR is extended enough that the broad lines and the (much smaller) hard X-ray source are obscured by columns of gas that are significantly different. However, this is unlikely to be the case for most of the objects.
Finally, the lack of the silicate feature in the mid-IR spectra of Sy2s and the lack of the carbon dip in the UV spectra of reddened Sy1s remain unexplained by the differential absorption scenario discussed in this section.
If one or more BLR clouds are located along the line of sight
toward the X-ray nuclear source then they would contribute to the observed
gaseous absorbing column density (BLR clouds are expected to have
![]() cm-2), but obviously this absorbing column
would not affect the observed
broad line flux. However, should the low
cm-2), but obviously this absorbing column
would not affect the observed
broad line flux. However, should the low
![]() be a feature common
to most AGNs and should the cause of this effect be absorption by BLR
clouds, then this would require a large covering factor of the BLR clouds,
at least as high as the covering factor of the obscuring medium
be a feature common
to most AGNs and should the cause of this effect be absorption by BLR
clouds, then this would require a large covering factor of the BLR clouds,
at least as high as the covering factor of the obscuring medium![]() ,
i.e.
,
i.e. ![]() 80%. On the other hand
the covering factor of the BLR clouds is estimated to be low (
80%. On the other hand
the covering factor of the BLR clouds is estimated to be low (![]() 10%)
based on the absence of any Ly-edge cutoff in the UV spectrum of QSOs.
Therefore, absorption due BLR clouds might explain some
of the cases of low
10%)
based on the absence of any Ly-edge cutoff in the UV spectrum of QSOs.
Therefore, absorption due BLR clouds might explain some
of the cases of low
![]() ,
but probably not the majority of them.
,
but probably not the majority of them.
Another reason to discard this explanation is related to the lack of
strong and short term
variability of the absorbing ![]() in the X-rays. If most of the photoelectric
cutoff observed in the hard X-rays
is due to a single or a few BLR clouds along the line of sight,
then a strong variation of the
in the X-rays. If most of the photoelectric
cutoff observed in the hard X-rays
is due to a single or a few BLR clouds along the line of sight,
then a strong variation of the ![]() would be expected on a time scale
of a few weeks or less,
given the expected size of the BLR clouds (<0.01 pc) and their velocity.
However, about 1/3 of the objects in our sample were observed two or more
times in the hard X-rays (e.g. Gilli et al. 2000;
Malizia et al. 1997) and the
would be expected on a time scale
of a few weeks or less,
given the expected size of the BLR clouds (<0.01 pc) and their velocity.
However, about 1/3 of the objects in our sample were observed two or more
times in the hard X-rays (e.g. Gilli et al. 2000;
Malizia et al. 1997) and the ![]() inferred from
the cutoff does not show the strong variations expected from the motion of a
BLR cloud
passing on the line of sight. There are a few objects (most
of them not in our sample)
whose hard X-ray monitoring has indeed shown variations
of
inferred from
the cutoff does not show the strong variations expected from the motion of a
BLR cloud
passing on the line of sight. There are a few objects (most
of them not in our sample)
whose hard X-ray monitoring has indeed shown variations
of ![]() ,
but such variations are on time scales of years, i.e. consistent
with a distance of the absorber from the nucleus of a few pc
(Maiolino 2000).
The only case known to show rapid
,
but such variations are on time scales of years, i.e. consistent
with a distance of the absorber from the nucleus of a few pc
(Maiolino 2000).
The only case known to show rapid ![]() variability is NGC 4151.
variability is NGC 4151.
Again, the issues related to the silicate feature and to the carbon dip remain unexplained also in this case.
The inner part of the obscuring torus is directly exposed to the UV radiation
emitted by the nuclear source. If the UV flux at this location is large enough,
the dust
equilibrium temperature can reach the sublimation value (Laor
& Draine 1993; Phinney 1989). If dust is sublimated
for a significant fraction of the absorbing gaseous column
this would explain the reduced EB-V with respect
to that expected from the observed ![]() .
However, this model has problems when compared with the low covering factor
inferred for the ionized gas in the circumnuclear region of AGNs, as discussed
in the following.
.
However, this model has problems when compared with the low covering factor
inferred for the ionized gas in the circumnuclear region of AGNs, as discussed
in the following.
The capability of the dust in competing with the gas in the absorption of UV ionizing photons increases significantly with the ionization parameter U. Indeed, a highly ionized gas is much more transparent than dust to the UV ionizing photons. In particular, for a Galactic gas-to-dust ratio and dust composition, dust grains are expected to dominate the absorption of photons beyond the Lyman edge when U is higher than about 10-2. At the inner face of the torus the ionization parameter is expected to be about 0.1 or larger (Netzer & Laor 1993; Netzer 2000) and therefore most of the UV ionizing photons should be absorbed by the dust which reprocesses this radiation into near and mid-IR emission, which is actually observed in the nuclear region of AGNs (e.g. Maiolino et al. 1995, 1998; Clavel et al. 2000; Thatte et al. 1997; Oliva et al. 1999). As a consequence, although the obscuring torus probably subtends as much as 80% of the solid angle seen by the nuclear UV source, very little line emission is produced. The emission lines that would be produced by the torus in absence of dust should have a width significantly smaller than the broad lines and close to the width of the narrow lines. The effect of strong absorption of UV ionizing photons from dust at the inner face of the torus has been proposed to explain the marked separation between BLR and NLR and to explain the low covering factor of the NLR. A more detailed discussion of this issue is given in Netzer & Laor (1993), in Laor & Draine (1993) and Pier & Voit (1995). Here we do not discuss further the implications of dust absorption for the photoionization models of the circumnuclear gas, but we use these considerations as a constraint for the properties of the dust at the inner face of the torus.
If most of the gas in the torus is dust-free, especially at the inner face,
because of dust sublimation, then photons at wavelengths
shortward of the Ly edge should ionize the gas in the
torus and should produce powerful hydrogen lines nearly as narrow as the
narrow lines.
The covering factor of the torus is estimated to be ![]() 80%.
Until a few years ago the covering factor of the NLR was estimated to
be
80%.
Until a few years ago the covering factor of the NLR was estimated to
be ![]() 2% (e.g. Netzer & Laor 1993); however recent observations of the
UV spectrum of QSOs indicate a shortage of ionizing photons with respect to
former estimates by a factor of about 4 (Zheng et al. 1997;
Laor et al. 1997) therefore
implying a larger covering factor of the NLR (
2% (e.g. Netzer & Laor 1993); however recent observations of the
UV spectrum of QSOs indicate a shortage of ionizing photons with respect to
former estimates by a factor of about 4 (Zheng et al. 1997;
Laor et al. 1997) therefore
implying a larger covering factor of the NLR (![]() 8%), but which
is still much
lower than the covering factor estimated for the obscuring torus.
As a consequence,
the flux of the emission lines produced by the dust-sublimated torus
should be about 10 times larger than the observed narrow lines.
8%), but which
is still much
lower than the covering factor estimated for the obscuring torus.
As a consequence,
the flux of the emission lines produced by the dust-sublimated torus
should be about 10 times larger than the observed narrow lines.
A possible way to suppress the line emission in the dust sublimated medium is to make the ionized gas very hot. However, in the latter case the absorbing medium observed in the hard X-rays should appear "warm'' (according to the X-ray standards). On the other hand, in most of the objects of the sample presented in Paper I the absorbing gas is "cold'' beyond doubt.
Summarizing, it is difficult to ascribe the low
![]() ratio to dust
sublimation at the inner face of the torus without running into a serious
emission line budget problem.
ratio to dust
sublimation at the inner face of the torus without running into a serious
emission line budget problem.
For what concerns the absorption features, dust sublimation might explain the
lack of the carbon dip at 2175 Å in reddened Sy1s, since the very small
grains which are responsible for this feature undergo sublimation more easily
than larger grains.
However, it is difficult to ascribe the lack of the silicate feature in the
spectra of Sy2s to sublimation,
indeed the absence of this absorption feature
requires a dust distribution dominated by grains larger than
a few ![]() m (i.e. significantly larger than the maximum dimension of 0.25
m (i.e. significantly larger than the maximum dimension of 0.25 ![]() m
inferred for the Galactic medium), rather than
the destruction of small grains (Sect. 3.3).
m
inferred for the Galactic medium), rather than
the destruction of small grains (Sect. 3.3).
One of the simplest ways to explain the observed low
![]() is to assume that the dust-to-gas mass ratio in the obscuring medium
is lower than the standard Galactic value. However, a reduced abundance of dust
in the dense medium of the circumnuclear clouds is not obvious to
justify. The vicinity of the
AGN could help to create the conditions that
act to destroy dust grains. In particular, sputtering by X-rays
and/or shocks might be a possible mechanisms of dust destruction in this
environment.
is to assume that the dust-to-gas mass ratio in the obscuring medium
is lower than the standard Galactic value. However, a reduced abundance of dust
in the dense medium of the circumnuclear clouds is not obvious to
justify. The vicinity of the
AGN could help to create the conditions that
act to destroy dust grains. In particular, sputtering by X-rays
and/or shocks might be a possible mechanisms of dust destruction in this
environment.
Obviously, the
![]() ratio decreases linearly with the
dust-to-gas ratio, if the dust properties remain unchanged. This is shown
in the top panel of Fig. 2.
ratio decreases linearly with the
dust-to-gas ratio, if the dust properties remain unchanged. This is shown
in the top panel of Fig. 2.
![\begin{figure}
\par\includegraphics[width=6.4cm, clip]{new_10112f2.eps}\end{figure}](/articles/aa/full/2001/02/aa10112/img32.gif) |
Figure 2:
Expected variation of extinction and emission line properties
as a function of the dust-to-gas ratio relative to the Galactic value.
The predictions of the models, which assume a standard dust size
distribution, are shown by the thick solid lines.
The upper two panels show the expected variation of the
|
| Open with DEXTER | |
As the dust content decreases, the absorption of UV ionizing photons by dust grains becomes gradually less important and, as discussed in the previous section, the emission of nebular lines gradually increases. In order to check whether the required dust depletion runs into the same emission line budget problem as in the case of the sublimated dust (Sect. 2.5), we have created a simple semi-analytical code to calculate the ionization structure and hydrogen lines emissivity of a gaseous cloud containing a variable amount of dust. We assumed a ionization parameter U=0.1at the inner face of the cloud, as this is about the value expected at the inner face of the torus (Netzer & Laor 1993). The covering factor was assumed to be 80%.
The results of the model were then compared with the expected emission line
flux in the case of a dust-free medium with a covering factor equal to unity,
i.e. the maximum hydrogen line flux (H![]() (max))
which can be obtained with the available photoionizing luminosity.
The ratio between the hydrogen line flux in the dusty
and in the dust-free cases gives the importance of the line emission from the
obscuring torus relative to other gaseous clouds which are either
free from dust, such as the BLR clouds, or whose ionization parameter is
low enough to make unimportant the effect of dust absorption of
UV ionizing photons, such as
the NLR clouds. The thick black solid line in the bottom panel of
Fig. 2 shows the ratio between
the H
(max))
which can be obtained with the available photoionizing luminosity.
The ratio between the hydrogen line flux in the dusty
and in the dust-free cases gives the importance of the line emission from the
obscuring torus relative to other gaseous clouds which are either
free from dust, such as the BLR clouds, or whose ionization parameter is
low enough to make unimportant the effect of dust absorption of
UV ionizing photons, such as
the NLR clouds. The thick black solid line in the bottom panel of
Fig. 2 shows the ratio between
the H![]() flux in the case of a dusty medium (80% covering factor)
and the case of a dust-free medium (100% covering factor),
H
flux in the case of a dusty medium (80% covering factor)
and the case of a dust-free medium (100% covering factor),
H![]() (torus)/H
(torus)/H![]() (max),
as a function of the dust-to-gas ratio in the obscuring torus.
(max),
as a function of the dust-to-gas ratio in the obscuring torus.
We also performed the same calculation with Cloudy, the photoionization code
provided by Ferland and collaborators (Ferland 1999),
which accounts for
several effects which are not included in our simple code. The output of Cloudy
is overplotted with a thin solid line in the bottom panel of Fig. 2. Cloudy's
result is not much different from ours and, partly, it is also to ascribe to
the extinction curve used by Cloudy which is somewhat different from the
Galactic standard curve (e.g.
RV = AV/EB-V =4, to be compared
with the standard Galactic value of RV = 3.1). This comparison justifies
us in using our code also for other models in the next section (Sect. 3).
The advantage of
our code is that it is possible to use an arbitrary dust composition with a
(quasi-) continuous distribution of grain sizes.
The H![]() (torus)/H
(torus)/H![]() (max) values obtained with the model discussed above
have to be compared with the flux of the narrow lines.
More specifically, the flux of the lines emitted by the torus should be lower
than the flux of the narrow lines not to incur in the emission line budget
problems discussed in Sect. 2.5; this implies that
H
(max) values obtained with the model discussed above
have to be compared with the flux of the narrow lines.
More specifically, the flux of the lines emitted by the torus should be lower
than the flux of the narrow lines not to incur in the emission line budget
problems discussed in Sect. 2.5; this implies that
H![]() (torus)/H
(torus)/H![]() (max) must be lower than the covering factor of the
NLR clouds, i.e.
(max) must be lower than the covering factor of the
NLR clouds, i.e. ![]() (Sect. 2.5).
This limit is shown with an horizontal line in the
bottom panel of Fig. 2. The dust-to-gas ratio required to match the
mean observed
(Sect. 2.5).
This limit is shown with an horizontal line in the
bottom panel of Fig. 2. The dust-to-gas ratio required to match the
mean observed
![]() would give
H
would give
H![]() (torus)/H
(torus)/H![]() (max)
(max)
![]() that is inconsistent with the
NLR covering factor. Although,
higher values of
that is inconsistent with the
NLR covering factor. Although,
higher values of
![]() might be marginally
consistent with the NLR emission, the values
of
might be marginally
consistent with the NLR emission, the values
of
![]() lower than the mean would imply an even
higher H
lower than the mean would imply an even
higher H![]() (torus)/H
(torus)/H![]() (max), as shown in Fig. 2.
(max), as shown in Fig. 2.
In Sect. 2.1 we mentioned that the nuclear region of AGNs is generally
characterized by super-solar metallicities.
As we are going to discuss, a high metallicity helps
to relax the constraints on the emission
line flux. Metallicity variations change the dust-to-gas
ratio, but the variation of the dust-to-gas ratio due to metallicity leaves
unaffected the measured
![]() and
and
![]() .
As discussed in Sect. 2.1,
this is because the
.
As discussed in Sect. 2.1,
this is because the ![]() is measured in the hard X-rays through the
column of metals. On the other hand, the increased dust-to-gas ratio,
regardless of whether due to metallicity or to other effects, does affect
the dust-to-gas opacity for the UV ionizing photons
and, therefore, changes the
H
is measured in the hard X-rays through the
column of metals. On the other hand, the increased dust-to-gas ratio,
regardless of whether due to metallicity or to other effects, does affect
the dust-to-gas opacity for the UV ionizing photons
and, therefore, changes the
H![]() (torus)/H
(torus)/H![]() (max) accordingly. As a consequence, even if
metallicity does not affect the
(max) accordingly. As a consequence, even if
metallicity does not affect the
![]() ratio, it can "decouple''
the latter ratio from the emission line budget constraints. In particular,
the dotted lines in Fig. 2
show the effect of a metallicity three times higher than solar. On the
top and central panel of Fig. 2 the (metallicity-)
increased dust-to-gas ratio leaves unaffected
the quantities on the Y-axis, thus yielding a shift on the X-axis. Instead,
in the bottom panel
the H
ratio, it can "decouple''
the latter ratio from the emission line budget constraints. In particular,
the dotted lines in Fig. 2
show the effect of a metallicity three times higher than solar. On the
top and central panel of Fig. 2 the (metallicity-)
increased dust-to-gas ratio leaves unaffected
the quantities on the Y-axis, thus yielding a shift on the X-axis. Instead,
in the bottom panel
the H![]() (torus)/H
(torus)/H![]() (max) ratio does change accordingly to the
reduced dust-to-gas ratio, i.e. this ratio keep following the trend given
by the solid line. As a result, for the same
(max) ratio does change accordingly to the
reduced dust-to-gas ratio, i.e. this ratio keep following the trend given
by the solid line. As a result, for the same
![]() ratio
the implied H
ratio
the implied H![]() (torus)/H
(torus)/H![]() (max) is significantly lower.
In particular,
at the dust-to-gas
ratio which gives an
(max) is significantly lower.
In particular,
at the dust-to-gas
ratio which gives an
![]() accounting for the mean observed value,
H
accounting for the mean observed value,
H![]() (torus)/H
(torus)/H![]() (max)
(max) ![]() 0.07, which is marginally consistent with the covering factor of the NLR.
Yet,
for lower values of
0.07, which is marginally consistent with the covering factor of the NLR.
Yet,
for lower values of
![]() the line emission from the torus is still
much larger than the NLR.
the line emission from the torus is still
much larger than the NLR.
Summarizing, a low gas-to-dust (mass) density ratio might probably explain
the reduced
![]() for several of the objects without
incurring in emission line budget problems, especially if the
metallicity is super-solar as claimed by several authors. However, low
values of
for several of the objects without
incurring in emission line budget problems, especially if the
metallicity is super-solar as claimed by several authors. However, low
values of
![]() (lower than the mean)
are still difficult to explain with this model.
(lower than the mean)
are still difficult to explain with this model.
Certainly, the reduced dust-to-gas ratio alone cannot account for the lack of the silicate feature in the mid-IR spectra of Sy2, nor for the lack of the carbon dip in reddened Sy1s.
So far we have adopted the standard extinction curve observed in the
diffuse Galactic interstellar medium.
However, the physical conditions of the
gas in the nuclear region of Seyferts and QSOs are so extreme that there is no
reason to assume that dust has the same properties as in the diffuse
interstellar medium of our Galaxy.
The gas densities of the obscuring medium in AGNs probably exceeds
105-106 cm-3,![]() i.e. a density similar or higher than observed in the
densest dark clouds of our Galaxy.
Along the line of sight of dense Galactic molecular clouds
the extinction curve is generally found to be flatter than in
the diffuse ISM (Vrba & Rydgren 1984; Carrasco et al. 1973;
Whittet et al. 1976; Cardelli et al. 1989).
Various observational evidences indicate that most likely such
flat extinction curves are due to a distribution of grain sizes on average
larger than in the diffuse ISM (Kim et al. 1994;
Weingartner & Draine 2000).
Larger grains may form either by accretion from
the gas phase or by grain coagulation. The former case should increase the
i.e. a density similar or higher than observed in the
densest dark clouds of our Galaxy.
Along the line of sight of dense Galactic molecular clouds
the extinction curve is generally found to be flatter than in
the diffuse ISM (Vrba & Rydgren 1984; Carrasco et al. 1973;
Whittet et al. 1976; Cardelli et al. 1989).
Various observational evidences indicate that most likely such
flat extinction curves are due to a distribution of grain sizes on average
larger than in the diffuse ISM (Kim et al. 1994;
Weingartner & Draine 2000).
Larger grains may form either by accretion from
the gas phase or by grain coagulation. The former case should increase the
![]() ratio, while the latter case should generally yield a reduced
ratio, while the latter case should generally yield a reduced
![]() .
Although measurements of
.
Although measurements of
![]() are very uncertain, some
works suggest that
are very uncertain, some
works suggest that
![]() is lower in dense clouds characterized by
flatter extinction curves, therefore supporting the coagulation scenario
(Jura 1980;
Kim & Martin 1996). Also, theoretical considerations
indicate that coagulation is much more effective for the growth of dust grains
than accretion from the gas phase (Draine 2000).
is lower in dense clouds characterized by
flatter extinction curves, therefore supporting the coagulation scenario
(Jura 1980;
Kim & Martin 1996). Also, theoretical considerations
indicate that coagulation is much more effective for the growth of dust grains
than accretion from the gas phase (Draine 2000).
Since the grain coagulation rate increases with density (
![]() ,
Draine 1985), the effect is expected to be even more dramatic in the
circumnuclear clouds of AGNs. In particular, for a gas density in excess
of 106 cm-2 the estimated time scale for the depletion of small
grains due to coagulation is shorter than about 105 yr, i.e. shorter
than the typical dynamical time scale in the circumnuclear region
of AGNs. This not only implies that dust grains have time
to coagulate before being replaced by gas coming from the outer regions,
but actually some mechanism that prevents grains to grow without limits
must be invoked (e.g. shocks).
,
Draine 1985), the effect is expected to be even more dramatic in the
circumnuclear clouds of AGNs. In particular, for a gas density in excess
of 106 cm-2 the estimated time scale for the depletion of small
grains due to coagulation is shorter than about 105 yr, i.e. shorter
than the typical dynamical time scale in the circumnuclear region
of AGNs. This not only implies that dust grains have time
to coagulate before being replaced by gas coming from the outer regions,
but actually some mechanism that prevents grains to grow without limits
must be invoked (e.g. shocks).
Summarizing, a dust distribution biased in favor of large grains, probably as a consequence of coagulation, is naturally expected in the extreme physical conditions of the gas in the circumnuclear region of AGNs.
The presence of large grains in the obscuring medium of AGNs was also proposed by Laor & Draine (1993) in relation to the IR properties of active nuclei. In the following we discuss the effects of large grains, specifically formed by coagulation, on the observational quantities discussed in Paper I.
To obtain a more quantitative description of the effects of large grains in
the circumnuclear region of AGNs we modelled the
size grain distribution with a power-law:
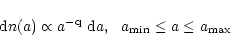 |
(1) |
Figure 3 is analogous to Fig. 2, but in this case the dust-to-gas (mass) ratio
is kept constant, while ![]() increases along the abscissa and the
other two dust parameters are kept constant at q=3.5 and
increases along the abscissa and the
other two dust parameters are kept constant at q=3.5 and
![]() .
.
![\begin{figure}
\par\includegraphics[width=6.4cm, clip]{new_10112f3.eps}\end{figure}](/articles/aa/full/2001/02/aa10112/img50.gif) |
Figure 3:
Same as Fig. 2, but in this case the dust-to-gas ratio is constant
while the maximum size of the grain distribution |
| Open with DEXTER | |
In addition to the panels shown in Fig. 2, we also
include in Fig. 3 a panel giving the variation of
RV = AV/EB-V(the larger is RV the flatter is the extinction curve).
In this case RVincreases up to ![]() 7 for very large
7 for very large ![]() .
Such large values of RVimply that the absorption in the optical is higher than that estimated
from the reddening assuming a Galactic extinction curve.
.
Such large values of RVimply that the absorption in the optical is higher than that estimated
from the reddening assuming a Galactic extinction curve.
The H![]() luminosities for the objects shown in Fig. 1 were corrected assuming
RV=3.1. If RV is higher than Galactic, then
the H
luminosities for the objects shown in Fig. 1 were corrected assuming
RV=3.1. If RV is higher than Galactic, then
the H![]() luminosities have been
underestimated by the following quantity:
luminosities have been
underestimated by the following quantity:
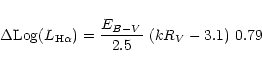 |
(2) |
The second panel of Fig. 3 shows the expected trend for
![]() (thick solid line). This ratio has a steep decline as a
function of
(thick solid line). This ratio has a steep decline as a
function of ![]() .
It should be noted that the locus of the values
observed in AGNs (shaded area) is no longer constant as in Fig. 2, this is
because we also took into account that the reddening estimate
EB-V based on the broad line ratios (Paper I)
changes with the extinction
curve. The mean
.
It should be noted that the locus of the values
observed in AGNs (shaded area) is no longer constant as in Fig. 2, this is
because we also took into account that the reddening estimate
EB-V based on the broad line ratios (Paper I)
changes with the extinction
curve. The mean
![]() of the AGNs in our sample can be
explained with
of the AGNs in our sample can be
explained with
![]() m. A much larger value of
m. A much larger value of
![]() (
(
![]() m) is required to match the properties of
objects with lower
m) is required to match the properties of
objects with lower
![]() .
.
The ratio
![]() also decreases rapidly with
also decreases rapidly with ![]() ,
indicating that large grains can, more generally,
explain the low
,
indicating that large grains can, more generally,
explain the low
![]() inferred
for many AGNs and discussed in Paper I.
inferred
for many AGNs and discussed in Paper I.
The emission line budget problem does not improve much
with respect to the case
of low dust-to-gas ratio discussed in Sect. 2.6: for solar
metallicities, the
![]() ratio ranges from
ratio ranges from
![]() 0.04 up to
0.04 up to ![]() for the values of
for the values of ![]() required to
match the observed
required to
match the observed
![]() .
.
In the case of super-solar metallicities the dust-to-gas ratio increases,
but both
the extinction curve, and the
![]() and
and
![]() ratios
remain unchanged, as discussed in Sect. 2.6. However, the
ratios
remain unchanged, as discussed in Sect. 2.6. However, the
![]() ratio decreases as a consequence of the
increased dust absorption of UV ionizing photons
(see discussion in Sect. 2.6). The case
of an increased dust-to-gas ratio due to a
metallicity three times higher than solar is
shown with a dotted line in the bottom panel of Fig. 3. In this case the
constraints given by the narrow
line flux are met better and, in particular, for
ratio decreases as a consequence of the
increased dust absorption of UV ionizing photons
(see discussion in Sect. 2.6). The case
of an increased dust-to-gas ratio due to a
metallicity three times higher than solar is
shown with a dotted line in the bottom panel of Fig. 3. In this case the
constraints given by the narrow
line flux are met better and, in particular, for
![]() lower than about 100
lower than about 100 ![]() m,
the expected
m,
the expected
![]() is lower than the NLR
constraints. Yet, very low values of
is lower than the NLR
constraints. Yet, very low values of
![]() (observed for
some of the objects analyzed in Paper I) remain difficult to
explain with this model.
(observed for
some of the objects analyzed in Paper I) remain difficult to
explain with this model.
In Fig. 4 we show another "family'' of grain distribution models: here
![]() is kept constant and equal to 1
is kept constant and equal to 1 ![]() m, while q decreases
along the abscissa. The extinction curve flattens very rapidly with q,
as also indicated by the rapid growth of RV. As shown, in the
second panel, such flat extinction curve would explain the objects with
nearly no reddening EB-V, although substantial gaseous column
m, while q decreases
along the abscissa. The extinction curve flattens very rapidly with q,
as also indicated by the rapid growth of RV. As shown, in the
second panel, such flat extinction curve would explain the objects with
nearly no reddening EB-V, although substantial gaseous column
![]() is observed along the line (Paper I).
is observed along the line (Paper I).
![\begin{figure}
\par\includegraphics[width=6.4cm, clip]{new_10112f4.eps}\end{figure}](/articles/aa/full/2001/02/aa10112/img61.gif) |
Figure 4:
Same as Fig. 3, but in this case the maximum size of the
grain distribution |
| Open with DEXTER | |
Another important effect of this "family'' of models is that, at variance with
the
![]() ratio, the
ratio, the
![]() ratio is not
reduced by a large factor, as shown in Fig. 4. Therefore, this class of models
does not provide the most likely explanation for objects
characterized by very low
ratio is not
reduced by a large factor, as shown in Fig. 4. Therefore, this class of models
does not provide the most likely explanation for objects
characterized by very low
![]() values (Paper I).
values (Paper I).
![\begin{figure}
\par\includegraphics[width=6.4cm, clip]{new_10112f5.eps}\end{figure}](/articles/aa/full/2001/02/aa10112/img64.gif) |
Figure 5:
Same as Fig. 4, but with
|
| Open with DEXTER | |
Yet, one of the most appealing properties of this family of models is that
the
![]() ratio is low (
ratio is low (![]() 8% at most)
and may be much lower than the NLR constrain, especially
if the dust-to-gas ratio is increased as a consequence of
super-solar metallicity (bottom panel of Fig. 4).
The value of
8% at most)
and may be much lower than the NLR constrain, especially
if the dust-to-gas ratio is increased as a consequence of
super-solar metallicity (bottom panel of Fig. 4).
The value of
![]() is obviously unaffected by a fraction of the column density containing
"normal'' Galactic dust, if the latter is located in the outer parts of the
torus.
is obviously unaffected by a fraction of the column density containing
"normal'' Galactic dust, if the latter is located in the outer parts of the
torus.
This family of models is shown in Fig. 5. These are similar to those discussed in Laor & Draine (1993). Here we do not discuss in detail the properties of these models, but mostly focus on the main differences and similarities with the former case.
In these models the effect of decreasing q not only
rapidly flattens the extinction curve, but also decreases significantly the
absorption AV, and therefore can easily explain little reddened objects
with low
![]() (Paper I). If the metallicity is three times solar,
or higher, the range of q required to match the
(Paper I). If the metallicity is three times solar,
or higher, the range of q required to match the
![]() distribution
of most objects (q>3.1)
also complies with the NLR constraint
on the torus emission line flux (bottom panel of
Fig. 5).
distribution
of most objects (q>3.1)
also complies with the NLR constraint
on the torus emission line flux (bottom panel of
Fig. 5).
As a consequence of the much reduced absorption AV,
the inclusion of an outer layer of
Galactic dust reduces much more RV and affect much less
![]() .
This is
shown by the thick
dashed line in Fig. 5, which gives the case with only 3% of the
(outer) column of gas
containing Galactic "standard'' dust. Therefore, this family of
models relaxes the problems on the large RV discussed in the family
of models discussed in Sect. 3.2.2:
it gives very low
.
This is
shown by the thick
dashed line in Fig. 5, which gives the case with only 3% of the
(outer) column of gas
containing Galactic "standard'' dust. Therefore, this family of
models relaxes the problems on the large RV discussed in the family
of models discussed in Sect. 3.2.2:
it gives very low
![]() and also
and also
![]() values without incurring in large values of RV.
values without incurring in large values of RV.
We cannot describe here all of the dust models that matches the specific
constraints for
each single object. However, for most of the AGNs discussed in Paper I one or
more dust distribution models match the specific constraints on
![]() ,
EB-V, broad lines luminosity and detection.
,
EB-V, broad lines luminosity and detection.
As mentioned in the introduction and discussed more in detail in Paper I, Sy2s
appear characterized by significant mid-IR absorption which, nonetheless, is
not associated to a deep silicate absorption feature at 9.7 ![]() m which is
expected by
a Galactic extinction curve. Since this silicate feature is produced by
grains smaller than a few
m which is
expected by
a Galactic extinction curve. Since this silicate feature is produced by
grains smaller than a few ![]() m, a dust distribution
dominated by large grains can also explain this "anomaly'' of the mid-IR
spectra of Sy2s, as discussed in the following.
m, a dust distribution
dominated by large grains can also explain this "anomaly'' of the mid-IR
spectra of Sy2s, as discussed in the following.
![\begin{figure}
\par\includegraphics[width=6.4cm, clip]{10112f6.eps}\end{figure}](/articles/aa/full/2001/02/aa10112/img68.gif) |
Figure 6:
Depth of the silicate feature relative to the featureless mid-IR
absorption as measured by ratio
|
| Open with DEXTER | |
We take the optical depth at 7.7 ![]() m as representative of the featureless
absorption in the vicinity of the silicate feature. We specifically choose this
wavelength because it is the location of the PAH whose equivalent width is used by
Clavel et al. (2000)
to determine the mid-IR absorption. The difference of the
optical depths
m as representative of the featureless
absorption in the vicinity of the silicate feature. We specifically choose this
wavelength because it is the location of the PAH whose equivalent width is used by
Clavel et al. (2000)
to determine the mid-IR absorption. The difference of the
optical depths
![]() is an alternative way to measure the
equivalent width of the silicate feature, as long as it is not saturated.
The ratio
is an alternative way to measure the
equivalent width of the silicate feature, as long as it is not saturated.
The ratio
![]() is a measure of the depth of the
silicate feature relative to the featureless mid-IR absorption. In Fig. 6 the
upper horizontal line indicates the standard Galactic value of this ratio,
while the lower horizontal line indicates the (mean) upper limit of this ratio
for Sy2s, as inferred from the data in Clavel et al. (2000),
and the shaded
area gives the spread of the upper limits (as inferred from the spread of the
EW of the PAH at 7.7
is a measure of the depth of the
silicate feature relative to the featureless mid-IR absorption. In Fig. 6 the
upper horizontal line indicates the standard Galactic value of this ratio,
while the lower horizontal line indicates the (mean) upper limit of this ratio
for Sy2s, as inferred from the data in Clavel et al. (2000),
and the shaded
area gives the spread of the upper limits (as inferred from the spread of the
EW of the PAH at 7.7 ![]() m). Figure 6 illustrates in different terms
what was already discussed in Paper I: the upper limit on the
depth of the silicate feature in the average spectrum of Sy2s is about
one order of magnitude lower than expected from the Galactic extinction curve.
The curves plotted in the diagram show the expected
m). Figure 6 illustrates in different terms
what was already discussed in Paper I: the upper limit on the
depth of the silicate feature in the average spectrum of Sy2s is about
one order of magnitude lower than expected from the Galactic extinction curve.
The curves plotted in the diagram show the expected
![]() ratio according to the coagulation
models discussed in Sect. 3.2. In particular, the dashed
line refers to the model presented in Sect. 3.2.1 (q constant and equal to 3.5)
and is related to the upper abscissa scale, while the solid curves refer
to the models presented in Sects. 3.2.2 and 3.2.3
(
ratio according to the coagulation
models discussed in Sect. 3.2. In particular, the dashed
line refers to the model presented in Sect. 3.2.1 (q constant and equal to 3.5)
and is related to the upper abscissa scale, while the solid curves refer
to the models presented in Sects. 3.2.2 and 3.2.3
(![]() constant) and are related to the
lower abscissa scale. All of these models predict a depth of the silicate
feature significantly lower than Galactic. The model with
constant) and are related to the
lower abscissa scale. All of these models predict a depth of the silicate
feature significantly lower than Galactic. The model with
![]() m
can easily fit the constraint it given by the mid-IR
observations, with q just slightly lower than the canonical value of 3.5.
m
can easily fit the constraint it given by the mid-IR
observations, with q just slightly lower than the canonical value of 3.5.
As mentioned in Paper I (Sect. 4.1), the inner (hotter) mid-IR emitting
region probably is not featureless but is also characterized by the 9.7 ![]() m
feature in emission. Since the upper limit on
m
feature in emission. Since the upper limit on
![]() was
determined assuming an intrinsic featureless continuum, the possible presence
of the 9.7
was
determined assuming an intrinsic featureless continuum, the possible presence
of the 9.7 ![]() m feature in emission should relax such an upper limit.
However, as mentioned in Paper I, the equivalent width of the 9.7
m feature in emission should relax such an upper limit.
However, as mentioned in Paper I, the equivalent width of the 9.7 ![]() m emission
feature is so small that the upper limit on
m emission
feature is so small that the upper limit on
![]() would
increase by a quantity of 0.15 at most, which certainly cannot account for the
the discrepancy with the value expected for the Galactic case (Fig. 6).
would
increase by a quantity of 0.15 at most, which certainly cannot account for the
the discrepancy with the value expected for the Galactic case (Fig. 6).
Finally, we wish to emphasize that the presence of strong PAH features in the ISO spectra of Seyfert galaxies is not in contractdiction with our large grain model, since such PAH features most likely come from the host galaxy (where the dust properties are probably similar to the Galactic ISM) and not from the nuclear region.
In Sects. 3.2 and 3.3
we only considered the effects of coagulation by increasing ![]() and by decreasing q, since these are the parameters which primarily
affect RV,
and by decreasing q, since these are the parameters which primarily
affect RV,
![]() ,
,
![]() and the silicate feature. The
latter quantities are instead little sensitive to
and the silicate feature. The
latter quantities are instead little sensitive to ![]() .
However, this
is not the case for the carbon dip which, in the model
of Mathis et al. (1977) is ascribed to graphite grains with
sizes in the range 100 Å-200 Å. In particular, the carbon dip is washed
away from the extinction curve if coagulation depletes small grains by
increasing
.
However, this
is not the case for the carbon dip which, in the model
of Mathis et al. (1977) is ascribed to graphite grains with
sizes in the range 100 Å-200 Å. In particular, the carbon dip is washed
away from the extinction curve if coagulation depletes small grains by
increasing ![]() above 200 Å. This is shown in Fig. 7, where we plot
the variation in the UV shape extinction curve by modifying the dust
distribution to have
above 200 Å. This is shown in Fig. 7, where we plot
the variation in the UV shape extinction curve by modifying the dust
distribution to have
![]() m
and leaving
m
and leaving ![]() and q to the standard values of 0.25 and 3.5,
respectively.
and q to the standard values of 0.25 and 3.5,
respectively.
Note that recent studies have shown that most of the profile of the 2175 Å dip is probably produced by even smaller grains (PAHs, Weingartner & Draine 2000) that are not included in our model. Obviously, in this case the depletion of small grains onto larger grains through coagulation would be even more effective in removing the 2175 Å dip.
![\begin{figure}
\par\includegraphics[width=6.4cm, clip]{10112f7.eps}\end{figure}](/articles/aa/full/2001/02/aa10112/img71.gif) |
Figure 7:
Comparison of the Galactic UV extinction curve with the extinction
curve given by a dusty medium which is depleted of
grains smaller than 0.03 |
| Open with DEXTER | |
As a consequence, the coagulation scenario is also supported by the lack of a prominent carbon dip in spectra of reddened Sy1s (Paper I). However, the depletion of small grains can also be achieved with other physical processes (e.g. sublimation, Sect. 2.5) and, therefore, the absence of the carbon dip alone cannot be used to rule out other scenarios. Yet, whatever is the mechanism responsible for depleting small grains, the absence of the carbon dip certainly indicates that the properties of dust in AGNs are different from Galactic and, in particular, that the dust distribution is biased in favor of large grains.
We have discussed various interpretations of the observational evidences for
"anomalous'' properties of dust in the circumnuclear region of AGNs and, in
particular, the reduced
![]() ,
the reduced
,
the reduced
![]() ,
the
absence of the silicate absorption feature in the mid-IR spectra of Sy2s and
the absence of the carbon dip in the UV spectra of reddened Sy1s, which are
reported in a companion paper (Maiolino et al. 2001, Paper I).
,
the
absence of the silicate absorption feature in the mid-IR spectra of Sy2s and
the absence of the carbon dip in the UV spectra of reddened Sy1s, which are
reported in a companion paper (Maiolino et al. 2001, Paper I).
A dust distribution dominated by large grains as a consequence of coagulation
is the interpretation which best fit the various observational constraints.
The formation of large grains is naturally expected
in the high density environment characterizing
the circumnuclear region of AGNs. A dust grain distribution biased in favor of
large grains makes the extinction curve flatter than Galactic and featureless
(especially for what concerns the silicate mid-IR feature and the UV carbon
dip). Coagulation also yields a reduced
![]() and
and
![]() .
.
It should be noted that nearly all of the papers, published so far, dealing with the effects of dust in AGNs have adopted a standard Galactic extinction curve (essentially with the only exception of Laor & Draine 1993, who first proposed the large grain scenario). The assumption that the properties of dust in the extreme conditions of the circumnuclear region of AGNs are similar to the Galactic diffuse interstellar medium is somewhat naive, given that even in the denser clouds of our Galaxy the extinction curve is already different with respect to the diffuse medium. Probably, many of the past studies considering the effects of dust obscuration and scattering in AGNs should be revised at the light of the findings obtained in this paper.
With regard to the scattered radiation (especially in obscured AGNs) it is
worth noting that a dust distribution dominated by large grains would yield a
nearly gray reflection, thus mimicking the scattering by free electrons. Large
grains produced by dust coagulation would have a reduced scattering efficiency
with respect to the standard Galactic dust mixture. However, while in some
cases coagulation can result in a reduction of the scattering efficiency by
more than an order of
magnitude, for some of the dust grain distributions producing a flat
extinction and scattering curve the reduction in the scattering efficincy is
much lower (e.g. for the model discussed in 3.2.2 the scattering efficiency is
reduced by a factor of ![]() 2). Therefore, it is possible that some of the
gray-reflected spectra found in some obscured AGNs, and ascribed to electron
scattering, might actually be produced by large grains scattering.
2). Therefore, it is possible that some of the
gray-reflected spectra found in some obscured AGNs, and ascribed to electron
scattering, might actually be produced by large grains scattering.
We have also examined other possible interpretations for the "anomalous'' dust
properties discussed in Paper I, and more specifically:
Acknowledgements
We are grateful to B. Draine for enlightening discussions during the early stages of this work. This paper also benefits of useful comments from A. Natta, M. Walmsley and from the referee R. Antonucci. This work was partially supported by the Italian Space Agency (ASI) under grant ARS-99-15 and by the Italian Ministry for University and Research (MURST) under grant Cofin98-02-32. We thank G. Ferland for making Cloudy available to the community.