in MCG -6-30-15 and Mrk 766
A&A 365, L140-L145 (2001)
G. Branduardi-Raymont1 - M. Sako2 - S. M. Kahn2 - A. C. Brinkman3 - J. S. Kaastra3 - M. J. Page1
Send offprint request: G. Branduardi-Raymont
1 - Mullard Space Science Laboratory, University College
London, Holmbury St. Mary, Dorking, Surrey,
RH5 6NT, UK
2 - Department of Physics and Columbia Astrophysics Laboratory,
Columbia University,
550 West 120th Street, New York, NY 10027, USA
3 - Space Research Organisation of The Netherlands,
Sorbonnelaan 2, 3584 CA Utrecht, The Netherlands
Received 2 October 2000 / Accepted 6 November 2000
Abstract
XMM-Newton Reflection Grating Spectrometer (RGS) spectra of
the Narrow Line Seyfert 1 galaxies MCG -6-30-15 and
Mrk 766 are physically
and spectroscopically inconsistent with standard models comprising a
power-law continuum absorbed by either cold or ionized matter. We propose
that the remarkably similar features detected in both objects in the 5-35 Å band are H-like oxygen, nitrogen, and carbon emission lines,
gravitationally redshifted and broadened by relativistic effects in the
vicinity of a Kerr black hole. We discuss the implications of our
interpretation, and demonstrate that the derived parameters can be
physically self-consistent.
Key words: black hole physics - accretion, accretion disks - line: formation - galaxies: individual: MCG -6-30-15 - galaxies: individual: Mrk 766 - X-rays: galaxies
The precise shape of the low energy spectra of active galaxies has traditionally been very difficult to establish. The combined effects of interstellar absorption, moderate spectral resolution of available detectors, and intrinsic complexity in the sources have so far prevented us from determining even whether the underlying spectrum is mainly due to continuum emission, or includes discrete emission and absorption components. The model generally adopted to match the observations is that of a continuum spectrum absorbed by partially ionized material (Halpern 1984; Reynolds 1997, and references therein); the origin and location of this warm absorber at the core of active galaxies, however, is still very much a matter of debate (e.g., Otani et al. 1996).
The enhancement in energy resolution and sensitivity afforded by the XMM-Newton Reflection Grating Spectrometer (RGS; den Herder et al. 2001) provides us with the potential to unravel the true origin of the soft X-ray emission in AGN for the first time. RGS observations of MCG -6-30-15 and Mrk 766, which are reported here, have forced us to examine alternatives to the warm absorber model, and to propose a new and radically different interpretation of the soft X-ray spectra of active galaxies.
MCG -6-30-15 and Mrk 766 (NGC 4253) are classified as Narrow Line Seyfert 1
(NLS1) galaxies on the basis of the widths of their Balmer lines (
![]() ), although they are not of the extreme kind. Both show
strong and rapid variability in their X-ray fluxes, as well as variability
in the slope of their power-law continua. MCG -6-30-15 is not known to
possess a ``soft excess'' (which is one of the dominant characteristics of
this class of objects), while Mrk 766 displays a soft excess that varies
less than the continuum at higher energies. Evidence for Compton reflection
has been found only in MCG -6-30-15. Broad features in the < 1 keV
spectra of both sources have been attributed to absorption in an ionized
interstellar medium at some distance from the central massive black hole.
The profile of the broad fluorescent Fe K
), although they are not of the extreme kind. Both show
strong and rapid variability in their X-ray fluxes, as well as variability
in the slope of their power-law continua. MCG -6-30-15 is not known to
possess a ``soft excess'' (which is one of the dominant characteristics of
this class of objects), while Mrk 766 displays a soft excess that varies
less than the continuum at higher energies. Evidence for Compton reflection
has been found only in MCG -6-30-15. Broad features in the < 1 keV
spectra of both sources have been attributed to absorption in an ionized
interstellar medium at some distance from the central massive black hole.
The profile of the broad fluorescent Fe K![]() line observed at 6-7 keV can be explained as due to the effects of relativistic motions and
gravitational redshift in a disk surrounding the central black hole (Tanaka
et al. 1995). MCG -6-30-15 and Mrk 766 are
bright (
line observed at 6-7 keV can be explained as due to the effects of relativistic motions and
gravitational redshift in a disk surrounding the central black hole (Tanaka
et al. 1995). MCG -6-30-15 and Mrk 766 are
bright (
![]() )
and nearby AGN (
)
and nearby AGN (
![]() and
and
![]() for
MCG -6-30-15 and
Mrk 766, respectively; redshifts based on optical emission line
measurements (Fisher et al. 1995; Smith et al.
1987), with
relatively low Galactic absorption along the lines of sight (
for
MCG -6-30-15 and
Mrk 766, respectively; redshifts based on optical emission line
measurements (Fisher et al. 1995; Smith et al.
1987), with
relatively low Galactic absorption along the lines of sight (
![]() and
and
![]() ,
respectively).
,
respectively).
MCG -6-30-15 was observed with XMM-Newton in July 2000 for a total of
120 ks; Mrk 766 in May 2000 for 55 ks. The RGS data were processed with the
XMM-Newton Science Analysis Software. Source and background events
were extracted by making spatial and order selections on the event files,
and were calibrated by applying the most up-to-date calibration parameters.
The current wavelength scale is accurate to ![]() mÅ. The instrumental
oxygen edge feature near
mÅ. The instrumental
oxygen edge feature near
![]() Å mentioned
in den Herder et al. (2001) was calibrated using
observations of a pure continuum source, PKS 2155-304.
Å mentioned
in den Herder et al. (2001) was calibrated using
observations of a pure continuum source, PKS 2155-304.
The raw extracted spectra are shown in Fig. 1. They are remarkably similar, in their overall shape and in the details, being dominated by prominent ``saw-tooth'' features, which peak at around 15, 18, 24 and 33 Å. A single power-law fit with neutral absorption is clearly an unacceptable representation of the observed spectra. In particular, the neutral oxygen edge at 23 Å implies a higher column density than can be accommodated by the fit to the continuum. In addition, the spectra do not show neutral absorption edges from the other elements at their expected positions.
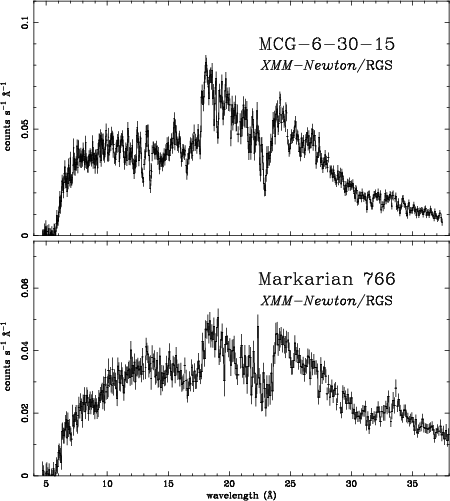 |
Figure 1: The raw RGS first order spectra of MCG -6-30-15 (top) and Mrk 766 (bottom), plotted in the observer's frame |
| Open with DEXTER | |
We attempted to fit the spectra with a warm absorber model which includes
the appropriate absorption edges and absorption lines associated with all
ions of abundant elements (C, N, O, Ne, Mg, and Fe). The absorption line
equivalent widths depend on the velocity profile, and we assume a turbulent
velocity, which is a free parameter for each charge state. The absorbing
column density of each charge state, as well as the neutral Galactic
column density, are also left free to vary. The fits
(shown in Fig. 2; best fit power-law slopes ![]() = 2.14 and 2.53 for
MCG -6-30-15 and Mrk 766 respectively)
are unacceptable for both objects, for a number of
reasons. Firstly, the observed, putative ``O VIII and O VII
edges'' are redshifted with respect to their expected positions (14.23 Å and 16.78 Å for O VIII and O VII, respectively), and
by very large amonts (
= 2.14 and 2.53 for
MCG -6-30-15 and Mrk 766 respectively)
are unacceptable for both objects, for a number of
reasons. Firstly, the observed, putative ``O VIII and O VII
edges'' are redshifted with respect to their expected positions (14.23 Å and 16.78 Å for O VIII and O VII, respectively), and
by very large amonts (![]() 1 Å), corresponding to infall
velocities on the order of
1 Å), corresponding to infall
velocities on the order of ![]() 16000 km s-1. However, the
absence of the associated absorption lines at the redshift implied by the
edges for these two charge states places an upper limit in the line
equivalent widths of
16000 km s-1. However, the
absence of the associated absorption lines at the redshift implied by the
edges for these two charge states places an upper limit in the line
equivalent widths of
![]() mÅ. For the derived column densities of
mÅ. For the derived column densities of
![]() and
and
![]() determined from the edges, these
absorption lines are in the saturated region of the curve of growth.
Therefore, the upper limit to the equivalent width implies a sensitive upper
limit to the velocity width of the infalling material, which is
determined from the edges, these
absorption lines are in the saturated region of the curve of growth.
Therefore, the upper limit to the equivalent width implies a sensitive upper
limit to the velocity width of the infalling material, which is
![]() for both objects. This is very difficult to reconcile with
the apparent redshifts. The radial inflow, in this case, would have to be
at one particular velocity. Re-emission following absorption is an unlikely
explanation for the absence of the absorption lines. If the surrounding
material is falling towards the nucleus, most of the material will be
re-emitting radiation at shorter wavelengths than that of the absorbed
resonance line, and we would expect to observe an inverted P Cygni profile,
which is definitely not seen in the data.
for both objects. This is very difficult to reconcile with
the apparent redshifts. The radial inflow, in this case, would have to be
at one particular velocity. Re-emission following absorption is an unlikely
explanation for the absence of the absorption lines. If the surrounding
material is falling towards the nucleus, most of the material will be
re-emitting radiation at shorter wavelengths than that of the absorbed
resonance line, and we would expect to observe an inverted P Cygni profile,
which is definitely not seen in the data.
The fits described above still require a significant neutral absorbing component in excess of the Galactic column density to these sources. In the case of Mrk 766, the neutral oxygen edge is again too high with respect to what is required to fit the data at longer wavelengths. An excess of flux is also present between 18 and 19 Å in MCG -6-30-15.
The physical and spectroscopic implausiblities described above force us to
examine alternative models to reproduce the observed RGS spectra.
Remarkably, we have been able to obtain acceptable fits to both the
MCG -6-30-15 and Mrk 766 data with a completely different model consisting
of an absorbed power-law and emission lines, which are gravitationally
redshifted and broadened by relativistic effects in a medium which is
encircling a massive, rotating black hole. In this interpretation, the
saw-toothed features in Fig. 1 are attributed to (in ascending wavelength
order) H-like Ly![]() lines of O VIII, N VII, and
C VI.
lines of O VIII, N VII, and
C VI.
Our model includes a power-law continuum, with cold absorption fixed at the
Galactic value, and three emission lines represented by profiles originating
near a maximally rotating Kerr black hole (Laor 1991). The line
wavelengths are fixed at their expected values in the observer's frame for
the redshifts of the sources. The continuum power-law slope (photon index
![]() )
is fitted, as are the disk inclination angle i, the emissivity
index q (i.e., the slope of the radial emissivity profile in the disk),
and the inner and outer limits
)
is fitted, as are the disk inclination angle i, the emissivity
index q (i.e., the slope of the radial emissivity profile in the disk),
and the inner and outer limits
![]() and
and
![]() of the disk
emission region. These parameters are tied for all the lines in the fit.
of the disk
emission region. These parameters are tied for all the lines in the fit.
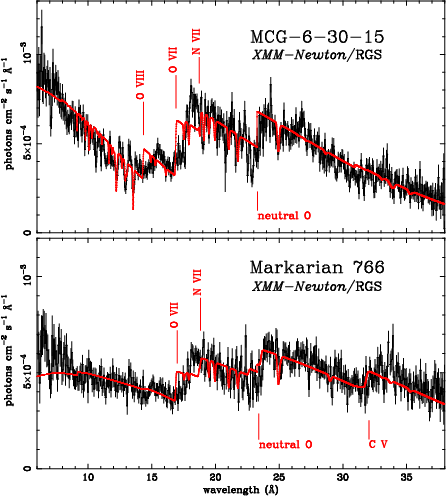 |
Figure 2: ``Fluxed'' spectra of the two sources (corrected for effective area) with the best-fit warm-absorber model, plotted in the observer's frame |
| Open with DEXTER | |
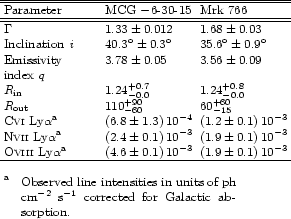
The best fit parameters are listed in Table 1; data and best fit
models are shown in Fig. 3 for both MCG -6-30-15 and
Mrk 766. The errors
quoted correspond to 90% confidence ranges for one interesting parameter.
The derived emissivity index of ![]() indicates that most of the line
emission originates from the inner part of the disk where gravitational
effects are the strongest. The outer emission radius is, therefore, not
well-constrained. For the same reason, disk emission line profiles produced
in a Schwarzschild metric (Fabian et al. 1989) do not provide an
acceptable fit to the data, since the last stable orbit, in this case, is
substantially larger than that in the Kerr metric.
indicates that most of the line
emission originates from the inner part of the disk where gravitational
effects are the strongest. The outer emission radius is, therefore, not
well-constrained. For the same reason, disk emission line profiles produced
in a Schwarzschild metric (Fabian et al. 1989) do not provide an
acceptable fit to the data, since the last stable orbit, in this case, is
substantially larger than that in the Kerr metric.
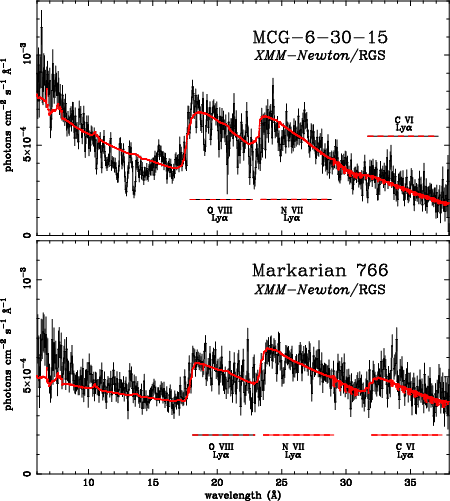 |
Figure 3: Same as in Fig. 2 with the relativistically broadened line model. The parameters are listed in Table 1 |
| Open with DEXTER | |
In our initial investigations of this model, we considered that the bump at
![]() 16 Å in the spectrum of MCG -6-30-15 could be O VIII
Ly
16 Å in the spectrum of MCG -6-30-15 could be O VIII
Ly![]() emission. However, we have concluded that this is unlikely,
and do not model
this feature as a relativistic O VIII Ly
emission. However, we have concluded that this is unlikely,
and do not model
this feature as a relativistic O VIII Ly![]() emission line for
reasons related to the physical self-consistency of our model.
These
reasons are explained in the following section, and an alternative
explanation for the
emission line for
reasons related to the physical self-consistency of our model.
These
reasons are explained in the following section, and an alternative
explanation for the ![]() 16 Å feature will be discussed.
16 Å feature will be discussed.
It is worth stressing again that both galaxies exhibit essentially an
identical spectral structure, with multiple broadened lines of H-like
oxygen, nitrogen, and carbon. The line energies are consistent with the
galaxies systemic velocities, and all lines are consistent with having the
same broad profiles. The fit residuals are also much less obvious and
systematic than for the warm absorber model. In addition, the disk line
parameters are consistent with those derived for the Fe K![]() line
(i = 34
line
(i = 34![]() -6+5 and 36
-6+5 and 36![]() -7+8,
-7+8,
![]() and
3.0
-0.4+0.8 for MCG -6-30-15 and Mrk 766 respectively,
Nandra et al. 1997). No additional column density to the
Galactic value is required by the fits. All of these factors, which are
consistent with each other to a degree that makes chance coincidences
unlikely, imply that the relativistic line model is the most probable
explanation for the present observations.
and
3.0
-0.4+0.8 for MCG -6-30-15 and Mrk 766 respectively,
Nandra et al. 1997). No additional column density to the
Galactic value is required by the fits. All of these factors, which are
consistent with each other to a degree that makes chance coincidences
unlikely, imply that the relativistic line model is the most probable
explanation for the present observations.
The models in Fig. 3 deliberately do not include narrow absorption
features, in order to emphasize the quality of the line emission fit. We
have re-fitted the spectra including, in addition to the three emission
lines, absorption components from carbon, nitrogen, oxygen, neon, and iron.
Lines from Ne IX-X, Fe XIX-XXI, O VII-VIII,
N VII, and C VI are detected in MCG -6-30-15, while only
oxygen, nitrogen, and carbon lines appear in Mrk 766. In contrast to the
pure warm absorber fit, the absorption lines profiles are well-reproduced by
the model with much lower ion column densities (
![]() )
and a higher velocity width (
)
and a higher velocity width (
![]() ). The observed line positions in MCG -6-30-15 are slightly
blueshifted from their rest wavelengths indicating outflow velocities of
). The observed line positions in MCG -6-30-15 are slightly
blueshifted from their rest wavelengths indicating outflow velocities of
![]() ,
while those in Mrk 766 are consistent with no net
velocity shift. With such low column densities, no edges are expected to be
detectable, as observed. The fits including these narrow lines are shown in
Fig. 4.
,
while those in Mrk 766 are consistent with no net
velocity shift. With such low column densities, no edges are expected to be
detectable, as observed. The fits including these narrow lines are shown in
Fig. 4.
The lack of Fe L and He-like K emission lines in the RGS spectra suggests
that the observed emission lines are most likely due to radiative
recombination onto fully stripped ions (oxygen is fully ionized for
![]() eV; Kallman & Krolik 1995). In addition to the Ly
eV; Kallman & Krolik 1995). In addition to the Ly![]() lines, one might expect to also see higher Lyman series as well as narrow
radiative recombination continua (RRC). The spectra are definitely not
consistent with the emission pattern expected when all of these additional
features are included at the theoretical fluxes relative to that of the
Ly
lines, one might expect to also see higher Lyman series as well as narrow
radiative recombination continua (RRC). The spectra are definitely not
consistent with the emission pattern expected when all of these additional
features are included at the theoretical fluxes relative to that of the
Ly![]() lines. However, as we describe below, the emitting plasma is
most likely optically thick to both the photoelectric continuum and to the
Lyman series themselves. We, therefore, adopt the measured Ly
lines. However, as we describe below, the emitting plasma is
most likely optically thick to both the photoelectric continuum and to the
Lyman series themselves. We, therefore, adopt the measured Ly![]() line
fluxes as discussed in the previous section to estimate the emission
measures of each of the ions.
line
fluxes as discussed in the previous section to estimate the emission
measures of each of the ions.
For a maximally rotating black hole with i
![]() and
and ![]() ,
most of the emitted flux is beamed away from the observer, and a
correction factor is applied to the isotropic luminosity. Adopting the
method of Cunningham (1975), we find
,
most of the emitted flux is beamed away from the observer, and a
correction factor is applied to the isotropic luminosity. Adopting the
method of Cunningham (1975), we find
![]() ,
where
,
where
![]() is the observed flux,
is the observed flux,
![]() is the emitted luminosity in the rest frame of the emitting
material, and D is the distance to the source. The derived ion emission
measures (
is the emitted luminosity in the rest frame of the emitting
material, and D is the distance to the source. The derived ion emission
measures (
![]() )
for H-like carbon,
nitrogen, and
oxygen are listed in Table 2, where we have used recombination
line powers as described in Liedahl & Paerels (1996).
)
for H-like carbon,
nitrogen, and
oxygen are listed in Table 2, where we have used recombination
line powers as described in Liedahl & Paerels (1996).
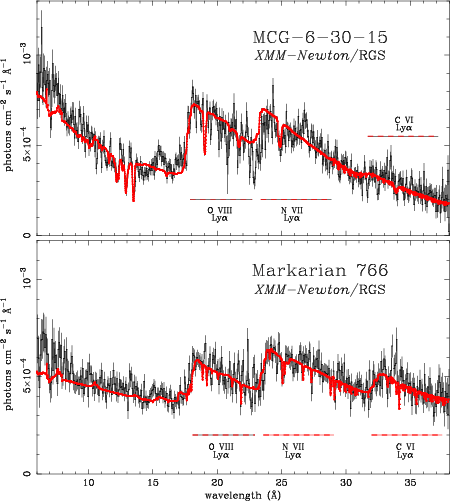 |
Figure 4: Same as in Fig. 3 with the narrow absorption components |
| Open with DEXTER | |
For a plasma in which the material is nearly fully stripped, the ratios of
the ion EMs provide the abundance ratios directly. The observed ratios
are
![]() and
and
![]() for
MCG -6-30-15, and
for
MCG -6-30-15, and
![]() and
and
![]() for
Mrk 766. These ratios are rather different (particularly for
Mrk 766) from
the solar values of
for
Mrk 766. These ratios are rather different (particularly for
Mrk 766) from
the solar values of
![]() and
and
![]() (Anders &
Grevesse 1989). However, the strength of the nitrogen absorption
lines in both MCG -6-30-15 and Mrk 766 suggests that nitrogen is
overabundant in the extended absorbing medium as well. Such anomalies have
also been inferred from UV observations of quasars (e.g., Hamann & Ferland
1992; Artymowicz et al. 1993, and
references therein).
(Anders &
Grevesse 1989). However, the strength of the nitrogen absorption
lines in both MCG -6-30-15 and Mrk 766 suggests that nitrogen is
overabundant in the extended absorbing medium as well. Such anomalies have
also been inferred from UV observations of quasars (e.g., Hamann & Ferland
1992; Artymowicz et al. 1993, and
references therein).
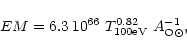
Using the derived parameters for MCG -6-30-15, we calculate the
abundance-corrected total emission measure (
![]() )
for
O VIII to be,
)
for
O VIII to be,
 |
(1) |
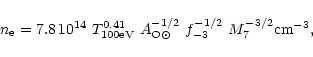
Assuming a disk-like geometry, we estimate the total emission measure to be
![]() ,
where R is the characteristic radius
and H is
the scale height of the emitting material. In the inner regions of a
relativistic accretion disk where the pressure is dominated by radiation,
the ratio of the scale height to the disk radius is on the order of
,
where R is the characteristic radius
and H is
the scale height of the emitting material. In the inner regions of a
relativistic accretion disk where the pressure is dominated by radiation,
the ratio of the scale height to the disk radius is on the order of
![]() (Kato et al. 1998). Assuming that the
characteristic emission radius is
(Kato et al. 1998). Assuming that the
characteristic emission radius is
![]() ,
where
,
where
![]() and M7 is the mass of the black hole in
multiples of
and M7 is the mass of the black hole in
multiples of
![]() ,
we can estimate the average electron density
to be,
,
we can estimate the average electron density
to be,
 |
(2) |
 |
(3) |
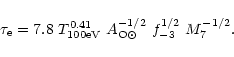
The moderate to high optical depth may present a potential problem. For
![]() ,
broadening of the spectral lines due to electron scattering
becomes comparable to the broadening from gravitational and relativistic
effects. If
,
broadening of the spectral lines due to electron scattering
becomes comparable to the broadening from gravitational and relativistic
effects. If
![]() ,
however, electron scattering produces a
negligible effect on the observed line profiles, and this situation is
possible if, for example, the emission region is much smaller than the scale
height of the accretion disk (i.e.,
,
however, electron scattering produces a
negligible effect on the observed line profiles, and this situation is
possible if, for example, the emission region is much smaller than the scale
height of the accretion disk (i.e.,
![]() ).
).
On the other hand, a medium in which
![]() is required to explain
the absence of the RRC and the higher Lyman series lines. With trace
abundances of the H-like species, the medium can be optically thick to its
own RRC. In this case, recombination to the ground state is suppressed and
most of the expected RRC flux is eventually radiated in the Ly
is required to explain
the absence of the RRC and the higher Lyman series lines. With trace
abundances of the H-like species, the medium can be optically thick to its
own RRC. In this case, recombination to the ground state is suppressed and
most of the expected RRC flux is eventually radiated in the Ly![]() line.
It only takes an optical depth of order a few at the photoelectric edge in
order to achieve this. In O VIII, the threshold optical depth in the K
edge is
line.
It only takes an optical depth of order a few at the photoelectric edge in
order to achieve this. In O VIII, the threshold optical depth in the K
edge is
![]() ,
where
,
where
![]() is the fractional ion abundance of
O VIII. Therefore, even a small trace abundance of O VIII can
almost completely suppress the RRC. Moreover, since the medium is optically
thick to photoelectric absorption, it is very optically thick to line
absorption as well. The higher series Lyman lines (Ly
is the fractional ion abundance of
O VIII. Therefore, even a small trace abundance of O VIII can
almost completely suppress the RRC. Moreover, since the medium is optically
thick to photoelectric absorption, it is very optically thick to line
absorption as well. The higher series Lyman lines (Ly![]() and higher)
are also destroyed by a mechanism similar to the one responsible for
suppressing the RRC, since the upper levels can decay through channels other
than to the ground level. The Ly
and higher)
are also destroyed by a mechanism similar to the one responsible for
suppressing the RRC, since the upper levels can decay through channels other
than to the ground level. The Ly![]() line, on the other hand, can decay
only to the ground level and, therefore, is not destroyed.
line, on the other hand, can decay
only to the ground level and, therefore, is not destroyed.
Since the Ne X and Ne IX emission line wavelengths are close
to but shorter than that of the O VIII edge, most of these line
photons are probably also absorbed by O VIII, which subsequently are
pumped into the O VIII Ly![]() line. The O VIII Ly
line. The O VIII Ly![]() line wavelength is longer than that of the N VII edge, and is not
affected by this opacity effect. However, the N VII Ly
line wavelength is longer than that of the N VII edge, and is not
affected by this opacity effect. However, the N VII Ly![]() line
is just on the short wavelength side of the C VI edge, and might be
somewhat affected.
line
is just on the short wavelength side of the C VI edge, and might be
somewhat affected.
A medium with
![]() is also an efficient reflector, which suggests
that a large fraction of the illuminating continuum radiation is also
reflected into our line of sight. With trace elements of H-like oxygen, for
example, the reflected spectrum should contain an absorption edge feature
that is also distorted by strong relativistic effects. Therefore, the
residual feature near
is also an efficient reflector, which suggests
that a large fraction of the illuminating continuum radiation is also
reflected into our line of sight. With trace elements of H-like oxygen, for
example, the reflected spectrum should contain an absorption edge feature
that is also distorted by strong relativistic effects. Therefore, the
residual feature near
![]() Å in
MCG -6-30-15, may be
identified as an O VIII edge, analogous to the iron K edge absorption
feature produced in reflection from a cold medium. The precise
characterization of these opacity effects, however, requires a detailed
radiative transfer calculation with self-consistent photoionization models,
which is beyond the scope of this Letter.
Å in
MCG -6-30-15, may be
identified as an O VIII edge, analogous to the iron K edge absorption
feature produced in reflection from a cold medium. The precise
characterization of these opacity effects, however, requires a detailed
radiative transfer calculation with self-consistent photoionization models,
which is beyond the scope of this Letter.
To check for consistency in the parameters derived above, we compute the
upper limit for the average ionization parameter of the plasma to be,
 |
(4) |
The same calculations have been applied to Mrk 766, with the following
results:
 |
(5) |
 |
(6) |
 |
(7) |
The observed RGS spectra require a flattening of the underlying continuum
radiation in both MCG -6-30-15 and Mrk 766 below ![]() 2.5 keV. A
preliminary spectral analysis of the EPIC PN data of
MCG -6-30-15 shows that
a power-law slope of
2.5 keV. A
preliminary spectral analysis of the EPIC PN data of
MCG -6-30-15 shows that
a power-law slope of
![]() can reproduce the 1-2 keV
spectrum, with substantial excess soft emission below
can reproduce the 1-2 keV
spectrum, with substantial excess soft emission below ![]() 1 keV. A
simple extension of the PN 3-10 keV continuum (power-law slope
1 keV. A
simple extension of the PN 3-10 keV continuum (power-law slope
![]() = 1.97
-0.03+0.02) down to lower energies also
requires excess emission below
= 1.97
-0.03+0.02) down to lower energies also
requires excess emission below ![]() 1 keV. Most of the observed soft
X-ray flux, however, is in the form of C, N, and O emission lines. If the
hard X-ray continuum radiation is produced through inverse Compton
scattering primarily of these line photons, the apparent break in the photon
index may be a natural consequence (Sunyaev & Titarchuk 1980).
1 keV. Most of the observed soft
X-ray flux, however, is in the form of C, N, and O emission lines. If the
hard X-ray continuum radiation is produced through inverse Compton
scattering primarily of these line photons, the apparent break in the photon
index may be a natural consequence (Sunyaev & Titarchuk 1980).
Clearly the results we present here and their interpretation in terms of line emission from a relativistic disk call for a complete re-assessment of the processes leading to the production of high energy radiation in the cores of active galaxies. Such a study will have to account for the flattening of the hard X-ray continuum towards low energies as well as the detailed line-formation processes in the inner regions of the accretion disk.
We have shown that a simple warm-absorber interpretation of the RGS spectra of MCG -6-30-15 and Mrk 766 is untenable on spectroscopic grounds. Broad line emission from a relativistic disk surrounding a maximally rotating Kerr black hole seems to explain the data remarkably well. The physical self-consistency of this scenario remains to be established, however, the preliminary analysis presented in Sect. 4 is encouraging. Note that the conclusions we draw do not depend on any pre-conceived assumption about the shape of the ionizing continuum.
This result could not have been achieved without the combination of large effective area and high energy resolution afforded by the XMM-Newton RGS. The poorer resolution of CCD spectrometers cannot provide discriminatory power for the warm absorber versus line emission debate raised by the RGS results presented in this paper. A more robust test will be finding the same problems and applying the same solution to other AGN sources.
Acknowledgements
The authors would like to thank Duane Liedahl for kindly providing the atomic calculations. The Mullard Space Science Laboratory acknowledges financial support from the UK Particle Physics and Astronomy Research Council. The Columbia University team is supported by NASA. The Laboratory for Space Research Utrecht is supported financially by the Netherlands Organization for Scientific Research (NWO).
![\begin{table}
\begin{displaymath}
\begin{array}{p{0.32\linewidth}ll}
\hline
I...
...{a}}$ ] Ion $EM$ s in units of $10^{63} ~\rm {cm}^{-3}$ .
\end{list} \end{table}](/articles/aa/full/2001/01/aaxmm20/img35.gif)