Fig. 6
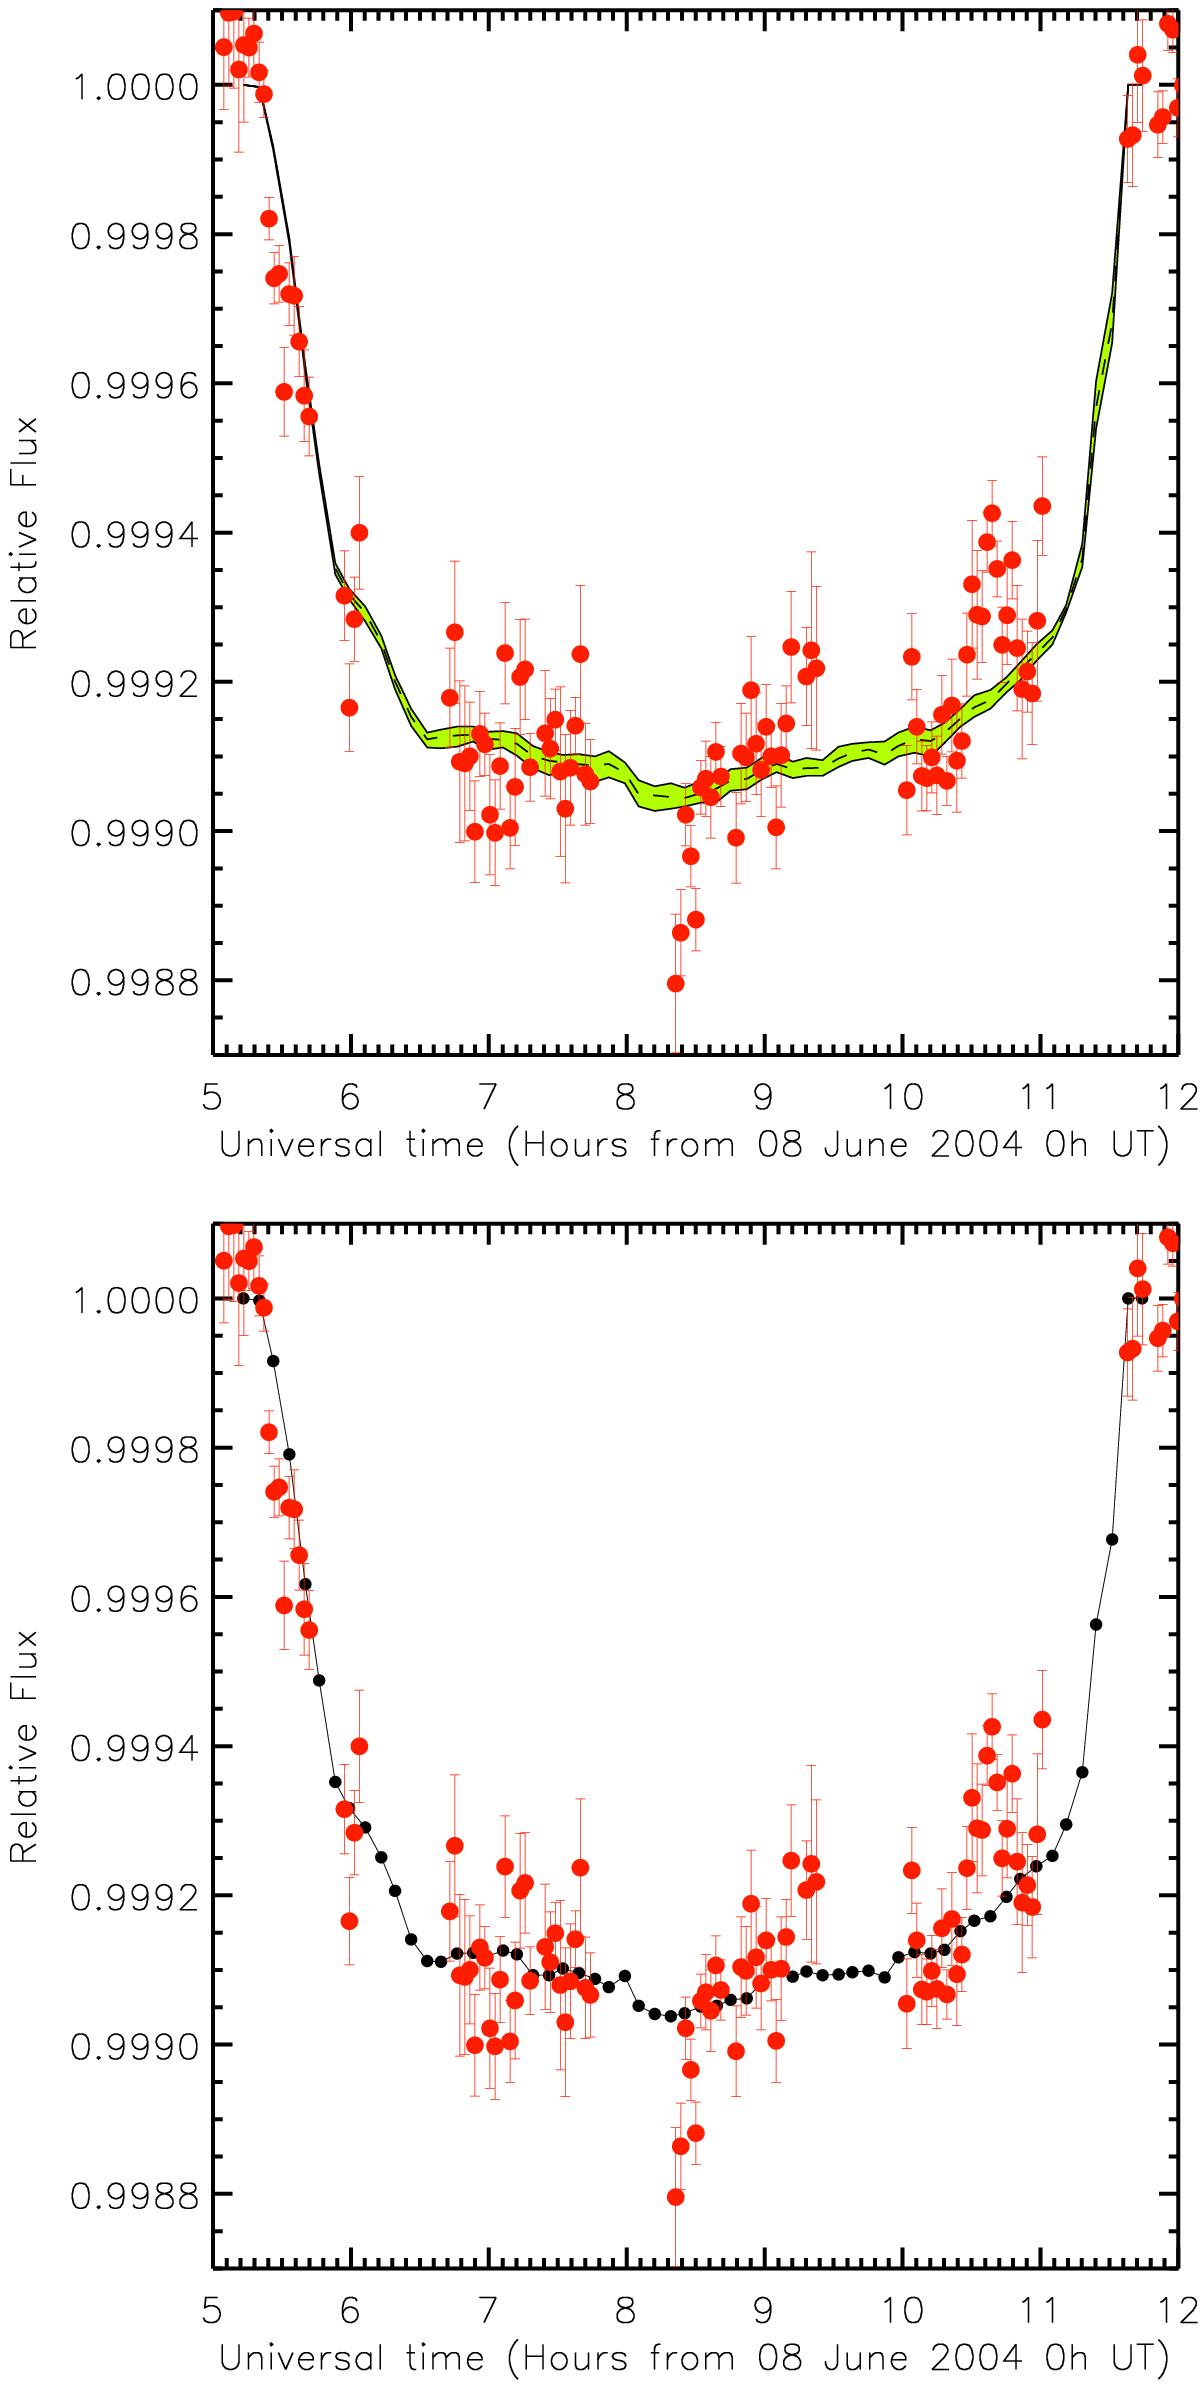
Top panel: ToV 2004 light curve (black dashed line) for the 3D RHD simulation of the Sun (Fig. 5) compared to the photometric observations (red dots with error bars, Schneider et al. 2006) taken with ACRIM 3 mounted on ACRIMSAT. The observations have been normalized to 1, dividing the original data (Fig. 3 of Schneider et al. 2006) by 1365.88 W/m2. The light curve has been averaged (with the green shade denoting highest and lowest values) over 50 different synthetic solar-disk images to account for granulation changes with respect to time. Bottom panel: same as above, but for one particular realization among the 50 synthetic solar-disk images.


Current usage metrics show cumulative count of Article Views (full-text article views including HTML views, PDF and ePub downloads, according to the available data) and Abstracts Views on Vision4Press platform.
Data correspond to usage on the plateform after 2015. The current usage metrics is available 48-96 hours after online publication and is updated daily on week days.
Initial download of the metrics may take a while.