Fig. 8
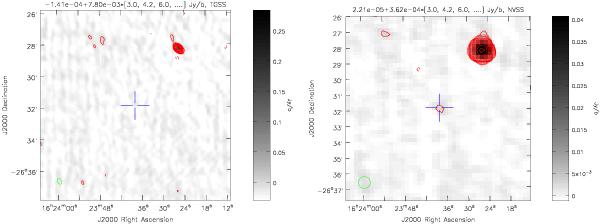
TGSS (left panel) and NVSS images (right panel) of the PSR B1620-26 field at 150 MHz and 1.4 GHz. The green ellipse in the lower-left corner (of these images and other images presented in this paper) shows the half power beamwidth (~20′′for TGSS). The contour levels given at the top of the image (and other images presented in this paper) are in units of Jy beam-1 and are defined as mean+rms × (n), where n is given inside the brackets in the top label. Negative contours appear as dashed lines. The host star position is given by the blue cross. Here in the NVSS image the contour of the emission is well centered on that position.


Current usage metrics show cumulative count of Article Views (full-text article views including HTML views, PDF and ePub downloads, according to the available data) and Abstracts Views on Vision4Press platform.
Data correspond to usage on the plateform after 2015. The current usage metrics is available 48-96 hours after online publication and is updated daily on week days.
Initial download of the metrics may take a while.