Fig. 2
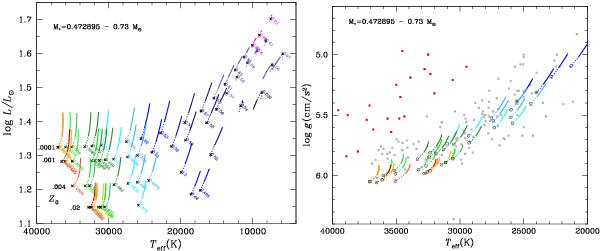
HR diagram (left) for all calculated models with a mixed mass ~10-7 M⊙. Each segment represents the evolution of one model whose mass is color-coded using a simple formula. The metallicity (Z0) of each series of models is indicated at the left of the sequence. The dotted part represents the first 10 Myr of HB evolution, while the solid line represents the rest of the calculated HB evolution, ususally an additional 27 Myr. In the right panel, g vs. Teff diagram of a subset of the calculations (those with Teff > 20 000 K) corresponding to the observations of Geier et al. 2010. This panel contains data (gray and red dots as defined in the text) from their Fig. 2.


Current usage metrics show cumulative count of Article Views (full-text article views including HTML views, PDF and ePub downloads, according to the available data) and Abstracts Views on Vision4Press platform.
Data correspond to usage on the plateform after 2015. The current usage metrics is available 48-96 hours after online publication and is updated daily on week days.
Initial download of the metrics may take a while.