A&A 367, 253-265 (2001)
DOI: 10.1051/0004-6361:20000477
S. Feltzing 1 - G. Gonzalez2
1 - Lund Observatory, Box 43, 221 00 Lund, Sweden
2 - Astronomy Department, University of Washington, PO Box
351580, Seattle, WA 98195, USA
Received 24 May 2000 / Accepted 17 November 2000
Abstract
We provide detailed abundance analyses of 8 candidate super-metal-rich
stars. Five of them are confirmed to have
![]() dex, the generally-accepted limit for super-metal-richness.
Furthermore, we derive abundances of several elements and find that the
stars
follow trends seen in previous studies of metal-rich stars.
Ages are estimated from isochrones and velocities calculated.
We find that there do exist very metal-rich stars that are older than 10
Gyr. This is contrary to what is found in several recent studies of the
galactic age-metallicity relation. This is tentative evidence that there
might not exist a one-to-one relation between age and metallicity for
all stars. This is not surprising considering the current models of the
independent evolution of the different galactic components.
We also find that one star, HD 182572, could
with
dex, the generally-accepted limit for super-metal-richness.
Furthermore, we derive abundances of several elements and find that the
stars
follow trends seen in previous studies of metal-rich stars.
Ages are estimated from isochrones and velocities calculated.
We find that there do exist very metal-rich stars that are older than 10
Gyr. This is contrary to what is found in several recent studies of the
galactic age-metallicity relation. This is tentative evidence that there
might not exist a one-to-one relation between age and metallicity for
all stars. This is not surprising considering the current models of the
independent evolution of the different galactic components.
We also find that one star, HD 182572, could
with ![]() 75% chance be a thick disk star with, for the thick disk,
an extremely high metallicity at 0.34 dex. This star is, intriguingly,
also somewhat enhanced in the
75% chance be a thick disk star with, for the thick disk,
an extremely high metallicity at 0.34 dex. This star is, intriguingly,
also somewhat enhanced in the ![]() -elements.
-elements.
Key words: stars: abundances, fundamental parameters, late-type, individual HD 10780, HD 32147, HD 99491, HD 104304, HD 121370, HD 145675, HD 196755, HD 182572 - Galaxy: solar neighbourhood
The very metal-rich dwarf stars in the solar neighbourhood have
historically not attracted as much attention as the more metal-poor
(solar like and halo stars) stars which tell us about the early
phases of the chemical evolution of our galaxy. The properties of
metal-rich stars are important when we try to interpret integrated
spectra from metal-rich stellar populations, such as the Bulge and
giant elliptical galaxies. A small group of so called super-metal-rich
(SMR) stars have played a significant role in shaping the conceptions of
such populations. Famous examples are the dwarf HD 32147 (HR 1614) and
the giant ![]() Leonis. In the review by Taylor (1996) - the latest
paper in a long series started in the 1960s - SMR stars are discussed
in great detail, in particular, the reality of extremely high
[Fe/H]. Taylor found that no giant star fulfills the criteria for
SMR-ness that he sets and only a handful of dwarf stars do, and that most
of them are candidates rather than firm members in this class.
Leonis. In the review by Taylor (1996) - the latest
paper in a long series started in the 1960s - SMR stars are discussed
in great detail, in particular, the reality of extremely high
[Fe/H]. Taylor found that no giant star fulfills the criteria for
SMR-ness that he sets and only a handful of dwarf stars do, and that most
of them are candidates rather than firm members in this class. ![]() Leonis has, however, been studied by several groups using
high-resolution spectroscopy, a recent example being Smith & Ruck
(2000), who find that the star is indeed super-metal-rich with
Leonis has, however, been studied by several groups using
high-resolution spectroscopy, a recent example being Smith & Ruck
(2000), who find that the star is indeed super-metal-rich with
![]() .
Thus, the question of the reality of
super-metal-rich giants is still very much
alive and each case has to be judged on its own.
.
Thus, the question of the reality of
super-metal-rich giants is still very much
alive and each case has to be judged on its own.
The exact definition of super-metallicity has, as reviewed by Taylor (1996),
varied. Spinrad & Taylor (1969) adopted +0.2 dex as
the lower limit, based on the overall metallicity of the Hyades,
which they found to be +0.2 dex. The metallicity for the Hyades has
recently been revised (Taylor 1994; Cayrel de Strobel 1997) to
+0.1 dex. Even values as low as 0.0 dex have been quoted. This has
resulted in classes of stars that sometimes are regarded as SMR and sometimes
not. Taylor rectified this unsatisfactory situation by
adopting the original +0.2 dex as the threshold on the grounds that
no giant stars had been shown to have a metallicity higher than this
value (but see Castro et al. 1997; Smith & Ruck 2000). Taylor (1996)
defines a star to be SMR if it has
![]() with 95% confidence.
He
also adopts [Fe/H], i.e. the iron abundance, as the measure of
"metallicity'' rather than the more general [Me/H]. As an aside one
may note that a second terminology is also in use - Very Strong-Lined
(VSL) star. This term implies just that the star has strong lines and
might therefore be a SMR candidate. This is a particularly useful
term when working with low resolution spectra.
with 95% confidence.
He
also adopts [Fe/H], i.e. the iron abundance, as the measure of
"metallicity'' rather than the more general [Me/H]. As an aside one
may note that a second terminology is also in use - Very Strong-Lined
(VSL) star. This term implies just that the star has strong lines and
might therefore be a SMR candidate. This is a particularly useful
term when working with low resolution spectra.
SMR stars have attracted more attention recently due to their possible connection with extra-solar planets, e.g. Gonzalez (2000 and references cited therein), Fuhrmann et al. (1997, 1998). Gonzalez (2000) has shown that the solar-type parent stars of extra-solar planets are more metal-rich on average compared to the general field star population. In particular, the very short period systems are either above the SMR limit or near it. By comparing them to the SMR stars we may gain insight as to the relationship between planets in short-period orbits and the SMR-ness of the parent star.
A few other recent studies have targeted known SMR candidates
and stars with high [Me/H] (as derived from
photometry): Feltzing & Gustafsson (1998); Castro et al. (1997); and
McWilliam & Rich (1994). In general the abundance
ratios seem to continue the trends of the disk population. However,
no detailed theoretical predictions for Galactic chemical evolution
exists for
![]() dex, so the interpretation of the observed
abundance trends for metal-rich stars is still pending.
dex, so the interpretation of the observed
abundance trends for metal-rich stars is still pending.
The combination of abundance ratios with kinematical data may give us
additional clues. For example, we can study stars on highly eccentric
orbits which trace the evolution in the Galactic disk closer to the
Galactic centre. Not much is known about these stars, but there are
some very intriguing observations: Barbuy & Grenon (1990) found that
dwarf stars on very eccentric orbits contained much more oxygen than
what was expected from standard models of Galactic chemical evolution
of the disk, and Edvardsson et al. (1993) found large spreads and
"upturns'' for certain elements, Na, Si, Ti, Al, for stars with
![]() dex. The trends for Na, Si and Ti were
confirmed up to
dex. The trends for Na, Si and Ti were
confirmed up to ![]() 0.4 dex by Feltzing & Gustafsson (1998). They
concluded that the "upturn'' in Na abundances relative to Fe is not
due to a mixture of stars born at different distances from the
Galactic centre.
0.4 dex by Feltzing & Gustafsson (1998). They
concluded that the "upturn'' in Na abundances relative to Fe is not
due to a mixture of stars born at different distances from the
Galactic centre.
In this paper we investigate, by means of detailed spectroscopic analyses, the metallicities as well as the abundance of several elements for 8 dwarf stars selected from the meticulous review of SMR candidates by Taylor (1996).
The paper is organized as follows: in Sects. 2 and 3 we detail the observations and the selection of program stars, as well as reductions and measurements; Sect. 4 discusses the detailed abundance analysis, Sect. 5 presents the abundances element by element, in Sect. 6 we derive ages for the stars and discuss the age-metallicity relation in the solar neighbourhood, Sect. 7 discusses the kinematics of the stars in our sample and which galactic component they belong to, Sect. 8 provides a short discussion of the SMR-planet connection and, finally, Sect. 9 summarizes our findings.
Stars observable from the Northern Hemisphere were selected from
Taylor's 1996 list of candidate SMR dwarf and subgiant stars. Spectra
were obtained with the Sandiford cassegrain echelle spectrograph
(McCarthy et al. 1993) attached to the 2.1 m Struve telescope at
McDonald Observatory during three runs: 1996 June, 1996 August and
1996 December. Exposure times were typically 5 min each,
resulting in signal-to-noise (S/N) ratios per pixel averaging near
250. A spectrum of a Th-Ar lamp was obtained following each star
spectrum, ensuring accurate wavelength calibration. The resolving
power (measured on the Th-Ar emission line spectra) averages near
![]() .
.
![\begin{figure}
\par\includegraphics[width=8.3cm,clip]{H2231.1.ps}\end{figure}](/articles/aa/full/2001/07/aah2231/img21.gif) |
Figure 1:
Comparison of measurements of
|
| Open with DEXTER | |
The spectra were reduced with the standard software available within the
CCDRED and ECHELLE packages of NOAO IRAF![]() . The steps included
bias subtraction, flat fielding, extraction of one-dimensional spectra,
wavelength calibration, and continuum normalization. Additional details
concerning the quality of the data resulting from the Sandiford
spectrograph
can be found in Gonzalez & Lambert (1996) and Gonzalez (1998).
. The steps included
bias subtraction, flat fielding, extraction of one-dimensional spectra,
wavelength calibration, and continuum normalization. Additional details
concerning the quality of the data resulting from the Sandiford
spectrograph
can be found in Gonzalez & Lambert (1996) and Gonzalez (1998).
Equivalent widths (
![]() )
were measured using the SPLOT
task in IRAF. The lines were measured both by simply integrating
the line and also by fitting a Gaussian to the line profile. Most lines
were measured twice and some up to four times due to overlap of the
spectral orders. As the final adopted value of
)
were measured using the SPLOT
task in IRAF. The lines were measured both by simply integrating
the line and also by fitting a Gaussian to the line profile. Most lines
were measured twice and some up to four times due to overlap of the
spectral orders. As the final adopted value of
![]() we used
the mean of the measurements. In these cases the measurement errors are
typically
no more than a few percent.
we used
the mean of the measurements. In these cases the measurement errors are
typically
no more than a few percent.
In Fig. 1 we compare the measured values of
![]() for HD 32147 and HD 182572 with those measured by Feltzing &
Gustafsson (1998). For HD 182572 the agreement
is good, while for HD 32147, our coolest star, we measure significantly
larger
for HD 32147 and HD 182572 with those measured by Feltzing &
Gustafsson (1998). For HD 182572 the agreement
is good, while for HD 32147, our coolest star, we measure significantly
larger
![]() .
This difference is most likely due to the
lower resolution used in this work. See also the two examples of
stellar spectra shown in Fig. 3 from which it is clear
that HD 32147, but also to some extent HD 145675, shows a much
richer spectrum than the other stars. Since these stars are cool, there
will naturally be more molecular lines and low-excitation atomic lines
that will cause blending problems.
.
This difference is most likely due to the
lower resolution used in this work. See also the two examples of
stellar spectra shown in Fig. 3 from which it is clear
that HD 32147, but also to some extent HD 145675, shows a much
richer spectrum than the other stars. Since these stars are cool, there
will naturally be more molecular lines and low-excitation atomic lines
that will cause blending problems.
We have performed a standard Local Thermodynamic Equilibrium (LTE)
analysis, strictly differential with respect to the Sun, to derive
chemical
abundances from the measured values of
![]() .
Spectrum
synthesis was not employed in the present study.
.
Spectrum
synthesis was not employed in the present study.
To generate the model atmospheres we used the MARCS program, first described by Gustafsson et al. (1975). The program has been further developed and updated in order to handle the line blanketing of millions of absorption lines more accurately (Asplund et al. 1997). The following assumptions enter into the calculation of the models: the atmosphere is assumed to be plane-parallel and in hydrostatic equilibrium, the total flux (including mixing-length convection) is constant, the source function is described by the Planck function at the local temperature with a scattering term, the populations of different excitation levels and ionization stages are governed by LTE.
Since our analysis is strictly differential relative to the Sun, we have used a solar model atmosphere calculated with the same program as the stellar models - this in order to keep the analysis truly differential and thus in spite of the fact that the empirically derived Holweger-Müller model better reproduces the solar observed limb darkening (Blackwell et al. 1995).
| |
Figure 2:
Comparison of |
| Open with DEXTER | |
Since we did not have observations of the solar spectrum for all of
the lines available in the stellar spectra, we measured solar line
strengths in
the Kurucz et al. (1984) Solar Flux Atlas. The spectrum from the
Flux Atlas was first degraded by binnning and then convolved with a
Gaussian profile to match the instrumental profile. To decide on the exact
values of the convolution, we used three portions of a spectrum of
reflected sunlight from Vesta. The Flux Atlas spectrum was convolved
and then compared with the Vesta spectrum. The goodness of the fit was
decided upon by inspection. The values of
![]() for all our lines
were measured in the degraded spectrum. They were then used to determine
the astrophysical
for all our lines
were measured in the degraded spectrum. They were then used to determine
the astrophysical ![]() values, Table 1.
values, Table 1.
We consider different line broadening mechanisms in our calculations; van der Waals damping, radiation damping, thermal Doppler broadening and broadening by microturbulence. The van der Waals broadening is calculated with the classical Unsöld formula. Enhancement factors to this value were compiled from the literature and are given in Table 1. For Fe we use values from Hannaford et al. (1992) and Holweger et al. (1991), for Ca, and for V from Neuforge (1992). For the remaining lines we use a value of 2.5, according to Mäckle et al. (1975). The values used for the enhancement factor do not, in general, influence the results, e.g. a change from 2.5 to 1.4 does not alter most abundances by more than 0.01 dex.
We have also compared our ![]() -values derived from the solar spectrum
with those derived in a similar way, but using a Holweger-Müller solar
model, by Neuforge-Verheecke & Magain (1997), Fig. 2.
Our
-values derived from the solar spectrum
with those derived in a similar way, but using a Holweger-Müller solar
model, by Neuforge-Verheecke & Magain (1997), Fig. 2.
Our ![]() -values are 0.07 dex lower for Fe I lines and
0.04 dex lower for the Ni I lines than those derived
by Neuforge-Verheecke
& Magain (1997). Considering the different approaches to the
derivation of the astrophysical
-values are 0.07 dex lower for Fe I lines and
0.04 dex lower for the Ni I lines than those derived
by Neuforge-Verheecke
& Magain (1997). Considering the different approaches to the
derivation of the astrophysical ![]() -values we consider the
agreement good. It is also reassuring that no trends are found
either with wavelength or excitation potential, see Fig. 2.
-values we consider the
agreement good. It is also reassuring that no trends are found
either with wavelength or excitation potential, see Fig. 2.
Selecting stellar lines which are free from blends is crucial for deriving accurate elemental abundances. To account for telluric lines we simply over-plotted each stellar spectrum with a spectrum of a hot star observed during the same night as the stellar spectrum was taken and discarded lines that were contaminated. To avoid blends from unidentified photospheric lines the solar spectrum was carefully inspected and the line-list by Moore consulted.
Care in the selection of lines is also of importance for the
determination of surface gravities by means of ionization equilibrium
(i.e., abundances derived from Fe I and Fe II lines give
the same iron abundance). We have inspected the shape of the Fe
II lines in all the stars when a line is observed in more than two
stars. This inspection led us to discard the lines at 6386.72 and
7449.33 Å, Fig. 3.
A line at 5823.15 Å was also discarded, although
only measured in two stars, since it gave anomalously high iron
abundances and clearly suffered from blends. The line at 6416.91 Å
gave rather high iron abundances in HD 10780, HD 32147 and
HD 145675. From our spectra we could not, however, conclude that this
line is compromised by a blend (see Fig. 3) and it was
therefore kept in the analysis, but only in those stars where it did
not diverge significantly. Our final selection of lines, as well as
the parameters used in the abundance analysis, are given in Table
1.
![\begin{figure}
\par\includegraphics[width=8cm,clip]{H2231.3.ps}\includegraphics[width=8cm,clip]{H2231.4.ps}\end{figure}](/articles/aa/full/2001/07/aah2231/img24.gif) |
Figure 3: Two portions of the stellar spectra, showing the regions around the two Fe II lines at 6416.91 and 6432.68 Å. The spectra have been arbitrarily displaced in intensity and also along the x-axis to the laboratory wavelengths. The positions of the Fe II lines are marked with dotted lines. Note the different scales on the x-axes |
| Open with DEXTER | |
In order to construct the stellar model atmospheres we need the effective temperature, surface gravity, metallicity and microturbulence for each star. These were all derived from the stellar spectra themselves.
| Sp.T. | V | B-V |
|
|
log g | [Fe/H] |
|
|||
| mas | km s |
|||||||||
| HD 10780 | HR 511 | K0V | 5.63 | 0.804 | 100.24 | 0.68(0.007) | 5300 | 4.13 | -0.02 | 1.00 |
| HD 32147 | HR 1614 | K3V | 6.22 | 1.049 | 113.46 | 0.82(0.007) | 4680 | 4.00 | 0.28 | 0.50 |
| HD 99491 | HR 4414A | K0IV | 6.49 | 0.778 | 56.59 | 1.40(0.025) | 5300 | 4.12 | 0.20 | 1.00 |
| HD 104304 | HR 4587 | G9IV | 5.54 | 0.760 | 77.48 | 0.80(0.01) | 5400 | 4.12 | 0.16 | 1.15 |
| HD 121370 | HR 5235 | G0IV | 2.68 | 0.580 | 88.71 | 0.75(0.008) | 6000 | 3.66 | 0.25 | 2.00 |
| HD 145675 | K0V | 6.61 | 0.877 | 55.11 | 0.59(0.011) | 5300 | 4.50 | 0.47 | 1.00 | |
| HD 182572 | HR 7373 | G8IV | 5.17 | 0.761 | 66.01 | 0.77(0.012) | 5400 | 4.00 | 0.35 | 1.10 |
| HD 196755 | HR 7896 | G5IV+ | 5.07 | 0.702 | 33.27 | 0.82(0.02) | 5700 | 4.00 | 0.02 | 1.50 |
| 5830 | 4.34 | 0.24 | 1.09 | |||||||
| 5225 | 4.51 | 0.23 | 1.00 | |||||||
| 1.
|
||||||||||
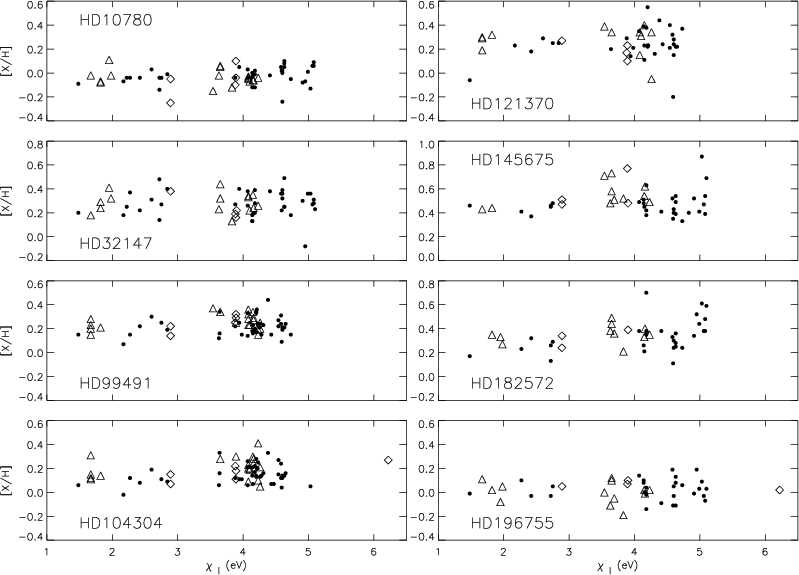 |
Figure 4:
Excitation equilibrium. Fe I lines are denoted by
|
| Open with DEXTER | |
We started with
![]() kms-1 and, after inspecting plots of [Fe/H]
and [Ni/H] as a functions of
kms-1 and, after inspecting plots of [Fe/H]
and [Ni/H] as a functions of
![]() (reduced
equivalent width), varied the value of
(reduced
equivalent width), varied the value of
![]() until all lines, weak
and strong, yielded the same abundance. The final values used in the
abundance analysis are given in Table 1.
until all lines, weak
and strong, yielded the same abundance. The final values used in the
abundance analysis are given in Table 1.
As a further check of our final stellar parameters we have derived
![]() ,
,
![]() ,
and [Fe/H] from the self-consistent
calibration of
,
and [Fe/H] from the self-consistent
calibration of
![]() ,
,
![]() and [Fe/H] by Olsen (1984),
Table 2. The agreement is in general good.
and [Fe/H] by Olsen (1984),
Table 2. The agreement is in general good.
The stars in our study have been included in few, if any, abundance
studies. However, HD 32147 and HD 182572 have been extensively
studied. HD 32147 has been especially difficult to analyze, because
it is a cool K dwarf star with strong lines. This is amply exemplified
by the comparison of our
![]() measurements and abundances
with those of Feltzing & Gustafsson (1998). In Table 3 we
compare our results to theirs. As expected (from the comparison of
measurements and abundances
with those of Feltzing & Gustafsson (1998). In Table 3 we
compare our results to theirs. As expected (from the comparison of
![]() )
the abundances for HD 32147 are larger in our study
than in theirs. In this work we impose ionization equilibrium in
order to derive the surface gravity of the star. This affects in
particular the abundances derived from HD 32147, but also some of the
species, i.e. Fe, Co and Ni, for HD 182572. For a discussion of stellar
abundances in K dwarf stars, that for HD 32147 supersedes the current
analysis, we refer the reader to Thorén & Feltzing (2000).
)
the abundances for HD 32147 are larger in our study
than in theirs. In this work we impose ionization equilibrium in
order to derive the surface gravity of the star. This affects in
particular the abundances derived from HD 32147, but also some of the
species, i.e. Fe, Co and Ni, for HD 182572. For a discussion of stellar
abundances in K dwarf stars, that for HD 32147 supersedes the current
analysis, we refer the reader to Thorén & Feltzing (2000).
| ID | b-y | m1 | c1 | ref. | Olsen (1984) | ||
|
|
|||||||
| HD 10780 | 0.468 | 0.316 | 0.327 | O93 | 5431 | 4.27 | |
| HD 32147 | 0.601 | 0.634 | 0.236 | O94a | 4614 | 4.57 | |
| HD 99491 | 0.484 | 0.335 | 0.362 | O93 | 5347 | 4.12 | |
| HD 104304 | 0.469 | 0.313 | 0.345 | O94a | 5437 | 4.19 | |
| HD 121370 | 0.370 | 0.202 | 0.533 | GO | 6205 | 3.92 | |
| HD 145675 | 0.537 | 0.336 | 0.438 | O93 | 4852 | 4.55 | |
| HD 182572 | 0.465 | 0.299 | 0.381 | O93 | 5495 | 4.07 | |
| HD 196755 | 0.432 | 0.220 | 0.381 | O94b | 5642 | 3.98 | |
| HD 32147 | HD 182572 | |||
| This work | FG98 | This work | FG98 | |
| Al I | 0.48 | 0.25 | 0.55 | 0.53 |
| Si I | 0.36 | 0.48 | 0.49 | 0.51 |
| Ca I | 0.01 | 0.42 | ||
| Sc II | - | 0.49 | 0.36 | 0.36 |
| Ti I | 0.66 | 0.11 | 0.32 | 0.50 |
| V I | 0.95 | -0.18 | ||
| Cr I | 0.50 | 0.10 | 0.40 | 0.43 |
| Fe I | 0.28 | 0.22 | 0.34 | 0.42 |
| Fe II | 0.24 | 0.61 | 0.32 | 0.08 |
| Co I | 0.56 | 0.39 | 0.47 | 0.58 |
| Ni I | 0.29 | 0.57 | 0.36 | 0.46 |
Gonzalez et al. (1999) found HD 145675 (14 Her) to have [Fe/H] of
![]() ,
using a spectrum with nearly twice the
resolution as ours. Nevertheless, it is in good agreement with our
0.47 dex estimate with a line-to-line scatter of 0.11 dex derived using
30 lines.
,
using a spectrum with nearly twice the
resolution as ours. Nevertheless, it is in good agreement with our
0.47 dex estimate with a line-to-line scatter of 0.11 dex derived using
30 lines.
For HD 104304 François (1988) found [Fe/H] = 0.16 and [S/H] = 0.59; our estimate of [Fe/H] = 0.17 is in excellent agreement. We derive an [S/H] value lower by 0.10 dex, but since our result is based on one fairly weak S I line, we consider this to be a good agreement.
Morell et al. (1992) derived Fe and Th abundances for a group
of stars in order to estimate their ages. For HD 182572 and HD 196755
they derived [Fe/H] = +0.3 and +0.1 dex, respectively. This is in
reasonable agreement with our results.
| This work | Edv.93 | |
| Na I | 0.50 | 0.45 |
| Si I | 0.40 | 0.31 |
| Ca I | 0.23 | |
| Ti I | 0.22 | 0.32 |
| Fe I | 0.24 | 0.19 |
| Fe II | 0.19 | 0.25 |
| 0.22 | ||
| Ni I | 0.31 | 0.30 |
Edvardsson et al. (1993) analyzed 189 dwarf and subgiant stars with [Fe/H] up to +0.25 dex, including HD 121370. The agreement between the two studies is very good, Table 4. Also, the stellar parameters agree well. These different comparisons give us confidence that our analysis is satisfactory.
As a final test of our analysis method and its compatibility with the
analysis procedures adopted by other groups, we derived elemental
abundances for the stars in the nearby triple system ![]() Centauri
from the equivalent widths published by Neuforge-Verheecke & Magain
(1997). They observed the two stars (components A and B) with the
CAT-telescope at La Silla with a resolution of 100000 and a final
Centauri
from the equivalent widths published by Neuforge-Verheecke & Magain
(1997). They observed the two stars (components A and B) with the
CAT-telescope at La Silla with a resolution of 100000 and a final
![]() 550 and derived stellar abundances as well as stellar
parameters self-consistently from the spectra. Using their published
equivalent widths as well as their
550 and derived stellar abundances as well as stellar
parameters self-consistently from the spectra. Using their published
equivalent widths as well as their ![]() and damping parameters
with our set of model atmospheres and programs, we derive almost the
same abundances for all elements with lines that are not affected by
hyperfine splitting, see Table 5. In fact for most of
those elements taking the hyperfine structure in the line profile
into account makes very little difference in the derived
abundances. This is true in particular for Al.
and damping parameters
with our set of model atmospheres and programs, we derive almost the
same abundances for all elements with lines that are not affected by
hyperfine splitting, see Table 5. In fact for most of
those elements taking the hyperfine structure in the line profile
into account makes very little difference in the derived
abundances. This is true in particular for Al.
| El. | # lines | This work | NVM97 | # lines | This work | NVM97 |
|
|
|
|
|
|||
| O I | 3 | 0.20 0.07 | 0.21 0.06 | |||
| Al I | 1 | 0.23 0.00 | 0.24 0.04 | 1 | 0.27 0.00 | 0.24 0.05 |
| Si I | 3 | 0.26 0.02 | 0.27 0.03 | 3 | 0.30 0.00 | 0.27 0.04 |
| Ca I | 5 | 0.21 0.05 | 0.22 0.03 | 5 | 0.23 0.05 | 0.21 0.05 |
| Sc II | 1 | 0.35 0.00 | 0.25 0.05 | 1 | 0.36 0.00 | 0.26 0.04 |
| Ti I | 15 | 0.22 0.04 | 0.25 0.03 | 13 | 0.26 0.07 | 0.27 0.06 |
| V I | 4 | 0.22 0.04 | 0.23 0.05 | 4 | 0.40 0.07 | 0.32 0.08 |
| Cr I | 11 | 0.20 0.03 | 0.24 0.02 | 12 | 0.25 0.03 | 0.27 0.04 |
| Cr II | 2 | 0.25 0.02 | 0.26 0.03 | 1 | 0.29 0.00 | 0.26 0.09 |
| Fe I | 69 | 0.24 0.06 | 0.25 0.02 | 65 | 0.23 0.05 | 0.24 0.03 |
| Fe II | 4 | 0.25 0.03 | 0.25 0.02 | 4 | 0.27 0.04 | 0.25 0.02 |
| Co I | 3 | 0.29 0.04 | 0.28 0.04 | 3 | 0.39 0.02 | 0.26 0.04 |
| Ni I | 26 | 0.29 0.05 | 0.30 0.03 | 25 | 0.31 0.06 | 0.30 0.02 |
| Y II | 1 | 0.36 0.00 | 0.20 0.05 | 1 | 0.30 0.00 | 0.14 0.05 |
| Eu II | 1 | 0.17 0.00 | 0.15 0.05 | 1 | 0.16 0.00 | 0.14 0.05 |
For the A component we derive in general abundances 0.01 dex less than Neuforge-Verheecke & Magain (1997) and for the B component 0.02-0.03 dex higher abundances, see Table 5. Iron is however 0.01 dex lower for the B component. We find this level of agreement satisfactory considering that we use model atmospheres of slightly different construction.
| HD 10780 | HD 32147 | HD 99491 | HD 104304 | HD 121370 | HD 145675 | HD 182572 | HD 196755 | |
| C I | 0.28 | - | - | - | - | - | - | - |
| O I630 | - | - | 0.27 | 0.37 | - | - | - | - |
| O I777 | - | - | - | - | - | 0.48 0.15 (3) | 0.62 0.10 (3) | 0.11 0.05 (3) |
| Na I | -0.03 | 0.64 | 0.34 | 0.37 | 0.50 | - | - | - |
| Al I | -0.01 0.03 (3) | 0.48 0.05 (3) | 0.41 | 0.25 | - | 0.54 0.02 (3) | 0.55 0.04(3) | 0.02 0.05 (3) |
| Si I | 0.03 0.05 (5) | 0.36 0.15 (5) | 0.35 0.10 (7) | 0.27 0.08 (8) | 0.40 0.14 (6) | 0.61 0.07 (3) | 0.49 0.18(6) | 0.09 0.05 (4) |
| 0.52 0.19 (4) | ||||||||
| Ca I | 0.13 0.10 (5) | - | 0.18 0.08 (4) | 0.15 0.07 (4) | 0.11 | 0.21 | 0.28 | -0.02 0.23 (2) |
| S I | - | - | 0.56 | 0.49 | 0.72 | - | - | 0.38 |
| Sc I | - | - | 0.10 | 0.11 | - | - | - | - |
| Sc II | -0.12 | 0.36 | - | 0.32 0.13 (3) | 0.11 | 0.66 | 0.36 | 0.11 |
| Ti I | 0.10 0.07 (2) | 0.66 0.18 (2) | 0.17 0.10 (13) | 0.11 0.10 (12) | 0.22 0.22 (3) | 0.62 0.03 (2) | 0.32 0.03 (3) | 0.12 0.09 (3) |
| Cr I | 0.01 0.15 (3) | 0.50 0.12 (3) | 0.19 0.11 (6) | 0.14 0.09 (5) | 0.22 0.04 (2) | 0.42 0.04 (3) | 0.40 0.01 (2) | -0.03 0.16 (2) |
| Cr II | - | - | 0.35 | 0.26 | - | - | - | - |
| Fe I | -0.02 0.07 (39) | 0.28 0.11 (39) | 0.22 0.08 (42) | 0.15 0.08 (44) | 0.24 0.14 (32) | 0.47 0.11 (30) | 0.34 0.14 (29) | 0.02 0.09 (28) |
| Fe II | -0.11 0.10 (4) | 0.24 0.10 (4) | 0.24 0.07 (5) | 0.17 0.08 (5) | 0.19 0.07 (4) | 0.49 0.02 (3) | 0.32 0.08 (3) | 0.06 0.03 (4) |
| 0.56 0.14 (4) | ||||||||
| Co I | -0.06 0.06 (4) | 0.56 0.19 (4) | 0.26 0.08 (5) | 0.04 0.54 (6) | 0.32 | 0.81 0.11 (4) | 0.47 0.07 (3) | 0.27 |
| Ni I | -0.03 0.06 (17) | 0.29 0.08 (15) | 0.26 0.07 (20) | 0.20 0.09 (19) | 0.31 0.16 (13) | 0.55 0.10 (11) | 0.36 0.08 (18) | 0.00 0.09 (13) |
The stellar abundances derived in this study are summarized in Table 6. We will discuss the abundance determination for each element separately. For some elements only one or a couple of lines have been used and the results are therefore more tentative than firm. The number of lines used for each element are also indicated in the table.
Iron abundances are derived from a large number of lines, 28 to 44 lines per star, which means that the errors in the mean are very small, typically less 0.02 dex. Thus, the error in Fe abundances is negligible in the error budget for the abundance ratios.
In Table 7 we compare the iron abundances in this study and those quoted by Taylor (1996). For HD 32147, HD 99491, HD 121370, HD 145675, and HD 182572 their SMR status is confirmed. HD 104304 is a marginal case and HD 10780 and HD 196755 are shown to not be SMR stars.
Three of our stars have useful observations of the triplet lines around 777 nm. For those three stars we get [O/Fe] = 0.01, 0.28, and 0.09 dex respectively. Line-to-line scatter is 0.1 dex or less for these stars which means that formal errors are less than 0.1 dex for all three stars. These oxygen abundances should be fairly reliable as we are dealing with stars that are similar to the Sun and our study is differential. Edvardsson et al. (1993) found a good correlation between oxygen abundances derived from the forbidden line and those derived from the triplet. Note, however, that Feltzing & Gustafsson (1998) found no such correlation for their very metal-rich sample. Thus, in conclusion, the [O/Fe] for HD 196755 derived from the triplet should be robust while the [O/Fe] for HD 145675 and HD 182572 are more uncertain in term of possible NLTE effects.
| ID | VSL | SMR | [Fe/H] | [Fe/H] |
| (Taylor) | This work | |||
| HD 10780 | no | 0.396 | -0.02 | |
| HD 32147 | yes | >0.1 | 0.28 | |
| HD 99491 | marg | 0.115 | 0.20 | |
| HD 104304 | marg | 0.326 | 0.16 | |
| HD 121370 | 95% | 0.305 | 0.25 | |
| HD 145675 | marg | 98% | 0.38 | 0.47 |
| HD 182572 | 98% | >0.341 | 0.35 | |
| HD 196755 | 0.500 | 0.02 |
Our linelist contains 2 S I lines, however, for those stars where we could determine S abundances only one line was available in each star. Our abundances are therefore uncertain. We note that [S/Fe] appears somewhat high.
Sc abundances were derived from both Sc I and Sc II lines. The [Sc/Fe] values fall within the range expected from Feltzing & Gustafsson (1998) and the trend in our [Sc/Fe] data is flat at around 0.1-0.15 dex. We note though that our most metal rich stars are overabundant in Sc in contrast with Feltzing & Gustafsson (1998) which show a tendency for the most metal-rich stars to be underabundant.
![\begin{figure}
\par\includegraphics[width=6.5cm,clip]{H2231.6.ps}\end{figure}](/articles/aa/full/2001/07/aah2231/img40.gif) |
Figure 5:
Diagram used to estimate ages for our program stars. Isochrones
are from Bertelli et al. (1994). Full curves correspond to Z=0.02, and the
dashed curves to Z=0.05 isochrones, respectively. Filled symbols denote stars
with
|
| Open with DEXTER | |
An age-metallicity relation among dwarf stars in the solar
neighbourhood is a key observable that models of galactic chemical
evolution must match. The most important recent studies include
Edvardsson et al. (1993), Carraro et al. (1998), and
Rocha-Pinto et al. (2000). The first two studies
use the same [Fe/H], as derived in
Edvardsson et al. (1993) from
detailed abundance analysis. Carraro et al. (1998)
make use of the age determinations done for
Edvardsson et al. (1993) sample post Hipparcos (Ng & Bertelli 1998).
Essentially, their data show a declining trend such that more
metal-poor stars are older. However, the intrinsic scatter appears
large in both age and [Fe/H] and a unique age-metallicity relation
may not be present. The study by Rocha-Pinto et al. (2000) used a
different technique to determine ages, chromospheric activity. They
arrive at the conclusion that there exists a unique age-metallicity
relation in the solar neighbourhood. The scatter in both age and
metallicity are found to be small for all ages and metallicities (see
their Fig. 13).
![\begin{figure}
\par\includegraphics[angle=-90,width=6.5cm,clip]{H2231.7.ps}\end{figure}](/articles/aa/full/2001/07/aah2231/img41.gif) |
Figure 6:
A comparison of our isochrone ages with the general
age-metallicity
relation derived by Rocha-Pinto et al. (2000). |
| Open with DEXTER | |
SMR stars are rare and therefore none of the studies discussed contain
large numbers of them, in fact e.g. the Edvardsson et al. (1993)
sample was selected with an upper limit in metallicity near 0.2
dex. Such a bias is not present in the Rocha-Pinto et al. (2000)
sample, and they have a few stars of up to ![]() 0.3 dex (their Fig. 13). It is therefore valuable to derive ages for our small sample of
stars and compare them to that of the general age-metallicity
relations found in previous studies.
0.3 dex (their Fig. 13). It is therefore valuable to derive ages for our small sample of
stars and compare them to that of the general age-metallicity
relations found in previous studies.
We have simply estimated the ages of the stars by plotting them in the
![]() plane and using the Bertelli et al. (1994)
isochrones, Fig. 5. The ages were estimated by eye. The
correct isochrones were chosen depending on the [Fe/H] for each star
as derived in this study. In order to see if the age-metallicity relation
appears unique also for the most metal-rich stars, we compare our data
and the ages from the several papers by Gonzalez and co-workers, see
Table 8,
with the age-metallicity relation found in Rocha-Pinto et al. (2000) in
Fig. 6.
plane and using the Bertelli et al. (1994)
isochrones, Fig. 5. The ages were estimated by eye. The
correct isochrones were chosen depending on the [Fe/H] for each star
as derived in this study. In order to see if the age-metallicity relation
appears unique also for the most metal-rich stars, we compare our data
and the ages from the several papers by Gonzalez and co-workers, see
Table 8,
with the age-metallicity relation found in Rocha-Pinto et al. (2000) in
Fig. 6.
A possible error source in the age determination of SMR stars is the
presence of planets. Gonzalez
(1998) noted that if one or several planets have been engulfed by a
star, then its [Fe/H] may increase by up to around 0.10 dex. If this
has happened, then the abundances and age for a polluted star will no
longer represent it's true age and abundances. However, such a change in
metallicity would still not turn a ![]() 10 Gyr star into a star of
only a few Gyr, as required to fit into a general age-metallicity relation.
10 Gyr star into a star of
only a few Gyr, as required to fit into a general age-metallicity relation.
We note that our sample is not complete or in any other way well-defined. However, it proves that there also exist stars that are both very old and at the same time very metal-rich, also taking the errors in the ages into account. This casts doubts on the possibility of defining a one-to-one relation between age and metallicity among the solar neighbourhood stars.
| ID | Name |
|
|
|
Age (isochrones) | Age (Ca II) | [Fe/H] |
| (kms-1) | (kms-1) | (kms-1) | (Gyr) | (Gyr) | |||
| HD 10780 | -14.8 | -11.3 | 1.6 | - | -0.02 | ||
| HD 32147 | 10.7 | -51.8 | -6.3 | - | 0.28 | ||
| HD 99491 | -49.8 | -4.1 | -8.7 | 12.6-15.8 | 0.22 | ||
| HD 104304 | 31.6 | -10.2 | -9.2 | 0.15 | |||
| HD 121370 | 19.2 | -12.0 | 4.6 | 2.5-3.2 | 0.24 | ||
| HD 145675 | 14 Her | 35.6 | -2.0 | -2.9 | 10-13.0 | 0.47 | |
| HD 182572 | -106.7 | -25.2 | -13.5 | 7.9-10.0 | 0.34 | ||
| HD 196755 | -48.1 | 29. | -11.7 | 2.5-3.2 | 0.02 | ||
| HD 9826 | 4.3 | -34.1 | 0.6 | 2.7 | 0.12 | ||
| HD 75732 | -27.3 | -13.2 | -0.9 | 5 | 0.45 | ||
| HD 75289 | 31.1 | -12.4 | -14.5 | 2.1 | 0.28 | ||
| HD 95128 | 47 UMa | -14.7 | 2.6 | 8.8 | 6.3 | 7 | 0.01 |
| HD 117176 | 70 Vir | 23.2 | -46.9 | 3.4 | 8 | 9 | -0.03 |
| HD 120136 | -23.5 | -13.8 | 0.3 | 1 | 0.32 | ||
| HD 143761 | 64.1 | -30.7 | 28.5 | 12.3 | -0.29 | ||
| HD 186408 | 16 Cyg A | 27.6 | -23.6 | 7.2 | 9.0 | 0.11 | |
| HD 186427 | 16 Cyg B | 27.1 | -24.7 | 5.4 | 9.0 | 7 | 0.06 |
| HD 187123 | 11.6 | -10.6 | -36.4 | 5.5 | 0.16 | ||
| HD 217014 | 51 Peg | -5.6 | -24.2 | 22.3 | 6.0 | 10 | 0.21 |
| HD 210277 | 12.4 | -46.8 | 3.0 | 8.5 | 0.24 |
Spatial velocity data were calculated using the Hipparcos parallaxes and proper motions. Radial velocities were taken from Barbier-Brossat et al. (1994). For our stars the uncertainties in the parallaxes are small, less than 3% of the parallax, Table 1. Data were also obtained for the stars from the Gonzalez (1999) compilation. The velocities are presented in Table 8. Note that we here quote the velocities relative to the local standard of rest (LSR) and Gonzalez (1999) quoted velocities relative to the sun.
From Table 8 we see that all the stars have
W-velocities well below the ![]() of the general population of
stars with similar B-V. Figure 5 in Dehnen &
Binney (1998) illustrates how
of the general population of
stars with similar B-V. Figure 5 in Dehnen &
Binney (1998) illustrates how
![]() varies with B-V.
Also, most of the stars in Table
8 have both V and U-velocities well below 1
varies with B-V.
Also, most of the stars in Table
8 have both V and U-velocities well below 1
![]() for the general population. We have
quantified this by calculating the probabilities that any one of our
stars belongs to either the thin or the thick disk by using a model
where 94% of the solar neighbourhood stars belong to a thin disk
with
for the general population. We have
quantified this by calculating the probabilities that any one of our
stars belongs to either the thin or the thick disk by using a model
where 94% of the solar neighbourhood stars belong to a thin disk
with
![]() ,
,
![]() ,
and
,
and
![]() kms-1 and the
remaining 6% to the thick disk with
kms-1 and the
remaining 6% to the thick disk with
![]() ,
,
![]() ,
and
,
and
![]() kms-1. Only one of our stars, HD 182572, has a
probability that it belongs to the thick disk larger than that
it should belong to the thin. We estimate that, given the galactic
model, this star has 75% chance of belonging to the thick disk.
Thus, we conclude that our SMR and
planet-bearing stars samples the thin disk.
kms-1. Only one of our stars, HD 182572, has a
probability that it belongs to the thick disk larger than that
it should belong to the thin. We estimate that, given the galactic
model, this star has 75% chance of belonging to the thick disk.
Thus, we conclude that our SMR and
planet-bearing stars samples the thin disk.
Fuhrmann (1998) found that
stars with thick disk kinematics were enhanced in [Mg/Fe] as compared
to thin disk stars at the same metallicity. We
have not measured Mg lines in our spectra. We did, however, measure Si, and our
abundance result for HD 182572 gives [Si/Fe]
![]() .
Compared with the general trend of [Si/Fe] for metal-rich
stars in Feltzing & Gustafsson (1998), this is above the mean;
however, their data exhibit a large scatter.
We have also determined Ca abundances for this
star, however, only one line was available. This line seems to give
fairly low Ca abundances in all of the stars with more than
two lines observed and may thus be underestimating the true Ca abundance
in this star. Note that it is not inconsistent that we also
find thin disk stars with the same Si abundance as, if HD 182572 is a
thick disk star, then it might be showing us the abundance trend after
the decline in [X/Fe], where X is either O or an
.
Compared with the general trend of [Si/Fe] for metal-rich
stars in Feltzing & Gustafsson (1998), this is above the mean;
however, their data exhibit a large scatter.
We have also determined Ca abundances for this
star, however, only one line was available. This line seems to give
fairly low Ca abundances in all of the stars with more than
two lines observed and may thus be underestimating the true Ca abundance
in this star. Note that it is not inconsistent that we also
find thin disk stars with the same Si abundance as, if HD 182572 is a
thick disk star, then it might be showing us the abundance trend after
the decline in [X/Fe], where X is either O or an ![]() -element,
sets in due to increasing relative contribution
of SNIa.
-element,
sets in due to increasing relative contribution
of SNIa.
Several of the nearby SMR star candidates listed by Taylor (1996, Table 4) have been found to harbour planets. In particular, the planet-bearing stars HD 75732, HD 145675, and HD 217014 are included in Taylor's list of 29 SMR class IV-V star candidates. Not all the stars in his list have been searched for planets as of yet, so the fraction of SMR star candidates with planets may increase. Butler et al. (2000) provide independent confirming evidence for a preponderance of planets among metal-rich stars; they note that of their 600 Keck targets, half of which are metal-poor, 2 planets have been found around metal-poor stars and 10 around metal-rich stars. Also, several planet-bearing stars not in Taylor's list have recently been found to be likely SMR stars. Examples in this group include HD 120136, HD 217107, and HD 210277 (Gonzalez 2000). It appears that the Doppler planet search method is also an efficient detector of new SMR star candidates!
Gonzalez et al. (1999) suggested that BD
![]() be searched for
planets on the basis of its similarity to HD 75732 and HD 145675
(similar
be searched for
planets on the basis of its similarity to HD 75732 and HD 145675
(similar
![]() and [Fe/H]). Butler et al. (2000) reported on
the detection of a planet around BD
and [Fe/H]). Butler et al. (2000) reported on
the detection of a planet around BD
![]() ,
which they had placed on
their monitoring program as a result of Gonzalez et al.'s suggestion.
Another star, HD 89744, was suggested to Geoff Marcy as a
planet-bearing candidate by one of us (G.G.) on the basis of its high
[Fe/H] and low [C/Fe]. Sylvain et al. (2000) announced the discovery
of a planet around this star (note: they began observing this star
about 2 years before Gonzalez's prediction). The successful
prediction of the presence of planets around two stars provides
strong independent confirming evidence of the planet - SMR star
connection. The low [C/Fe] values seen among stars with planets is
the first convincing evidence of a trend with abundance ratios. The
physical significance of this trend is not yet known.
,
which they had placed on
their monitoring program as a result of Gonzalez et al.'s suggestion.
Another star, HD 89744, was suggested to Geoff Marcy as a
planet-bearing candidate by one of us (G.G.) on the basis of its high
[Fe/H] and low [C/Fe]. Sylvain et al. (2000) announced the discovery
of a planet around this star (note: they began observing this star
about 2 years before Gonzalez's prediction). The successful
prediction of the presence of planets around two stars provides
strong independent confirming evidence of the planet - SMR star
connection. The low [C/Fe] values seen among stars with planets is
the first convincing evidence of a trend with abundance ratios. The
physical significance of this trend is not yet known.
We have presented detailed abundance analyses at high resolution for 8 possible SMR dwarf stars and subgiants. Four of these stars have previously been studied at high resolution; our results in general agree well with them. For the remaining four stars this is, to the best of our knowledge, the first study of this sort.
We find in particular that:
|
|
|
Note | |||
| [Å] | [eV] | [s-1] | |||
| C I;
|
|||||
| 6587.61 | 8.53 | -1.246 | 2.50 | 1.00e+08 | |
| O I;
|
|||||
| 6300.310 | 0.00 | -9.75 | 2.50 | 1.00e+08 | |
| 7771.95 | 9.14 | 0.26 | 2.50 | 1.00e+08 | |
| 7774.17 | 9.14 | 0.12 | 2.50 | 1.00e+08 | |
| 7775.35 | 9.14 | -0.11 | 2.50 | 1.00e+08 | |
| Na I;
|
|||||
| 6154.23 | 2.10 | -1.58 | 2.10 | 7.08e+07 | |
| Al I;
|
|||||
| 6698.67 | 3.143 | -1.89 | 2.50 | 3.02e+08 | |
| 7835.30 | 4.022 | -0.78 | 2.50 | 7.94e+07 | |
| 7836.13 | 4.022 | -0.60 | 2.50 | 7.94e+07 | |
| Si I;
|
|||||
| 5622.22 | 4.930 | -2.95 | 2.50 | 1.95e+08 | |
| 5665.55 | 4.920 | -2.02 | 2.50 | 1.95e+08 | |
| 5793.07 | 4.930 | -1.95 | 2.50 | 1.95e+08 | |
| 6125.02 | 5.614 | -1.55 | 2.50 | 1.00e+08 | |
| 6142.48 | 5.619 | -1.50 | 2.50 | 1.00e+08 | |
| 6155.69 | 5.619 | -2.43 | 2.50 | 1.00e+08 | |
| 6237.31 | 5.614 | -1.15 | 2.50 | 1.00e+08 | |
| 6721.84 | 5.863 | -1.16 | 2.50 | 1.00e+08 | |
| 6741.62 | 5.984 | -1.63 | 2.50 | 2.69e+07 | |
| 6848.58 | 5.863 | -1.65 | 2.50 | 1.00e+08 | |
| 7455.37 | 5.964 | -2.00 | 2.50 | 1.00e+08 | |
| 7760.62 | 6.206 | -1.36 | 2.50 | 1.00e+08 | |
| 7799.99 | 6.181 | -0.77 | 2.50 | 1.00e+08 | |
| S I;
|
|||||
| 6743.531 | 7.866 | -0.84 | 2.50 | 3.80e+07 | |
| 6757.171 | 7.870 | -0.53 | 2.50 | 3.89e+07 | |
| Ca I;
|
|||||
| 5512.980 | 2.933 | -0.66 | 2.50 | 2.80e+08 | |
| 5581.965 | 2.523 | -0.87 | 2.50 | 7.13e+07 | |
| 5867.562 | 2.933 | -1.61 | 2.50 | 2.62e+08 | |
| 6166.439 | 2.521 | -1.22 | 2.50 | 1.86e+07 | |
| 6169.042 | 2.523 | -0.90 | 2.50 | 1.86e+07 | |
| 6169.563 | 2.526 | -0.67 | 2.50 | 1.88e+07 | |
| 6455.598 | 2.523 | -1.48 | 2.50 | 4.64e+07 | |
| 6464.673 | 2.526 | -2.36 | 2.50 | 4.64e+07 | |
| 6471.662 | 2.526 | -0.98 | 2.50 | 4.42e+07 | |
| Sc I;
|
|||||
| 5484.626 | 1.851 | 0.37 | 1.50 | 1.46e+08 | |
| Sc II;
|
|||||
| 5526.790 | 1.768 | 0.09 | 1.50 | 2.16e+08 | |
| 6300.698 | 1.507 | -2.01 | 1.50 | 2.31e+08 | |
| 6604.601 | 1.357 | -1.16 | 1.50 | 1.46e+08 | |
| Ti I;
|
|||||
| 5490.148 | 1.460 | -0.98 | 2.50 | 1.43e+08 | |
| 5739.469 | 2.249 | -0.78 | 2.50 | 6.60e+07 | |
| 5739.978 | 2.236 | -0.74 | 2.50 | 6.53e+07 | |
| 5823.686 | 2.267 | -1.05 | 2.50 | 6.53e+07 | |
| 5832.473 | 3.337 | -0.28 | 2.50 | 1.45e+08 | |
| 5866.451 | 1.067 | -0.83 | 2.50 | 4.40e+08 | |
| 6091.171 | 2.267 | -0.43 | 2.50 | 8.50e+07 | |
| 6092.792 | 1.887 | -1.45 | 2.50 | 1.27e+08 | |
| 6098.658 | 3.062 | -0.07 | 2.50 | 5.43e+07 | |
| 6126.216 | 1.067 | -1.41 | 2.50 | 9.93e+06 | |
| 6599.105 | 0.900 | -2.07 | 2.50 | 1.22e+06 | |
| 6743.122 | 0.900 | -1.73 | 2.50 | 6.93e+05 | |
| 6745.547 | 2.236 | -1.36 | 2.50 | 1.44e+08 | |
|
|
|
Note | |||
| [Å] | [eV] | [s-1] | |||
| V I;
|
|||||
| 5670.853 | 1.081 | -0.46 | 2.50 | 5.23e+06 | |
| 5727.048 | 1.081 | -1.22 | 2.50 | 7.57e+08 | |
| 5727.652 | 1.051 | -0.90 | 2.50 | 6.15e+07 | |
| 5830.675 | 3.113 | 0.61 | 2.50 | 1.83e+08 | |
| 6039.722 | 1.064 | -0.72 | 2.50 | 3.98e+07 | |
| 6090.214 | 1.081 | -0.15 | 2.50 | 3.98e+07 | |
| 6111.645 | 1.043 | -0.795 | 2.50 | 3.90e+07 | |
| 6135.361 | 1.051 | -0.766 | 2.50 | 3.90e+07 | |
| 6150.157 | 0.301 | -1.54 | 2.50 | 7.81e+05 | |
| 6199.197 | 0.287 | -1.48 | 2.50 | 3.25e+06 | |
| 6224.529 | 0.287 | -1.84 | 2.50 | 1.22e+06 | |
| 6251.827 | 0.287 | -1.45 | 2.50 | 3.07e+07 | |
| 6256.887 | 0.275 | -2.17 | 2.50 | 2.94e+06 | |
| 6452.341 | 1.195 | -0.836 | 2.50 | 3.99e+07 | |
| Cr I;
|
|||||
| 5628.621 | 3.422 | -0.83 | 2.50 | 6.52e+07 | |
| 5664.555 | 3.826 | -0.87 | 2.50 | 4.80e+07 | |
| 5783.886 | 3.322 | -0.26 | 2.50 | 9.98e+07 | |
| 5787.965 | 3.322 | -0.21 | 2.50 | 1.00e+08 | |
| 6630.005 | 1.030 | -3.46 | 2.50 | 2.40e+07 | |
| 6669.255 | 4.175 | -0.47 | 2.50 | 3.66e+07 | |
| 7400.226 | 2.900 | -0.171 | 2.50 | 6.76e+07 | |
| Cr II;
|
|||||
| 5502.067 | 4.168 | -1.99 | 2.50 | 2.55e+07 | |
| Fe I;
|
|||||
| 5491.832 | 4.186 | -2.14 | 2.00 | 1.44e+08 | |
| 5494.463 | 4.076 | -1.85 | 2.00 | 2.90e+07 | |
| 5522.447 | 4.209 | -1.43 | 2.00 | 8.97e+07 | |
| 5539.280 | 3.642 | -2.49 | 2.00 | 2.60e+07 | |
| 5543.936 | 4.217 | -1.10 | 2.00 | 2.39e+08 | |
| 5560.212 | 4.434 | -1.09 | 2.00 | 1.64e+08 | |
| 5577.030 | 5.033 | -1.45 | 2.00 | 6.89e+08 | |
| 5579.340 | 4.231 | -2.29 | 2.00 | 2.55e+08 | |
| 5607.664 | 4.154 | -2.18 | 2.00 | 3.50e+08 | |
| 5608.972 | 4.209 | -2.31 | 2.00 | 8.89e+07 | |
| 5611.360 | 3.635 | -2.91 | 2.00 | 1.25e+08 | |
| 5618.633 | 4.209 | -1.34 | 2.00 | 1.05e+08 | |
| 5619.595 | 4.386 | -1.48 | 2.00 | 1.78e+08 | |
| 5636.696 | 3.640 | -2.56 | 2.00 | 3.90e+07 | |
| 5638.262 | 4.220 | -0.88 | 2.00 | 1.94e+08 | |
| 5646.684 | 4.260 | -2.40 | 2.00 | 1.00e+08 | |
| 5651.469 | 4.473 | -1.76 | 2.00 | 1.62e+08 | |
| 5652.010 | 4.218 | -1.82 | 2.00 | 2.36e+08 | |
| 5741.848 | 4.256 | -1.66 | 2.00 | 2.11e+08 | |
| 5793.689 | 4.593 | -1.29 | 2.00 | 5.38e+07 | |
| 5811.914 | 4.143 | -2.38 | 2.00 | 3.76e+07 | |
| 5814.807 | 4.283 | -1.84 | 2.00 | 2.11e+08 | |
| 5852.219 | 4.548 | -1.21 | 2.00 | 1.90e+08 | |
| 5855.077 | 4.608 | -1.54 | 2.00 | 1.91e+08 | |
| 6034.035 | 4.312 | -2.30 | 2.00 | 1.59e+08 | |
| 6089.580 | 4.580 | -1.30 | 2.00 | 9.27e+07 | |
| 6094.374 | 4.652 | -1.58 | 2.00 | 1.92e+08 | |
| 6096.665 | 3.984 | -1.81 | 2.00 | 4.53e+07 | |
| 6105.131 | 4.548 | -1.91 | 2.00 | 1.00e+08 | |
| 6151.618 | 2.176 | -3.329 | 2.00 | 1.55e+08 | |
| 6157.728 | 4.076 | -1.28 | 2.00 | 5.02e+07 | |
| 6159.378 | 4.607 | -1.85 | 2.00 | 1.92e+08 | |
| 6165.360 | 4.143 | -1.524 | 2.00 | 8.77e+07 | |
| 6173.336 | 2.223 | -2.910 | 2.00 | 1.67e+08 | |
|
|
|
Note | |||
| [Å] | [eV] | [s-1] | |||
| 6187.990 | 3.943 | -1.65 | 2.00 | 4.60e+07 | |
| 6200.313 | 2.608 | -2.48 | 2.00 | 1.03e+08 | |
| 6226.736 | 3.883 | -2.09 | 2.00 | 5.42e+07 | |
| 6229.228 | 2.845 | -2.885 | 2.00 | 1.45e+08 | |
| 6380.743 | 4.186 | -1.366 | 2.00 | 7.34e+07 | |
| 6385.718 | 4.733 | -1.82 | 2.00 | 2.34e+08 | |
| 6419.950 | 4.733 | -0.27 | 2.00 | 2.31e+08 | |
| 6591.313 | 4.593 | -1.99 | 2.00 | 1.40e+08 | |
| 6608.026 | 2.279 | -3.94 | 2.00 | 1.66e+08 | |
| 6653.853 | 4.154 | -2.38 | 2.00 | 2.09e+08 | |
| 6703.567 | 2.758 | -3.03 | 2.00 | 1.03e+08 | |
| 6710.319 | 1.485 | -4.79 | 2.00 | 1.66e+07 | |
| 6726.661 | 4.607 | -1.079 | 2.00 | 2.29e+08 | |
| 6733.151 | 4.638 | -1.45 | 2.00 | 2.27e+08 | |
| 6745.101 | 4.580 | -2.17 | 2.00 | 4.78e+07 | |
| 6745.957 | 4.076 | -2.74 | 2.00 | 3.79e+07 | |
| 6750.153 | 2.424 | -2.641 | 2.00 | 7.69e+06 | |
| 6806.845 | 2.727 | -3.11 | 2.00 | 1.02e+08 | |
| 6810.263 | 4.607 | -1.026 | 2.00 | 2.30e+08 | |
| 6820.372 | 4.638 | -1.16 | 2.00 | 2.22e+08 | |
| 7401.685 | 4.186 | -1.609 | 2.00 | 7.03e+07 | |
| 7418.667 | 4.143 | -1.476 | 2.00 | 1.06e+08 | |
| 7421.559 | 4.638 | -1.73 | 2.00 | 2.50e+08 | |
| 7440.952 | 4.913 | -0.662 | 2.00 | 4.97e+08 | |
| 7443.022 | 4.186 | -1.66 | 2.00 | 3.48e+07 | |
| 7453.998 | 4.186 | -2.36 | 2.00 | 1.45e+08 | |
| 7498.530 | 4.143 | -2.13 | 2.00 | 1.16e+08 | |
| 7507.261 | 4.415 | -0.972 | 2.00 | 9.77e+07 | |
| 7540.430 | 2.727 | -3.77 | 2.00 | 9.31e+07 | |
| 7547.910 | 5.100 | -1.247 | 2.00 | 6.38e+08 | |
| 7551.109 | 5.085 | -1.57 | 2.00 | 6.34e+08 | |
| 7582.122 | 4.955 | -1.64 | 2.00 | 1.00e+08 | |
| 7588.305 | 5.033 | -1.07 | 2.00 | 6.35e+08 | |
| 7745.500 | 5.086 | -1.149 | 2.00 | 6.37e+08 | |
| 7746.587 | 5.064 | -1.276 | 2.00 | 6.31e+08 | |
| 7751.137 | 4.991 | -0.775 | 2.00 | 6.44e+08 | |
| 7844.559 | 4.835 | -1.70 | 2.00 | 2.34e+08 | |
| Fe II;
|
|||||
| 5823.155 | 5.569 | -2.88 | 2.00 | 3.00e+08 | not used |
| 6149.258 | 3.889 | -2.84 | 2.00 | 3.39e+09 | |
| 6247.557 | 3.892 | -2.39 | 2.00 | 3.38e+08 | |
| 6369.462 | 2.891 | -4.20 | 2.00 | 2.90e+08 | |
| 6383.722 | 5.553 | -2.10 | 2.00 | 4.09e+08 | |
| 6416.919 | 3.892 | -2.69 | 2.00 | 3.37e+08 | not used |
| 6432.680 | 2.891 | -3.64 | 2.00 | 2.90e+07 | |
| 6446.410 | 6.223 | -1.88 | 2.00 | 5.22e+08 | |
| 6456.383 | 3.903 | -2.24 | 2.00 | 3.37e+08 | |
| 7449.335 | 3.889 | -3.168 | 2.00 | 4.09e+08 | not used |
| 7515.831 | 3.903 | -3.462 | 2.00 | 4.09e+08 | |
|
|
|
Note | |||
| [Å] | [eV] | [s-1] | |||
| Co I;
|
|||||
| 5647.234 | 2.280 | -1.58 | 2.50 | 1.66e+08 | |
| 6086.658 | 3.409 | 0.22 | 2.50 | 8.87e+07 | |
| 6093.143 | 1.740 | -2.37 | 2.50 | 2.08e+07 | |
| 6188.996 | 1.710 | -2.33 | 2.50 | 2.22e+07 | |
| 6257.572 | 3.713 | -1.08 | 2.50 | 6.89e+07 | |
| 6429.906 | 2.137 | -2.39 | 2.50 | 9.29e+05 | |
| 6632.433 | 2.280 | -1.87 | 2.50 | 6.46e+06 | |
| 6814.942 | 1.956 | -1.77 | 2.50 | 2.08e+07 | |
| 7417.367 | 2.042 | -1.97 | 2.50 | 2.22e+07 | |
| Ni I;
|
|||||
| 5494.876 | 4.105 | -1.08 | 2.50 | 2.05e+08 | |
| 5578.711 | 1.676 | -2.68 | 2.50 | 5.43e+07 | |
| 5628.335 | 4.089 | -1.35 | 2.50 | 2.52e+08 | |
| 5638.745 | 3.898 | -1.72 | 2.50 | 1.27e+08 | |
| 5643.072 | 4.165 | -1.22 | 2.50 | 9.14e+07 | |
| 6025.751 | 4.236 | -1.69 | 2.50 | 1.92e+08 | |
| 6039.296 | 4.236 | -2.07 | 2.50 | 2.16e+08 | |
| 6086.276 | 4.266 | -0.51 | 2.50 | 2.54e+08 | |
| 6108.107 | 1.676 | -2.56 | 2.50 | 4.86e+07 | |
| 6111.066 | 4.088 | -0.86 | 2.50 | 1.46e+08 | |
| 6128.963 | 1.676 | -3.37 | 2.50 | 1.21e+07 | |
| 6130.130 | 4.266 | -0.963 | 2.50 | 2.78e+08 | |
| 6133.963 | 4.088 | -1.79 | 2.50 | 1.45e+08 | |
| 6176.807 | 4.088 | -0.27 | 2.50 | 1.45e+08 | |
| 6177.236 | 1.826 | -3.562 | 2.50 | 4.31e+07 | |
| 6186.709 | 4.105 | -0.922 | 2.50 | 2.06e+09 | |
| 6204.600 | 4.088 | -1.146 | 2.50 | 1.75e+08 | |
| 6370.341 | 3.542 | -1.957 | 2.50 | 1.48e+08 | |
| 6378.247 | 4.154 | -0.84 | 2.50 | 2.08e+08 | |
| 6424.847 | 4.167 | -1.354 | 2.50 | 2.13e+08 | |
| 6586.308 | 1.951 | -2.748 | 2.50 | 4.30e+07 | |
| 6598.593 | 4.236 | -0.94 | 2.50 | 1.92e+08 | |
| 6643.629 | 1.676 | -2.08 | 2.50 | 1.01e+08 | |
| 6767.768 | 1.826 | -2.24 | 2.50 | 1.03e+08 | |
| 6772.313 | 3.658 | -1.082 | 2.50 | 1.50e+08 | |
| 7414.500 | 1.986 | -2.22 | 2.50 | 1.03e+08 | |
| 7522.758 | 3.658 | -0.535 | 2.50 | 1.50e+08 | |
| 7525.111 | 3.635 | -0.64 | 2.50 | 1.19e+08 | |
| 7574.043 | 3.833 | -0.533 | 2.50 | 9.12e+07 | |
| 7826.766 | 3.699 | -1.856 | 2.50 | 5.98e+07 | |
Acknowledgements
SF acknowledges financial support from the Swedish Natural Research Council under their postdoc program. GG acknowledges financial support from the Kennilworth Fund of the New York Community Trust.Johan Holmberg at Lund Observatory is thanked for providing stellar velocities.