| Issue |
A&A
Volume 567, July 2014
|
|
|---|---|---|
| Article Number | A130 | |
| Number of page(s) | 13 | |
| Section | Interstellar and circumstellar matter | |
| DOI | https://doi.org/10.1051/0004-6361/201423748 | |
| Published online | 29 July 2014 | |
Online material
Appendix A: Modelling the CH2NH absorption lines
CH2NH has two transitions with similar line strengths close to NH+ at 1013 GHz: 33,1−22,0 (1012.531 GHz) with El = 41 K only +8.5 MHz (−2.5 km s-1) from NH+, and 33,0−22,1 (1012.661 GHz) seen as a narrow absorption at 21 km s-1. It should be noted that this line blends with the SO2415,37−404,36 (1012.673 GHz) emission. We model the SO2 emission, both CH2NH absorptions, and the o-NH242,2−41,3 emission line wing (seen at ~70 km s-1) in order to subtract these lines in the search for any remaining weak NH+ absorption. All modelled lines are shown in Fig. A.2 together with the original data in black and the resulting spectra after subtraction of the above described lines is shown in red.
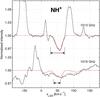 |
Fig. A.1
Sgr B2 (M). Gaussian fits of NH+ 1013 and 1019 GHz line profiles, including all hfs components, to the observations. The arrows mark the velocity range in which the fit was made. |
| Open with DEXTER | |
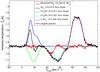 |
Fig. A.2
Sgr B2 (M). Observed NH+ 1 013 GHz search spectrum (black) along with models of the two absorbing CH2NH transitions (green and cyan), the expected SO2 (blue) and NH2 (pink) emissions, and the remaining spectrum after removal of their expected contributions (red; more details in Sect. 3). |
| Open with DEXTER | |
The numerous SO2 lines observed in our band (e.g. 395,35−384,34 and 435,39−424,38), as well as in the HEXOS spectral line survey, are used to reconstruct the SO2 1012.673 GHz line. The true CH2NH absorption is then found by comparing the reconstructed SO2 emission with the observed line profile. Finally, the modelled CH2NH absorption is used as a template for the CH2NH absorption at 1012.531 GHz since their line strengths are similar. We use RADEX to check our modelled CH2NH lines together with the 225 GHz (11,1−00,0) line observed in absorption by Nummelin et al. (2000). The integrated opacities of these three lines are matched using a density of n(H2) ~ 105 cm-3, a kinetic temperature of ~100 K, a column density N(CH2NH) ~ 1 × 1015 cm-2, and a line width of ~15 km s-1 which supports the above modelling and results. After subtracting all modelled lines, we find a weak remaining absorption feature at VLSR = 69 km s-1 with an integrated opacity of 0.08 km s-1, which is used as an upper limit to NH+.
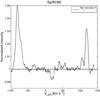 |
Fig. A.3
Absorption feature found at a velocity of +18.5 km s-1 is tentatively
identified as p-NH |
| Open with DEXTER | |
Appendix B: NH chemistry
The NH anion can form via the dissociative attachment process through electron-impact on
NH3
anion can form via the dissociative attachment process through electron-impact on
NH3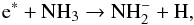 (B.1)where
e∗ represents an energetic electron. The
energetic threshold for this process is ε = 3.857 eV, potentially leading to an unusually
high production rate. At kinetic temperatures of the order of 100 K or less, the thermal
electrons have a characteristic energy less than 9 meV. Therefore, the hot electrons
required to form the anion are extremely superthermal. A self-consistent treatment of
the electron speed distribution in the weakly ionised interstellar medium is currently
being investigated (Black, in prep.). The crucial energy range for reaction (B.3) is 3.8 to 8.5 eV. In photon-dominated
regions, including diffuse molecular clouds, such electrons are produced mainly by the
same photoelectric effect involving dust and large molecules that dominates the heating
of the gas. Energetic electrons are thermalised primarily by collisions with neutrals (H
and H2), rather
than by elastic collisions with thermal electrons, as long as the fractional ionisation
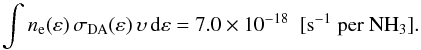
is less than 10-3. The cross-section, σDA, for the
dissociative attachment process has a peak value of 1.6 Mb near ε = 5.8 eV, with
vanishing values at ε< 4.2 and at
ε>
8.5 eV (Sharp & Dowell
1969; Rawat et al. 2008). The number
density of electrons integrated over the interval 3.857 to 8.5 eV is 9.9 × 10⁻⁸ cm-3. We find a production rate
for NH
by reaction (B.3) of
(B.1)where
e∗ represents an energetic electron. The
energetic threshold for this process is ε = 3.857 eV, potentially leading to an unusually
high production rate. At kinetic temperatures of the order of 100 K or less, the thermal
electrons have a characteristic energy less than 9 meV. Therefore, the hot electrons
required to form the anion are extremely superthermal. A self-consistent treatment of
the electron speed distribution in the weakly ionised interstellar medium is currently
being investigated (Black, in prep.). The crucial energy range for reaction (B.3) is 3.8 to 8.5 eV. In photon-dominated
regions, including diffuse molecular clouds, such electrons are produced mainly by the
same photoelectric effect involving dust and large molecules that dominates the heating
of the gas. Energetic electrons are thermalised primarily by collisions with neutrals (H
and H2), rather
than by elastic collisions with thermal electrons, as long as the fractional ionisation
is less than 10-3. The cross-section, σDA, for the
dissociative attachment process has a peak value of 1.6 Mb near ε = 5.8 eV, with
vanishing values at ε< 4.2 and at
ε>
8.5 eV (Sharp & Dowell
1969; Rawat et al. 2008). The number
density of electrons integrated over the interval 3.857 to 8.5 eV is 9.9 × 10⁻⁸ cm-3. We find a production rate
for NH
by reaction (B.3) of
 (B.2)The possible
destruction processes of NH
include photo-detachment, reactions with H2, and mutual neutralisation in reactions with the most
abundant positive ions. The reaction with H2,
(B.2)The possible
destruction processes of NH
include photo-detachment, reactions with H2, and mutual neutralisation in reactions with the most
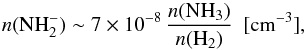
abundant positive ions. The reaction with H2,  (B.3)is known to be
rapid at low temperatures around 20 K but to decrease with increasing temperature (Otto et al. 2008). If the reaction with
H2 is the
dominant loss process, then the density of NH
at T = 50−100 K will be of the order of
(B.3)is known to be
rapid at low temperatures around 20 K but to decrease with increasing temperature (Otto et al. 2008). If the reaction with
H2 is the
dominant loss process, then the density of NH
at T = 50−100 K will be of the order of
 (B.4)which immediately
suggests a very low NH
abundance.
(B.4)which immediately
suggests a very low NH
abundance.
A second formation route of NH is via slow radiative attachment of electrons to NH2
 (B.5)Radiative
attachment via emission from excited vibrational states has been calculated to be an
efficient process to produce negative molecular ions with large electron affinities
(3−4 eV) and at least four
atoms (Herbst & Osamura 2008). The
NH
anion is smaller than this limit and has only a moderate electron affinity of 0.771 eV
(Wickham-Jones et al. 1989). Using Eq. (11)
(B.5)Radiative
attachment via emission from excited vibrational states has been calculated to be an
efficient process to produce negative molecular ions with large electron affinities
(3−4 eV) and at least four
atoms (Herbst & Osamura 2008). The
NH
anion is smaller than this limit and has only a moderate electron affinity of 0.771 eV
(Wickham-Jones et al. 1989). Using Eq. (11)
in Herbst & Osamura (2008), we estimate
the rate coefficient for radiative attachment via the vibrational mechanism to be only
1 ×
10-17(T/ 300 K)−1
/ 2 cm3 s-1. The process is at most
competitive with dissociative attachment of NH3 via non-thermal electrons, and does not change the
conclusion that the NH
anion has a low abundance. Finally, if the anion is formed in a local region rich in
atomic rather than molecular hydrogen, it can be destroyed by associative attachment
with atomic hydrogen, 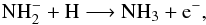 (B.6)or
competitively via photo-detachment.
(B.6)or
competitively via photo-detachment.
Appendix C: Chemical models
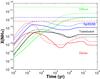 |
Fig. C.1
Temporal evolution of the NH+ abundance for all four models (Table 3) where each model is plotted with a high metal abundance (dashed lines) and with a low metal abundance (solid lines). The translucent and dense models are plotted for TK = 30 K alone. The observed upper limits are indicated with dashed horizontal lines following the respective model colour code. |
| Open with DEXTER | |
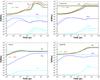 |
Fig. C.2
Temporal evolution of the nitrogen hydride abundances. Upper
left: dense gas; upper right: translucent gas;
lower left: diffuse gas; lower right:
Sgr B2 (M) envelope model (see Table 3).
The dot-dashed and dotted lines for NH |
| Open with DEXTER | |
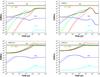 |
Fig. C.3
Translucent gas conditions in all models (see Table 3). Upper left: pure gas phase chemistry.
Upper right: gas and surface chemistry and inactive non-thermal
desorption efficiency aRRK = 0. Lower
left: gas and surface chemistry and active non-thermal desorption with
the typical efficiency aRRK = 0.01. Lower
right: gas and surface chemistry and high active non-thermal desorption
(aRRK =
0.1). The observed abundances and upper limits are indicated
with solid and dashed horizontal lines, respectively, following the respective
species colour code. The dot-dashed and dotted lines for
NH |
| Open with DEXTER | |
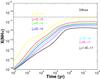 |
Fig. C.4
Temporal evolution of the NH+ abundance for different cosmic ray ionisation rates for diffuse gas conditions (Table 3). The dashed black line represents the observed upper NH+ limit in the diffuse gas. |
| Open with DEXTER | |
Appendix D: Tables
Hyperfine structure components of NH+ N = 1−1,J =
1.5−−0.5+.
N = 1−1,J =
1.5−−0.5+.
Hyperfine structure components of NH+N = 1−1,J =
1.5+−0.5−.
Para-NH ,
JKa,Kc
= 11,1−00,0. Spectroscopic data from Tack et al. (1986). See Sect. 2 for more details.
,
JKa,Kc
= 11,1−00,0. Spectroscopic data from Tack et al. (1986). See Sect. 2 for more details.
Herschel OBSID’s of the observed transitions analysed in this paper.
Initial elemental abundances.
© ESO, 2014
Current usage metrics show cumulative count of Article Views (full-text article views including HTML views, PDF and ePub downloads, according to the available data) and Abstracts Views on Vision4Press platform.
Data correspond to usage on the plateform after 2015. The current usage metrics is available 48-96 hours after online publication and is updated daily on week days.
Initial download of the metrics may take a while.