Fig. 5
Download original image
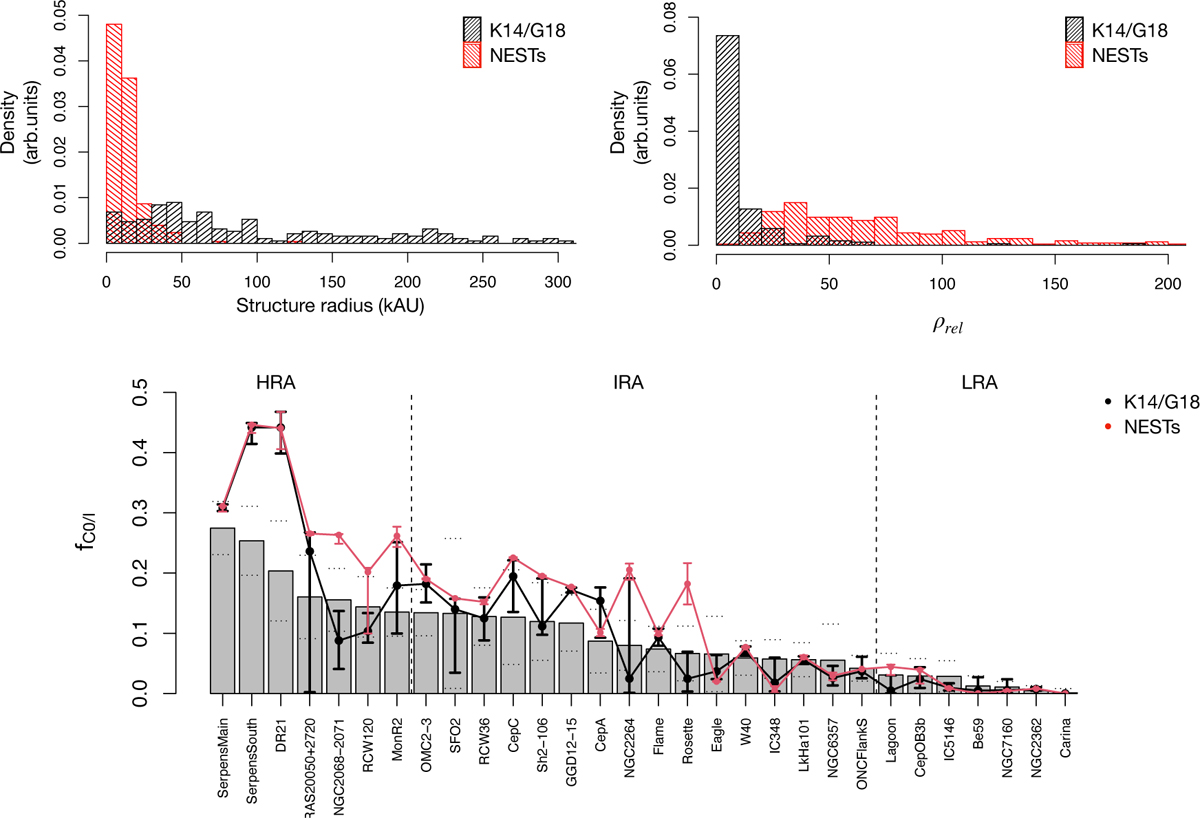
Comparison of structures from K14 and G18. Top left: histogram of the size of NESTs (red) and the structures from K14 and G18 in kilo astronomical units. Top Right: histogram of relative average density and the structures from K14 and G18. Bottom: grey bars show the average ratio, f̄C0/I, in each region, with small horizontal dotted lines showing the limits f̄C0/I ± σfC0/I. Red (resp. black) dots show the median values of fC0/I from the relative-risk maps in the area occupied by the convex hull of NESTs (resp. structures from K14 and G18), with error bars representing the first and third quartiles. Solid red (resp. black) lines join the median values of fC0/I for NESTs (resp. K14 and G18) to help compare the values. Finally, vertical lines separate the HRA, IRA, and LRA regimes.
Current usage metrics show cumulative count of Article Views (full-text article views including HTML views, PDF and ePub downloads, according to the available data) and Abstracts Views on Vision4Press platform.
Data correspond to usage on the plateform after 2015. The current usage metrics is available 48-96 hours after online publication and is updated daily on week days.
Initial download of the metrics may take a while.