Fig. 4
Download original image
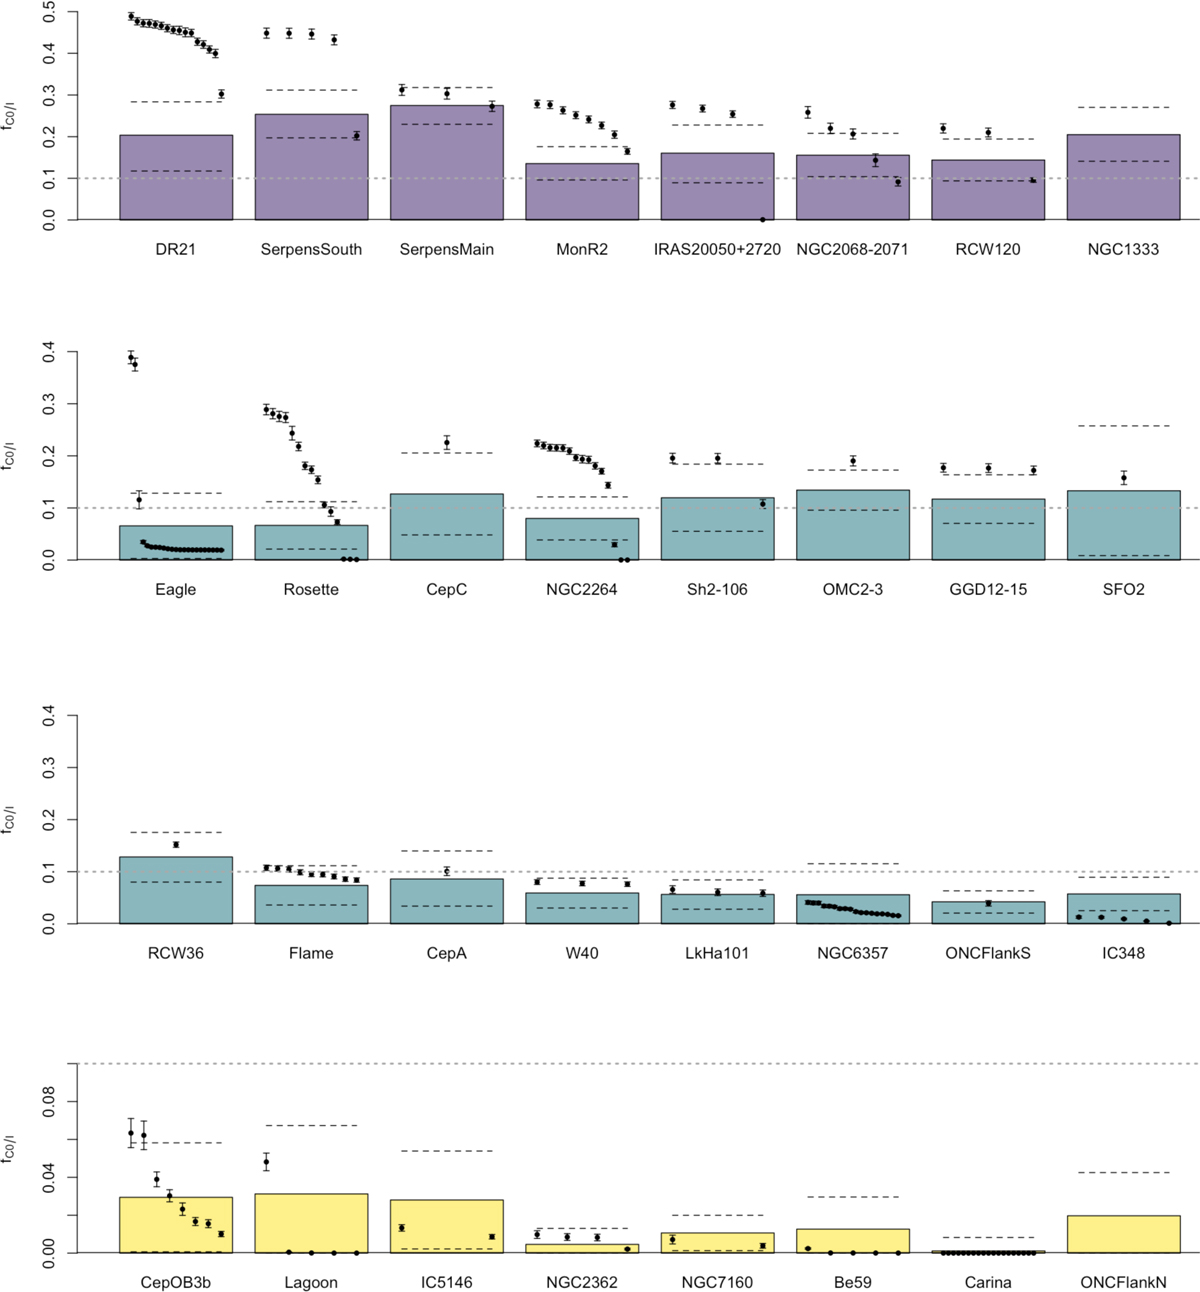
Bar plots display the average fraction of C0/I objects in each region, with dotted black lines indicating the limits for categorizing NESTs as high-activity or low activity, that is ![]() . The colour of the bars represents the regime of each region, and black dots represent the values of fC0/I in each NEST, along with its corresponding standard deviation, in decreasing order. Regions within each regime are ordered by fNEST,max, the maximum value of fC0/I in NESTs. The value fC0/I = 0.1 is marked in all panels for comparison.
. The colour of the bars represents the regime of each region, and black dots represent the values of fC0/I in each NEST, along with its corresponding standard deviation, in decreasing order. Regions within each regime are ordered by fNEST,max, the maximum value of fC0/I in NESTs. The value fC0/I = 0.1 is marked in all panels for comparison.
Current usage metrics show cumulative count of Article Views (full-text article views including HTML views, PDF and ePub downloads, according to the available data) and Abstracts Views on Vision4Press platform.
Data correspond to usage on the plateform after 2015. The current usage metrics is available 48-96 hours after online publication and is updated daily on week days.
Initial download of the metrics may take a while.