Fig. 1
Download original image
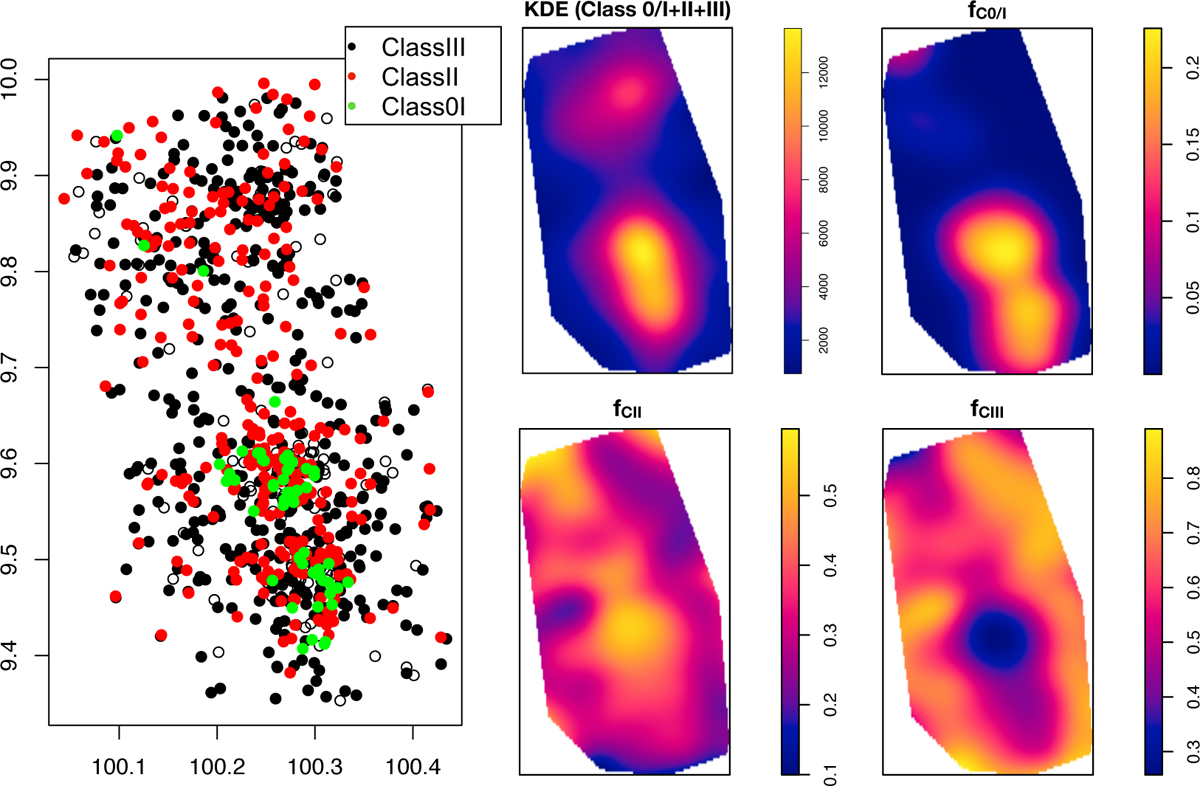
Spatial distribution and relative-risk maps for NGC2264. Left: spatial distribution of objects in NGC2264. Dots represent each source in the complete sample, coloured according to the evolutionary stage classification described in Section 2.3.1 (green for Class 0/I, red for Class II, black for Class III, and empty for unclassified and non-stellar objects). Right: four-panel composite showcasing the associated densities and relative-risk maps. Top left: KDE estimate corresponding to the classified sub-sample in the left panel. Top right: relative-risk maps of Class 0/I objects. Bottom panels: relative-risk maps of Class II and Class III objects.
Current usage metrics show cumulative count of Article Views (full-text article views including HTML views, PDF and ePub downloads, according to the available data) and Abstracts Views on Vision4Press platform.
Data correspond to usage on the plateform after 2015. The current usage metrics is available 48-96 hours after online publication and is updated daily on week days.
Initial download of the metrics may take a while.