Fig. 9.
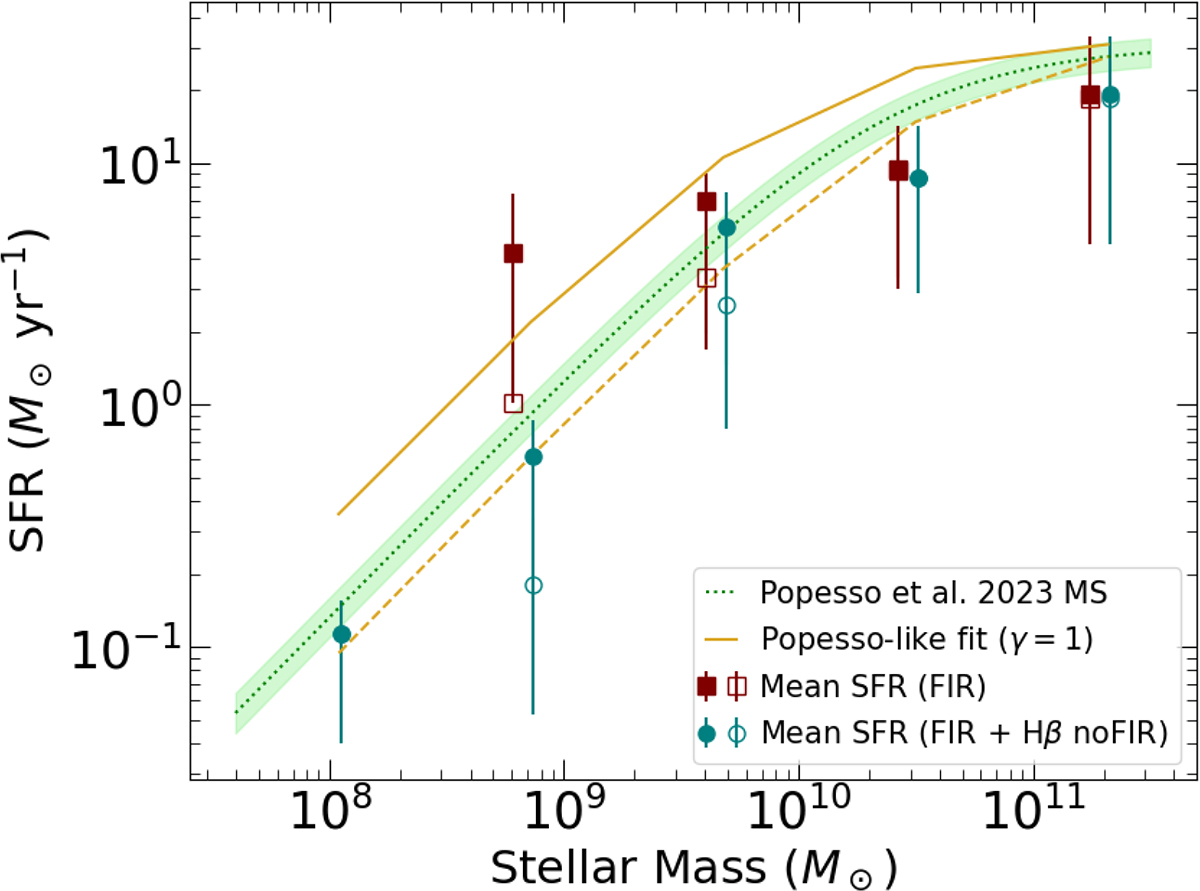
Download original image
Mean SFR per stellar-mass bin of equal logarithmic width for the FIR-emitter sample (squares) and the combined FIR plus Hβ no-FIR sample (circles) using identical mass bins for both. The number of galaxies per bin for the FIR-only sample is [2, 14, 12, 29, 4], and for the combined sample, it is [11, 17, 20, 30, 16]. Filled symbols include sources affected by FIR upper limits, while open symbols show the results after excluding them. Error bars indicate the 68% central interval of the SFR distribution within each bin. The dotted green line and contours represent the star-forming MS ±1σ at z ∼ 0.9 from Popesso et al. (2023). The solid orange line shows a Popesso-like fit to the FIR-only binned data, with log(SFRmax) = 1.51 and γ = 1 fixed, following the parametrization in Table 2 of Popesso et al. (2023). The dotted orange line shows the same fit after excluding sources affected by upper limits.
Current usage metrics show cumulative count of Article Views (full-text article views including HTML views, PDF and ePub downloads, according to the available data) and Abstracts Views on Vision4Press platform.
Data correspond to usage on the plateform after 2015. The current usage metrics is available 48-96 hours after online publication and is updated daily on week days.
Initial download of the metrics may take a while.