Fig. 8.
Download original image
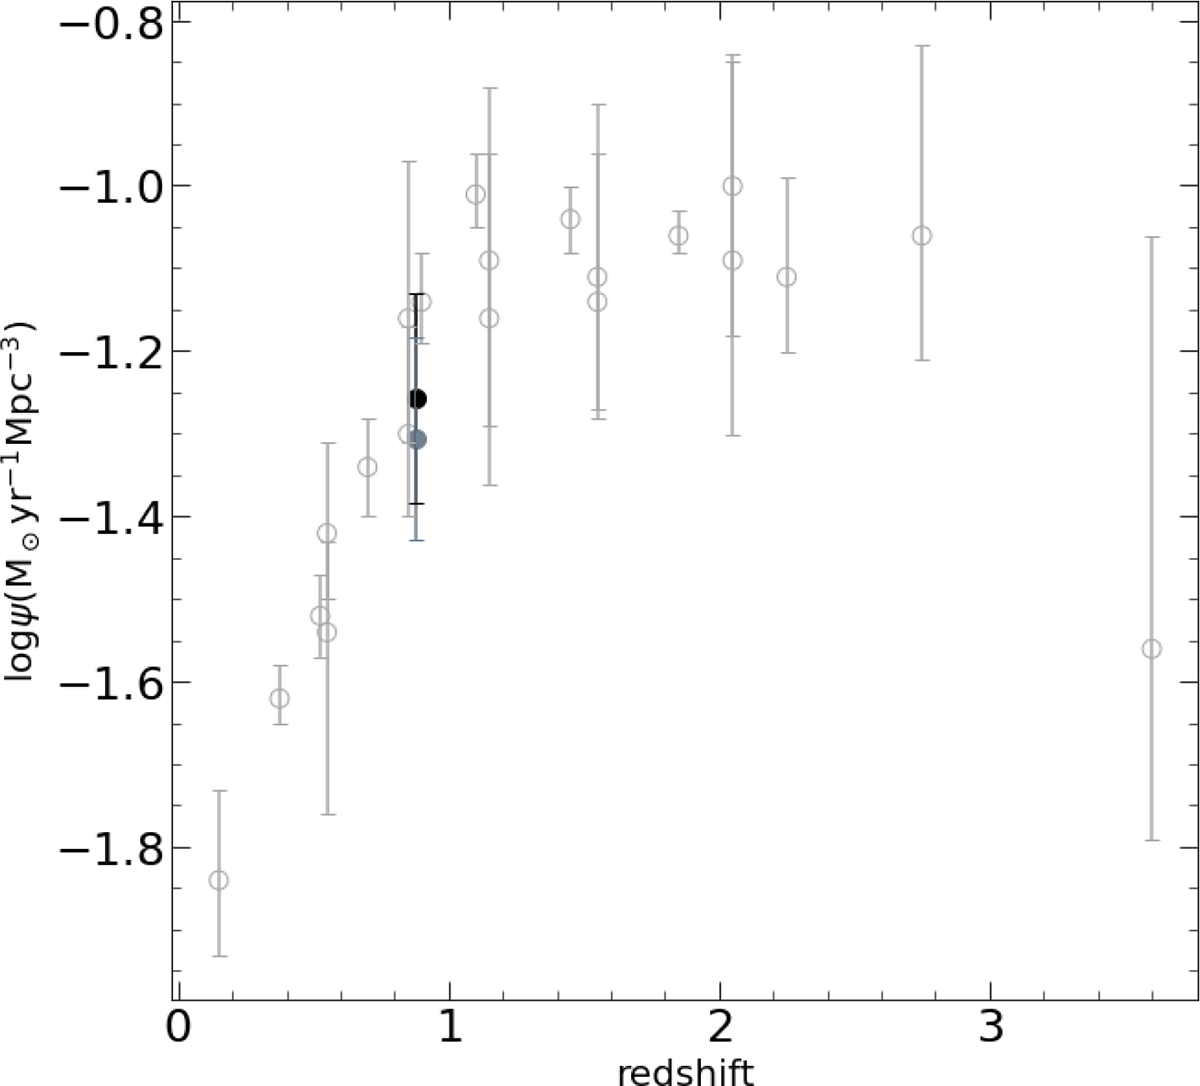
Star-formation rate density as a function of redshift. Grey empty markers show the compilation from Madau & Dickinson (2014), adjusted to a Chabrier IMF. The black filled circle shows the SFRD derived for our FIR-emitter sample including sources affected by FIR upper limits, while the black open circle shows the SFRD obtained after excluding these sources.
Current usage metrics show cumulative count of Article Views (full-text article views including HTML views, PDF and ePub downloads, according to the available data) and Abstracts Views on Vision4Press platform.
Data correspond to usage on the plateform after 2015. The current usage metrics is available 48-96 hours after online publication and is updated daily on week days.
Initial download of the metrics may take a while.