Fig. 7.
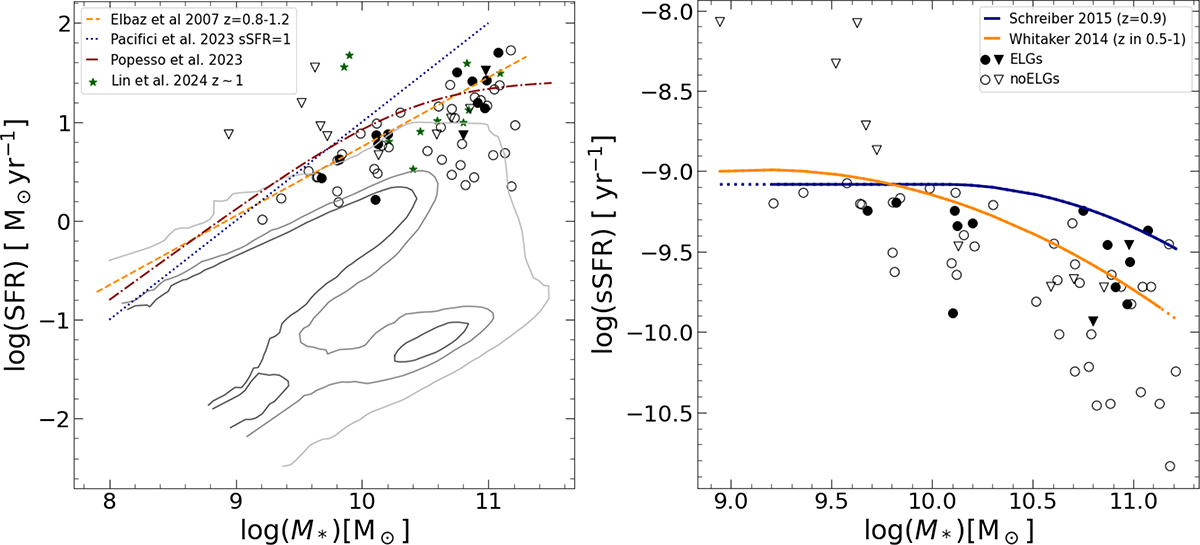
Download original image
Star formation rate as a function of M★ (top) and sSFR (SFR divided by stellar mass, bottom) for the whole sample. Line emitters and non-emitting galaxies are indicated with filled and unfilled markers, respectively. Downward triangles mark those sources affected by FIR upper limits. For the plot on the left, contours correspond to the number density of galaxies from the SDSS database and those obtained by Renzini & Peng (2015) at values of 1.2 × 10⁵ (inner), 7.0 × 10⁴ (middle), and 2.0 × 10⁴ (outer). These contours reveal the position of the star formation MS for local galaxies. Green stars represent the PAH luminous galaxies at z ∼ 1 sample from Lin et al. (2024). The plot on the right shows the different positions of the star formation MS given by Schreiber et al. (2015) and Whitaker et al. (2014). For each MS, we differentiate the mass range used by each author from the extrapolation by plotting the latter with a discontinuous line.
Current usage metrics show cumulative count of Article Views (full-text article views including HTML views, PDF and ePub downloads, according to the available data) and Abstracts Views on Vision4Press platform.
Data correspond to usage on the plateform after 2015. The current usage metrics is available 48-96 hours after online publication and is updated daily on week days.
Initial download of the metrics may take a while.