Fig. 4.
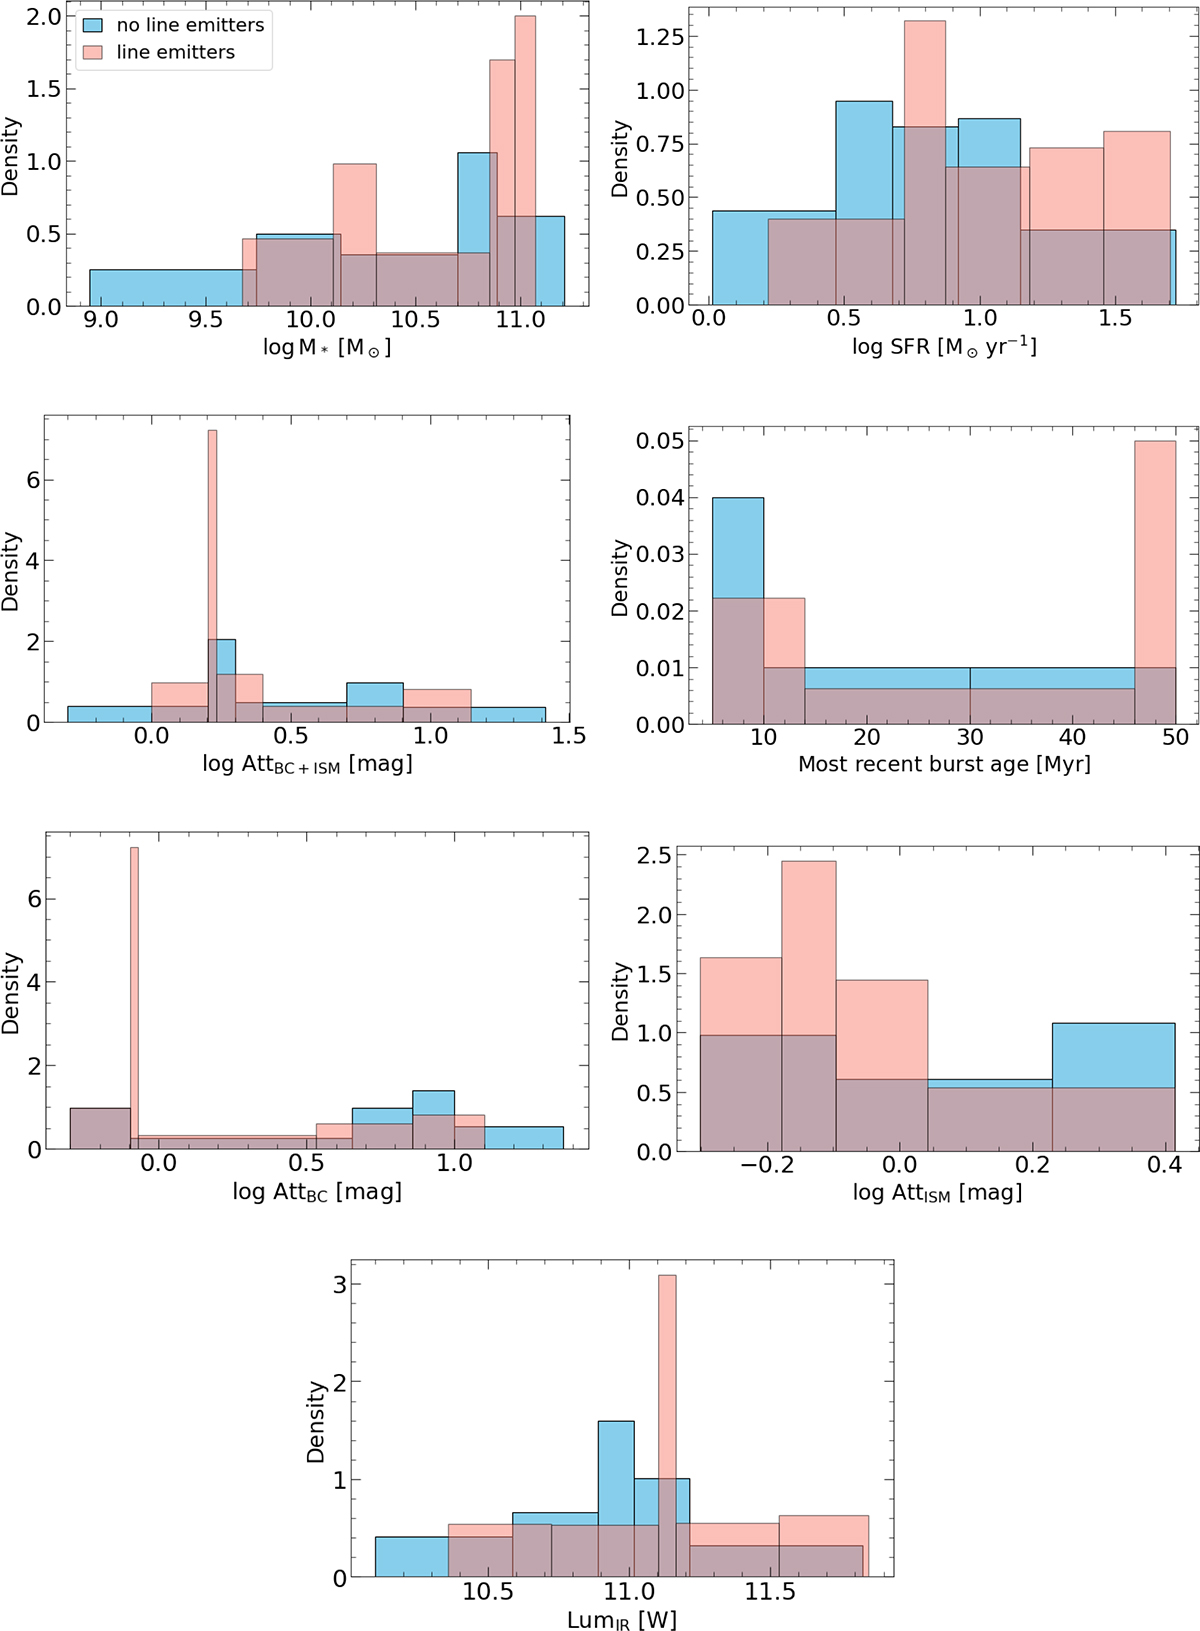
Download original image
Distribution of significant parameters for the sample. The pink histogram represents line-emitting sources, and the blue histogram portrays non-emitters. From top left to bottom right: stellar mass, average SFR over 10 Myr, attenuation, age of the most recent starburst, birth-cloud attenuation, interstellar medium attenuation, and IR luminosity. Each bar represents an equal probability (20%, except 33% for burst age).
Current usage metrics show cumulative count of Article Views (full-text article views including HTML views, PDF and ePub downloads, according to the available data) and Abstracts Views on Vision4Press platform.
Data correspond to usage on the plateform after 2015. The current usage metrics is available 48-96 hours after online publication and is updated daily on week days.
Initial download of the metrics may take a while.