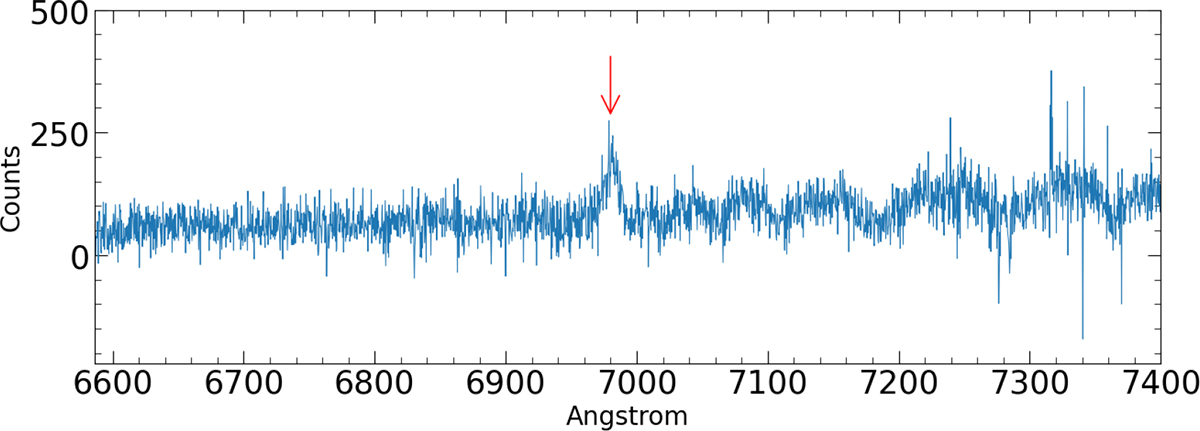
Fig. 1.
Download original image
Example DEEP2 spectrum of source 9550, whose emission lines are not detected in the OTELO pseudo-spectrum. The line (red arrow) is detected in the DEEP2 spectrum with a very low S/N, indicating intrinsically weak nebular emission. At this redshift, Hβ and both [O III] emission lines fall within the OTELO wavelength range (8950–9300 Å), but their expected fluxes remain below the OTELO detection threshold and may lie close to the edges of the wavelength coverage. Therefore, this source is not classified as an emission-line object in the OTELO survey.
Current usage metrics show cumulative count of Article Views (full-text article views including HTML views, PDF and ePub downloads, according to the available data) and Abstracts Views on Vision4Press platform.
Data correspond to usage on the plateform after 2015. The current usage metrics is available 48-96 hours after online publication and is updated daily on week days.
Initial download of the metrics may take a while.