Fig. 5.
Download original image
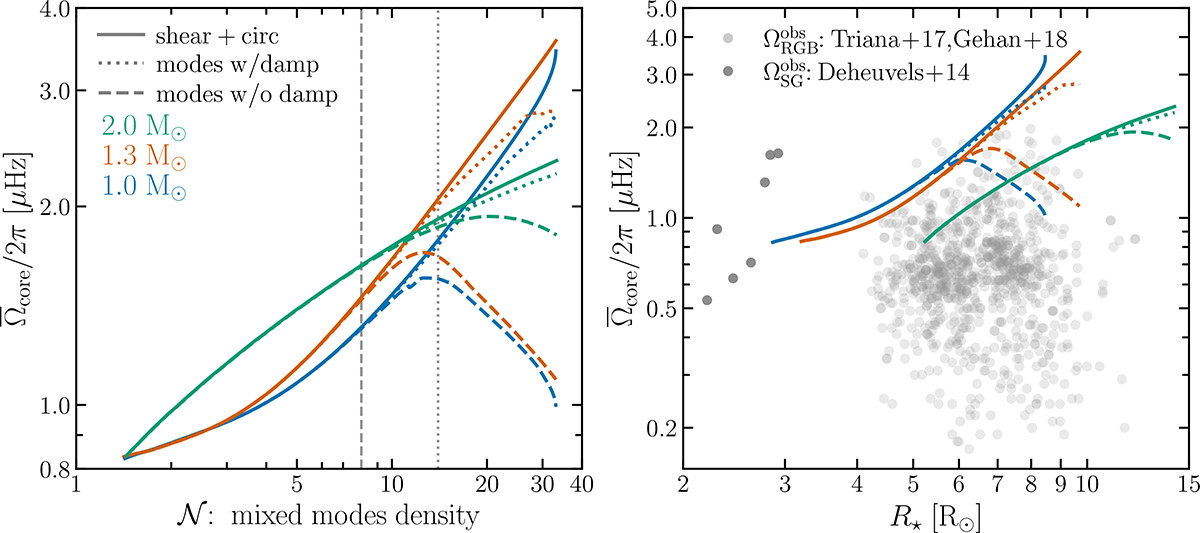
Core rotation rates along evolution. Left panel: Average core rotation rate (logarithmic scale) as a function of mixed mode density. Right panel: Average core rotation rate (logarithmic scale) as a function of stellar radius (logarithmic scale). The different colours represent evolutionary tracks with different stellar masses and the different line styles indicate the angular momentum transport mechanisms included as per the legend. The vertical dashed (dotted) grey lines in the left panel indicate the values 𝒩 = 8 (𝒩 = 14), respectively. The grey circles in the right panel indicate the observed core rotation rates from Deheuvels et al. (2014), Triana et al. (2017), Gehan et al. (2018).
Current usage metrics show cumulative count of Article Views (full-text article views including HTML views, PDF and ePub downloads, according to the available data) and Abstracts Views on Vision4Press platform.
Data correspond to usage on the plateform after 2015. The current usage metrics is available 48-96 hours after online publication and is updated daily on week days.
Initial download of the metrics may take a while.