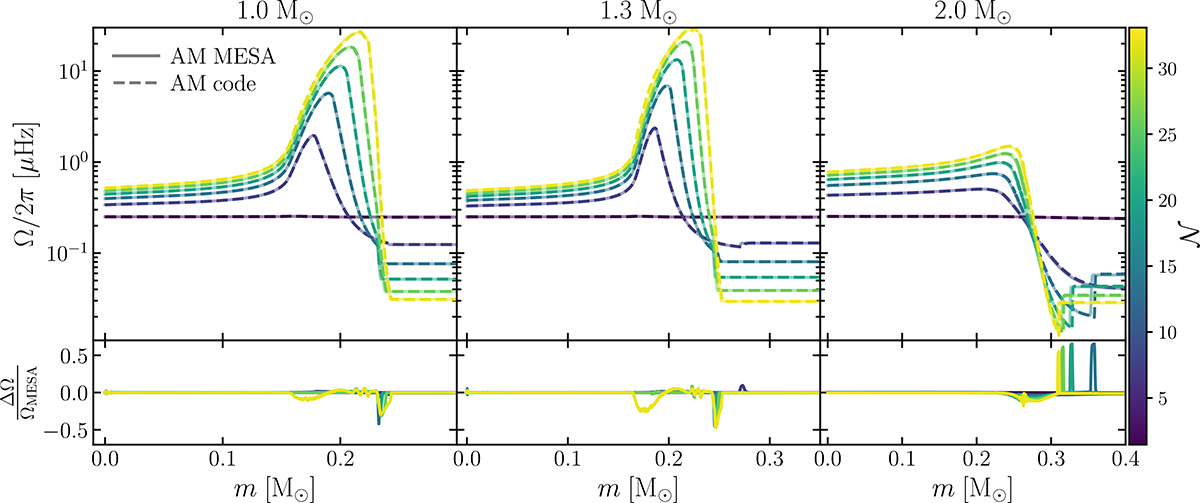
Fig. E.1.
Download original image
Top panel: Rotation rate (logarithmic scale) as a function of the fractional stellar mass. The line colour represents the evolutionary stage of the model in terms of mixed mode density. The dashed lines represent models computed using MESA angular momentum transport prescription. The solid lines represent models computed using our angular momentum transport prescription. The left, centre and right panels showcase models with different stellar masses. Bottom panel: Relative difference in rotation rate between MESA and our models.
Current usage metrics show cumulative count of Article Views (full-text article views including HTML views, PDF and ePub downloads, according to the available data) and Abstracts Views on Vision4Press platform.
Data correspond to usage on the plateform after 2015. The current usage metrics is available 48-96 hours after online publication and is updated daily on week days.
Initial download of the metrics may take a while.